ㅁ Add-on 가능: 고객의 요청에 따라 일정한 범위 내에서 Customization이 가능합니다. 자세한 사항은 문의해 주시기 바랍니다.
ㅁ 보고서에 따라 최신 정보로 업데이트하여 보내드립니다. 배송기일은 문의해 주시기 바랍니다.
한글목차
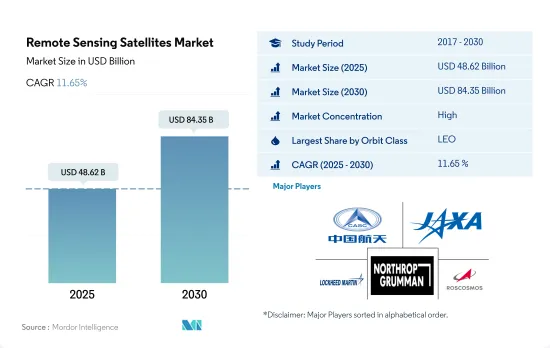
세계의 원격 탐사 위성 시장 규모는 2025년 486억 2,000만 달러로 예측되고, 2030년에는 843억 5,000만 달러에 이르고, 예측 기간 중(2025-2030년) CAGR 11.65%를 나타낼 것으로 예측됩니다.
LEO 위성 수요가 시장을 견인해 2029년에는 79.5%의 점유율을 기록
다양한 원격 탐사 위성이 설계와 주요 목적에 따라 다양한 거리에서 지구를 돌고 있습니다. 이러한 위성은 목적과 용도에 따라 발사되거나 다른 궤도에 투입됩니다. 궤도에 투입되는 위성에는 각각 이점과 과제가 있으며, 커버 범위의 확대나 에너지 효율의 저하 등이 있습니다.
2017년부터 2022년 사이에 발사된 원격 탐사 위성의 약 90%*는 지구관측이나 과학 등의 용도를 위해 저궤도에 배치되었습니다. 이것은 이 궤도가 지구에 가깝기 때문에 공간적인 고해상도 이미지를 지연없이 전송하는 데 도움이 되기 때문입니다. 따라서 이 궤도의 장점이 증가함에 따라 LEO 궤도에 배치된 이러한 위성에 대한 수요는 예측 기간 동안 증가할 것으로 예상됩니다. 마찬가지로 2017-2022년 사이에 MEO 궤도에서 발사된 56대의 위성 중 46대는 내비게이션/전지구 측위 목적으로 건설되었습니다. GEO 궤도의 147 위성 중 105 위성이 통신 용도에 배치되어 있습니다.
전자정보, 지구과학/기상학, 레이저 이미징, 광학 이미징, 기상학 등의 목적으로 원격 탐사 위성의 이용이 증가하고 있으며, 예측 기간 동안 원격 탐사 위성 시장 수요를 견인할 것으로 예상됩니다.
아시아태평양은 예측기간 중 가장 높은 성장이 예상된다.
세계의 원격 탐사 위성 시장은 고속 인터넷, 통신 서비스 및 다양한 업계에서의 데이터 전송 수요 증가를 배경으로 향후 수년간 크게 성장할 것으로 예상됩니다. 북미, 유럽, 아시아태평양은 시장 점유율과 수익 창출의 주요 지역입니다. 2017-2022년 동안 총 147대의 원격 탐사 위성이 제조 및 출시되었습니다.
북미는 Boeing, Lockheed Martin, Northrop Grumman 등 여러 대형 시장 기업이 존재하기 때문에 세계의 원격 탐사 위성 시장을 독점할 것으로 예상되고 있습니다. 미국 정부도 첨단 위성기술 개발에 많은 투자를 하고 있으며, 이는 북미 시장의 성장을 가속할 것으로 보입니다. 2017-2022년 동안 이 지역은 제조된 원격 탐사 위성 전체의 30%를 차지했습니다.
유럽의 원격 탐사 위성 시장은 고속 인터넷 및 통신 서비스에 대한 수요 증가로 인해 상당한 성장이 예상됩니다. 유럽우주기구(ESA)는 첨단 위성기술 개발에 엄청난 투자를 하고 있으며, 이 지역 시장 성장을 견인할 것으로 기대되고 있습니다. 2017-2022년 동안 이 지역은 제조된 원격 탐사 위성 전체의 11%를 차지했습니다.
아시아태평양은 중국, 인도, 일본 등의 국가에서 위성 기반 통신 서비스 및 내비게이션 시스템에 대한 수요가 증가하고 있기 때문에 원격 탐사 위성 시장에서 큰 성장이 예상됩니다. 2017-2022년 동안 이 지역은 제조된 원격 탐사 위성 전체의 59%를 차지했습니다.
세계의 원격 탐사 위성 시장 동향
전 지역에서 위성 소형화 수요 증가가 시장을 견인
소형 위성은 기존의 위성의 거의 모든 기능을 약간의 비용으로 실행할 수 있기 때문에 소형 위성 별자리의 구축, 발사, 운영의 실행 가능성이 높아지고 있습니다. 북미 수요는 매년 가장 많은 소형 위성을 생산하는 미국이 주로 견인하고 있습니다. 북미에서는 2017년부터 2022년까지 총 596대의 초소형 위성이 다양한 지역의 기업에 의해 궤도에 투입되었습니다. NASA는 현재 이러한 위성 개발을 목표로 하는 여러 프로젝트에 참여하고 있습니다.
유럽 수요는 주로 독일, 프랑스, 러시아, 영국이 견인하고 있으며 매년 가장 많은 소형 위성을 생산하고 있습니다. 2017년부터 2022년까지, 50기 이상의 초소형 위성이 다양한 지역의 기업에 의해 궤도에 투입되었습니다. 전자부품과 시스템의 소형화와 상업화가 시장 진출 기업을 견인해, 그 결과, 현재의 시장 시나리오를 활용해, 강화하는 것을 목표로 하는 새로운 시장 기업이 출현하고 있습니다. 예를 들어, 영국에 본사를 둔 신흥 기업인 Open Cosmos는 ESA와 제휴하여 약 90%의 경쟁력 있는 비용 절감을 실현하면서 최종 사용자에게 상업용 초소형 위성 발사 서비스를 제공합니다.
아시아태평양 수요는 주로 중국, 일본, 인도가 견인하고 있으며, 이들 국가는 연간 최대 수의 소형 위성을 생산하고 있습니다. 2017-2022년 동안 190대 이상의 초소형 위성이 다양한 지역의 기업들에 의해 궤도에 투입되었습니다. 중국은 우주 기반의 능력 증진을 향해 많은 자원을 투입하고 있습니다. 동국은 지금까지 아시아태평양에서 가장 많은 초소형 위성을 발사해 왔습니다.
위성 제조 투자 기회가 시장을 견인
북미에서는 우주 계획을 위한 세계 정부 지출이 2021년 과거 최고의 약 1,030억 달러에 달했습니다. 이 지역은 세계 최대의 우주 기관인 NASA가 존재하는 우주 혁신과 연구의 진원지입니다. 2022년 미국 정부는 우주 프로그램에 약 620억 달러를 지출하여 우주 프로그램에 대한 지출액이 세계 최대가 되었습니다. 미국에서는 연방 정부 기관이 매년 323억 3,000만 달러 상당의 자금을 의회에서 받고 있습니다.
유럽 국가들은 우주 지역에서 다양한 투자의 중요성을 인식하고 있으며, 세계 우주 산업에서 경쟁을 유지하기 위해 혁신적인 활동에 대한 지출을 늘리고 있습니다. 2022년 11월, ESA는 지구관측에 있어서 유럽의 리드를 유지하고, 항법 서비스를 확대하고, 미국과의 우주 탐사에 있어서의 파트너인 것을 계속하는 것을 목적으로, 향후 3년간에 우주 자금을 25% 증액할 것을 제안했다고 발표했습니다. 유럽우주기구(ESA)는 2023년부터 2025년까지 약 185억 유로의 예산을 지지하도록 22개국에 요구하고 있습니다. 독일, 프랑스, 이탈리아가 주요 기여국입니다.
아시아태평양에서 우주 관련 활동이 증가함에 따라 2022년 일본 예산안은 우주 예산 증가를 기록했으며, 그 금액은 14억 달러를 넘어섰습니다. 여기에는 H3 로켓, 기술 시험 위성 9호, 정보 수집 위성(IGS) 계획의 개발이 포함됩니다. 마찬가지로 22년도 인도의 우주개발 예산안은 18억 3,000만 달러였습니다. 2022년 한국의 과학정보통신부는 인공위성, 로켓 및 기타 주요 우주 장비 제조를 위해 6억 1,900만 달러의 우주 예산을 발표했습니다.
원격 탐사 위성 산업 개요
원격 탐사 위성 시장은 상당히 통합되어 있으며 상위 5개 기업에서 85.94%를 차지합니다. 이 시장 주요 기업은 다음과 같습니다. China Aerospace Science and Technology Corporation(CASC), Japan Aerospace Exploration Agency(JAXA), Lockheed Martin Corporation, Northrop Grumman Corporation, ROSCOSMOS(알파벳순).
기타 혜택
엑셀 형식 시장 예측(ME) 시트
3개월간의 애널리스트 서포트
목차
제1장 주요 요약과 주요 조사 결과
제2장 보고서 제안
제3장 소개
조사의 전제조건과 시장 정의
조사 범위
조사 방법
제4장 주요 산업 동향
위성의 질량
위성의 소형화
우주 개발에 대한 지출
규제 프레임워크
세계
호주
브라질
캐나다
중국
프랑스
독일
인도
이란
일본
뉴질랜드
러시아
싱가포르
한국
아랍에미리트(UAE)
영국
미국
밸류체인과 유통채널 분석
제5장 시장 세분화
위성 질량
10-100kg
100-500kg
500-1000kg
10kg 미만
1000kg 이상
궤도 클래스
GEO
LEO
MEO
위성 서브시스템
추진 하드웨어 및 추진제
위성 버스 및 서브시스템
태양전지 어레이 및 전원 하드웨어
구조, 하네스, 기구
최종 사용자
상업
군사 및 정부
기타
지역
아시아태평양
유럽
북미
세계 기타 지역
제6장 경쟁 구도
주요 전략 동향
시장 점유율 분석
기업 상황
기업 프로파일.
Airbus SE
Ball Corporation
China Aerospace Science and Technology Corporation(CASC)
ESRI
GomSpaceApS
IHI Corporation
Indian Space Research Organisation(ISRO)
Japan Aerospace Exploration Agency(JAXA)
Lockheed Martin Corporation
Maxar Technologies Inc.
Northrop Grumman Corporation
Planet Labs Inc.
ROSCOSMOS
Spire Global, Inc.
Thales
제7장 CEO에 대한 주요 전략적 질문
제8장 부록
세계 개요
개요
Porter's Five Forces 분석 프레임워크
세계의 밸류체인 분석
시장 역학(DROs)
정보원과 참고문헌
도표 일람
주요 인사이트
데이터 팩
용어집
JHS
영문 목차
영문목차
The Remote Sensing Satellites Market size is estimated at 48.62 billion USD in 2025, and is expected to reach 84.35 billion USD by 2030, growing at a CAGR of 11.65% during the forecast period (2025-2030).
Demand for LEO satellites is driving the market and registers a share of 79.5% in 2029
Various remote sensing satellites orbit the Earth at varying distances depending on their design and primary purpose. These satellites are launched or placed into different orbits according to their purposes/applications. Each satellite deployed into orbit has its own benefits and challenges, which include increased coverage and decreased energy efficiency.
Around 90% of the remote sensing satellites launched between 2017 and 2022* were placed in low Earth orbit for Earth observation and science, among other applications. This is because of the close proximity of this orbit to the Earth, which helps send spatial high-resolution images without any latency. Therefore, with the increased benefits of this orbit, the demand for these satellites to be deployed in the LEO orbit is expected to rise during the forecast period. Similarly, during 2017-2022, of the 56 satellites launched in the MEO orbit, 46 were built for Navigation/Global Positioning purposes. Of the 147 satellites in the GEO orbit, 105 satellites have been deployed for communication applications.
The increasing use of remote sensing satellites for purposes such as electronic intelligence, Earth science/meteorology, laser imaging, optical imaging, and meteorology is expected to drive the demand for the remote sensing satellites market during the forecast period.
Asia-Pacific is expected to witness highest growth during the forecast period
The global remote sensing satellite market is expected to grow significantly over the coming years, driven by increasing demand for high-speed internet, communication services, and data transfer across different industries. North America, Europe, and Asia-Pacific are the major regions in terms of market share and revenue generation. During 2017-2022, a total of 147 remote sensing satellites were manufactured and launched.
North America is expected to dominate the global remote sensing satellite market due to the presence of several leading market players, such as Boeing, Lockheed Martin, and Northrop Grumman, in the region. The US government is also investing heavily in the development of advanced satellite technology, which is expected to drive the growth of the market in North America. During 2017-2022, the region accounted for 30% of the total remote sensing satellites manufactured.
The remote sensing satellite market in Europe is expected to grow significantly due to the increasing demand for high-speed internet and communication services. The European Space Agency (ESA) has been investing heavily in the development of advanced satellite technology, which is expected to drive the growth of the market in the region. During 2017-2022, the region accounted for 11% of the total remote sensing satellites manufactured.
Asia-Pacific is expected to witness significant growth in the remote sensing satellite market due to the increasing demand for satellite-based communication services and navigation systems in countries such as China, India, and Japan. During 2017-2022, the region accounted for 59% of the total remote sensing satellites manufactured.
Global Remote Sensing Satellites Market Trends
Rising demand for satellite miniaturization across all regions is driving the market
The ability of small satellites to perform nearly all the functions of traditional satellites at a fraction of their cost has increased the viability of building, launching, and operating small satellite constellations. The demand from North America is primarily driven by the United States, which manufactures the largest number of small satellites each year. In North America, during 2017-2022, a total of 596 nanosatellites were placed into orbit by various regional players. NASA is also currently involved in several projects aimed at developing these satellites.
The demand from Europe is primarily driven by Germany, France, Russia, and the United Kingdom, which manufacture the largest number of small satellites each year. During 2017-2022, more than 50 nano and microsatellites were placed into orbit by various regional players. The miniaturization and commercialization of electronic components and systems have driven market participation, resulting in the emergence of new market players who aim to capitalize on and enhance the current market scenario. For instance, UK-based startup Open Cosmos partnered with ESA to provide commercial nanosatellite launch services to end users while ensuring competitive cost savings of around 90%.
The demand from Asia-Pacific is primarily driven by China, Japan, and India, which manufacture the largest number of small satellites annually. During 2017-2022, more than 190 nano and microsatellites were placed into orbit by various regional players. China is investing significant resources toward augmenting its space-based capabilities. The country has launched the most significant number of nano and microsatellites in Asia-Pacific to date.
Investment opportunities in satellite manufacturing is driving the market
In North America, global government expenditure for space programs reached a record of approximately USD 103 billion in 2021. The region is the epicenter of space innovation and research, with the presence of the world's biggest space agency, NASA. In 2022, the US government spent nearly USD 62 billion on its space programs, making it the highest spender on space programs in the world. In the United States, federal agencies receive funding from Congress every year worth USD 32.33 billion for their subsidiaries.
European countries are recognizing the importance of various investments in the space domain and are increasing their spending on innovative activities to remain competitive in the global space industry. In November 2022, ESA announced that it had proposed a 25% boost in space funding over the next three years designed to maintain Europe's lead in Earth observation, expand navigation services, and remain a partner in space exploration with the United States. The European Space Agency (ESA) is asking its 22 nations to back a budget of some EUR 18.5 billion for 2023-2025. Germany, France, and Italy are the major contributors.
In line with the increase in space-related activities in the Asia-Pacific region, in 2022, Japan's draft budget registered a rise in its space budget, which amounted to over USD 1.4 billion. It included the development of the H3 rocket, Engineering Test Satellite-9, and the nation's Information Gathering Satellite (IGS) program. Similarly, the proposed budget for India's space programs for FY22 was USD 1.83 billion. In 2022, the South Korean Ministry of Science and ICT announced a space budget of USD 619 million for manufacturing satellites, rockets, and other key space equipment.
Remote Sensing Satellites Industry Overview
The Remote Sensing Satellites Market is fairly consolidated, with the top five companies occupying 85.94%. The major players in this market are China Aerospace Science and Technology Corporation (CASC), Japan Aerospace Exploration Agency (JAXA), Lockheed Martin Corporation, Northrop Grumman Corporation and ROSCOSMOS (sorted alphabetically).
Additional Benefits:
The market estimate (ME) sheet in Excel format
3 months of analyst support
TABLE OF CONTENTS
1 EXECUTIVE SUMMARY & KEY FINDINGS
2 REPORT OFFERS
3 INTRODUCTION
3.1 Study Assumptions & Market Definition
3.2 Scope of the Study
3.3 Research Methodology
4 KEY INDUSTRY TRENDS
4.1 Satellite Mass
4.2 Satellite Miniaturization
4.3 Spending On Space Programs
4.4 Regulatory Framework
4.4.1 Global
4.4.2 Australia
4.4.3 Brazil
4.4.4 Canada
4.4.5 China
4.4.6 France
4.4.7 Germany
4.4.8 India
4.4.9 Iran
4.4.10 Japan
4.4.11 New Zealand
4.4.12 Russia
4.4.13 Singapore
4.4.14 South Korea
4.4.15 United Arab Emirates
4.4.16 United Kingdom
4.4.17 United States
4.5 Value Chain & Distribution Channel Analysis
5 MARKET SEGMENTATION (includes market size in Value in USD, Forecasts up to 2030 and analysis of growth prospects)
5.1 Satellite Mass
5.1.1 10-100kg
5.1.2 100-500kg
5.1.3 500-1000kg
5.1.4 Below 10 Kg
5.1.5 above 1000kg
5.2 Orbit Class
5.2.1 GEO
5.2.2 LEO
5.2.3 MEO
5.3 Satellite Subsystem
5.3.1 Propulsion Hardware and Propellant
5.3.2 Satellite Bus & Subsystems
5.3.3 Solar Array & Power Hardware
5.3.4 Structures, Harness & Mechanisms
5.4 End User
5.4.1 Commercial
5.4.2 Military & Government
5.4.3 Other
5.5 Region
5.5.1 Asia-Pacific
5.5.2 Europe
5.5.3 North America
5.5.4 Rest of World
6 COMPETITIVE LANDSCAPE
6.1 Key Strategic Moves
6.2 Market Share Analysis
6.3 Company Landscape
6.4 Company Profiles (includes Global Level Overview, Market Level Overview, Core Business Segments, Financials, Headcount, Key Information, Market Rank, Market Share, Products and Services, and Analysis of Recent Developments).
6.4.1 Airbus SE
6.4.2 Ball Corporation
6.4.3 China Aerospace Science and Technology Corporation (CASC)