


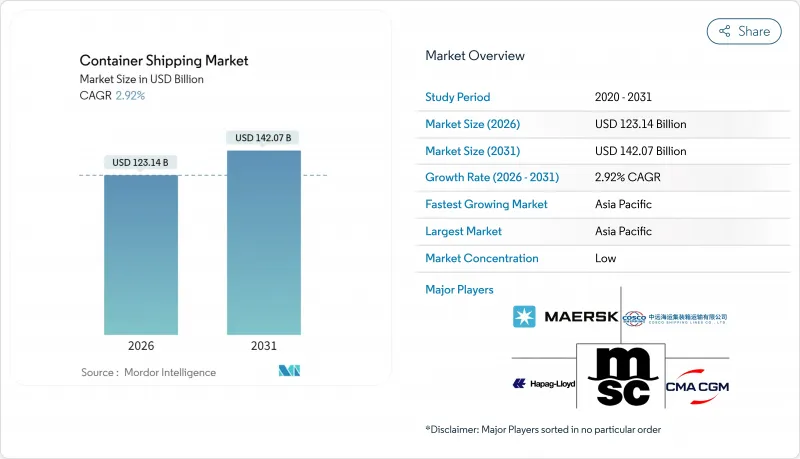
컨테이너 운송 시장은 2025년 1,196억 5,000만 달러에서 2026년 1,231억 4,000만 달러로 성장해 2026년부터 2031년에 걸쳐 CAGR 2.92%를 나타낼 전망입니다. 2031년까지 1,420억 7,000만 달러에 달할 것으로 예상됩니다.

무역협정과 전자상거래가 기초적인 수요를 보충하고 있는 한편, 선대 전체의 속도 저하, 홍해 항로의 지속적인 우회, 규제 비용 기반의 확대가 공급을 억제하고 있습니다. 해운회사는 네트워크의 신뢰성 향상에 주력하고 있으며, 신규 얼라이언스 형성에서는 90% 이상의 정시운항률을 목표로 하면서 가장 회복력 있는 항로에 수송능력을 재분배하고 있습니다. 육상 혼잡에 대한 방어책으로서, 또 새로운 수익원을 획득하는 수단으로서 터미널 소유권의 확대가 계속되고 있습니다. 연료 비용의 변동성은 여전히 수익성을 좌우하는 주요 요인이지만, 듀얼 연료 신조선의 수주와 단계적인 효율화 업그레이드에 의해 단위당 배출량과 연료 소비량은 점차 경향이 있습니다. 이러한 배경에 따라 기술 도입과 환경 규제 대응이 사업 모델을 재구축하는 동안 컨테이너 운송 시장은 운임 주도의 수익 구조에서 효율성 주도의 수익 구조로 전환하고 있습니다.
세계의 상품 무역은 소비자 지출의 안정화와 재고 보충 사이클을 배경으로 회복 기조에 있으며, 해운 회사는 유휴 배 배를 북미 및 지중해 게이트웨이에 재배치하고 있습니다. 홍해 우회에 의한 항로연장이 일시적으로 과잉선복을 흡수하고 신조선 투입이 진행되는 가운데도 운임수준을 유지하고 있습니다. 기항 데이터에 의하면 미국 동해안의 허브항에서는 2자리의 취급량 회복이 확인되어 컨테이너 운송 시장이 신속하게 화물유향을 재조정할 수 있는 유연성을 보여줍니다. 설비 재배치 비용은 증가하고 있는 것, 백홀 이용률의 향상에 의해 부담의 일부는 상쇄되고 있습니다. 무역 성장의 지속성은 여전히 가계 구매력과 지정학적 긴장의 정상화 속도에 의존합니다.
2024년 12월에 체결된 EU-Mercosul 협정은 560억 유로(618억 달러)의 추가 물품 무역을 창출하고 남대서양의 서비스 구조를 재구축할 전망입니다. 산타스항과 부에노스아이레스항의 터미널을 이미 지배하고 있는 해운회사는 기존 카리브해에서 적재된 발착지간화물을 포착하기 위해 전용 루트의 정비를 진행하고 있습니다. 동시에 USMCA(미국·멕시코·캐나다 협정)의 규정은 북미역 내 근거리 수송(니어 쇼어링)을 강화하고 있어 미국용 화물을 취급하는 멕시코 거점의 점유율 상승에 그 동향이 나타났습니다. 보다 광범위한 지역화의 흐름을 받아, 선대 계획 담당자는 장거리 동서 간선 루트에의 의존으로부터 탈각해, 단거리·고빈도의 항로망 설계에 방향타를 끊고 있습니다. 장기적으로 컨테이너 운송 시장은 관세장벽의 감소와 함께 체류시간을 단축하고 서비스 예측성을 높이는 조화로운 통관절차의 혜택을 받게 됩니다.
초저황 연료유(VLSF)의 2024년 평균 가격은 톤당 630달러였으며, EU 배출량 거래제도에 해운부문을 통합함으로써 유럽역내 항로에서는 톤당 170-210달러의 추가 비용이 발생했습니다. 가격 변동으로 인해 운항사는 연료 조정 계수를 통해 운임을 조정할 수 없지만, 이 조정은 시장 변동에 뒤떨어지기 쉽고, 이익률을 저하시킵니다. LNG, 메탄올, 기존 연료유의 가격 차이가 확대됨에 따라 다연료 조달 전략이 복잡해지고 있습니다. 헤지는 부분적인 완화책이 되지만, 모든 운항회사가 가지고 있는 것은 아닌 고급 금융지식이 필요합니다. 그 결과, 에너지 효율화 보수 및 감속 항행은 컨테이너 운송 시장에서 비용 충격을 흡수하기 위한 즉각적인 수단이 되고 있습니다.
40피트 컨테이너 부문은 2025년 수익의 50.62%를 차지하고, 선박의 적재 효율을 극대화하며, 철도·트럭의 규격에 적합하는 업계의 주력 유닛으로서의 지위를 반영했습니다. 40피트 컨테이너 시장 규모는 고적재형을 선호하는 설비 갱신 사이클과 내륙 인프라의 개선에 따라 확대될 것으로 전망됩니다. 전자기기·의류하주로부터의 견조한 수요가 선대 가동률을 지지해, 고적재형 설계의 지속적 생산이 단위당 적재율을 향상시킵니다. 항만 측의 더블 리프트 크레인 스프레더에 대한 투자는이 크기에 대한 운영 선호도를 더욱 견고하게 만듭니다. 20피트 컨테이너는 개발도상국의 고밀도 화물 및 인프라 제약이 있는 터미널에 여전히 중요하지만, 운송업체가 톤당 탄소 실적 감소를 위해 적재를 통합하는 움직임으로 인해 상대적인 점유율이 점차 감소할 것으로 예측됩니다. 45피트 컨테이너 등의 특수 사이즈는 팔레트 폭의 화물 요구에 대응합니다만, 귀국 수요의 부족이나 특정 철도 회랑에서의 호환성 갭에 의해 보급이 제한되고 있습니다.
40피트 컨테이너의 성장은 디지털화된 컨테이너 추적 시스템에도 지원됩니다. 이를 통해 도어 투 도어의 가시성이 향상되고 대량 소매 업체의 재고 계획 효율화가 가능합니다. 임대회사는 스마트박스 기술 도입을 위해 함대 갱신을 가속화하여 자산 회전율 향상과 유휴 시간 절감으로 이어지고 있습니다. 이러한 요인들이 결합되어 2031년까지 40피트 부문이 컨테이너 운송 시장의 핵심이 될 것입니다.
범용 컨테이너는 2025년의 취급량의 63.40%를 차지해 소비자용·산업용 무역 플로우의 대부분을 지지했습니다. 그러나 온도 관리가 필요한 의약품과 신선 식품에 대한 지속적인 수요를 배경으로 리퍼 유닛은 CAGR 3.36%로 성장을 지속하고, 표준 컨테이너를 능가하는 성장이 예상됩니다. 단열 성능 향상, 텔레메트리 기능의 통합, 저소비 전력화로 자본 비용이 상승하는 것 냉장 운송 서비스의 수익성이 향상되고 있습니다. 제약 회사는 제품의 품질을 손상시키지 않고 비용 절감을 실현하는 검증된 콜드체인 운송 루트에 매료되어, 고가치의 생물학적 제제를 항공 운송에서 해상 운송으로 이행시키고 있습니다. 식품 공급망에서 폐기물 감축을 추진함으로써 고정밀 냉장 컨테이너에서 지속적으로 모니터링되고 운송되는 신선한 식품의 비율이 증가하고 있습니다. 그 결과 해운회사는 신조선 설계에 더 많은 냉장 컨테이너용 플러그를 할당하여 지속적인 프리미엄 수요에 대한 자신감을 보여주고 있습니다. 범용 부문은 성숙한 것, 컨테이너 운송 시장의 중심이 지속적으로 혁신적인 설계 변경보다 도난 방지 잠금 및 엔드 투 엔드 추적에 중점을 둔 점진적인 혁신이 진행되고 있습니다.
병행하는 동향으로서 CO2 기반의 냉동 시스템의 레트로 피트가 진행되어, 구식의 HFC 유닛에 비해 에너지 효율의 향상과 지구 온난화 계수의 저감을 도모하고 있습니다. 이러한 기술 업그레이드와 식품·의약품 분야의 규제 촉진요인이 함께 리퍼 컨테이너는 수익 성장의 최전선에 계속 유지할 전망입니다.
컨테이너 운송 시장 보고서는 컨테이너 크기(20피트 TEU, 40피트 FEU 등), 컨테이너 유형(일반화물, 리퍼), 서비스(전체 컨테이너 적재 FCL, 소구화물 LCL), 최종 사용자 산업(소비재, 소매, 제조, 자동차 등), 지역(북미, 남미, 아시아태평양, 유럽, 중동, 아프리카)별로 분류됩니다. 시장 예측은 금액 기준(달러)으로 제공됩니다.
아시아태평양은 2025년 수익의 40.55%를 차지하고 컨테이너 운송 시장의 제조·수출 거점으로서의 지위를 강화했습니다. 중국의 GDP 성장률이 5% 가까이를 유지하고 상하이, 닝보, 배산, 부산에서 항만 자동화가 가속되고 있는 것이 이 지역의 슬롯 수요를 지지하고 있습니다. ASEAN 공급망 통합과 전자부품의 흐름에 힘입어 아시아 역내 무역항로에서는 최고 수준의 빈도 증가가 기록되고 있습니다. 아시아와 유럽 간화물의 여름철 대체항로로서 북극해 항로가 대두하여 추가적인 회복력층을 제공하고 있지만, 채용은 여전히 내빙선의 부족과 지정학적 리스크에 의해 제약되고 있습니다. 내륙철도망과 자유무역지역에 대한 지속적인 투자는 견조한 전망을 지지하고 있으며, 이 지역은 2031년까지 연평균 복합 성장률(CAGR) 4.12%를 나타낼 것으로 예측되고 있습니다.
북미에서는 2024년 소매업의 재고 보충과 EC 풀필먼트 수요를 견인역으로 적재 컨테이너 수입량이 13.1%의 회복을 보였습니다. 사바나, 뉴욕, 뉴저지 등 동해안 게이트웨이는 서해안 노동 문제에 따른 화주의 분산화와 대형 네오파나맥스 선박에 대응하는 항로의 심굴 혜택을 받았습니다. 멕시코 서해안의 라사로 카르데나스 항구는 미국 중서부로 철도 연결성을 제공하며 아시아에서 직항 노선을 유치하고 있습니다. Long Beach Terminal의 리노베이션은 제로 에미션의 야드 설비를 중시하고 있으며, 주 규제에 적합함과 동시에, 이 지역 컨테이너 운송 시장의 환경 배려도를 높이고 있습니다. 잠재적인 노동 협상이 단기 변동 요인이되는 반면, 육상 재고 버퍼와 니어 쇼어링에 대한 구조적 동향은 중기 성장을 지원합니다.
유럽의 상황은 복잡합니다. 로테르담과 앤트워프 브뤼헤와 같은 북부 허브 항구는 2023년 침체 후 소폭 증가에 그쳤습니다. 한편 지중해 중계 허브 항구는 수에즈 운하 회피로 약 30%의 취급량 급증을 누렸습니다. 이 때문에 FuelEU Maritime과 ETS 프레임워크에 의한 규제비용 상승에도 불구하고 남유럽의 컨테이너 운송 시장 규모가 확대되었습니다. 항만 커뮤니티 시스템과 복합 운송 철도 회랑에 대한 투자로 내륙 지역과의 연결성은 개선되었지만, 위기시 우회 항로에서 지중해 허브가 넘치는 경우 혼잡 위험은 여전히 남아 있습니다. 브렉지트 관련 통관 마찰은 안정화되었지만 영국의 게이트웨이에서는 2021년 이전에 비해 동아시아 직항편의 취급량이 계속 낮은 수준입니다.
The Container Shipping Market is expected to grow from USD 119.65 billion in 2025 to USD 123.14 billion in 2026 and is forecast to reach USD 142.07 billion by 2031 at 2.92% CAGR over 2026-2031.
Slower fleet-wide speed, ongoing Red Sea diversions, and an expanded regulatory cost base are moderating supply even as trade agreements and e-commerce replenish underlying demand. Carriers are concentrating on network reliability, with new alliance formations targeting on-time performance above 90% while reallocating capacity toward the most resilient corridors. Terminal ownership continues to rise as a defensive hedge against landside congestion and as a lever to capture new revenue pools. Fuel cost volatility remains the primary profitability swing factor, yet dual-fuel newbuild orders and incremental efficiency upgrades are gradually lowering per-unit emissions and bunker consumption. Against this backdrop, the container shipping market is transitioning from rate-driven earnings to efficiency-driven returns as technology adoption and environmental compliance reshape operating models.
World merchandise trade is recovering on the back of stabilizing consumer spending and restocking cycles, prompting carriers to redeploy idle capacity onto North American and Mediterranean gateways. Longer voyage distances caused by Red Sea detours have temporarily absorbed excess tonnage, protecting rate integrity even as new vessels deliver. Port call data show double-digit throughput rebounds at U.S. East Coast hubs, highlighting the flexibility of the container shipping market to redirect flows quickly. Equipment repositioning costs have increased, yet higher backhaul utilization is offsetting part of the burden. The durability of trade growth remains linked to household purchasing power and to how swiftly geopolitical flashpoints normalize.
The EU-Mercosur deal, concluded in December 2024, is set to unlock EUR 56 billion (USD 61.80 billion) in additional goods trade and reshape South Atlantic services. Carriers that already control terminals in Santos and Buenos Aires are preparing dedicated loops to capture origin-destination volumes that were traditionally transshipped in the Caribbean. Simultaneously, USMCA provisions are reinforcing North American near-shoring, a trend visible in the rising share of Mexican gateways handling U.S.-bound cargo. Broader regionalization is nudging fleet planners to design shorter, high-frequency strings instead of relying solely on long-haul east-west trunk routes. Over the long term, the container shipping market benefits from lower tariff barriers as well as harmonized customs processes that reduce dwell times and enhance service predictability.
Very-Low-Sulfur Fuel Oil averaged USD 630 / t in 2024, and the inclusion of shipping in the EU Emissions Trading System has added USD 170-210 / t for intra-European voyages. Price gyrations compel carriers to adjust freight rates through bunker adjustment factors that often lag market swings, eroding margins. Wide spreads between LNG, methanol, and conventional bunkers complicate multi-fuel procurement strategies. Hedging offers partial relief but demands financial sophistication that not all operators possess. Consequently, energy efficiency retrofits and slow steaming remain immediate tools to absorb cost shocks within the container shipping market.
Other drivers and restraints analyzed in the detailed report include:
For complete list of drivers and restraints, kindly check the Table Of Contents.
The 40-foot segment held 50.62% of 2025 revenue, reflecting its status as the industry's workhorse unit that maximizes vessel stowage and aligns with rail and truck dimensions. The container shipping market size for 40-foot boxes is projected to grow alongside equipment replacement cycles and inland infrastructure upgrades that favor high-cube variants. Robust demand from electronics and apparel shippers reinforces fleet utilization, while sustained production of high-cube designs lifts per-unit load factors. Port-side investments in double-lift crane spreaders further cement the operational preference for this size. The 20-foot segment remains vital for dense commodities and infrastructure-limited terminals in developing economies, though its relative share is expected to edge lower as shippers consolidate loads to reduce per-tonne carbon footprints. Specialized sizes such as 45-foot units cater to pallet-wide cargo niches, yet their uptake is restricted by limited backhaul demand and compatibility gaps in certain rail corridors.
Growth in the 40-foot category is also supported by digitized container tracking, which improves door-to-door visibility and enables leaner inventory planning for high-volume retailers. Leasing companies are accelerating fleet renewal to incorporate smart-box technology, a move that enhances asset rotation and reduces idle time. Combined, these factors should keep the 40-foot segment at the core of the container shipping market through 2031.
General-purpose containers accounted for 63.40% of 2025 throughput, underpinning the bulk of consumer and industrial trade flows. However, reefer units are forecast to log a 3.36% CAGR, outpacing standard boxes on the back of sustained demand for temperature-controlled pharmaceuticals and perishables. Enhanced insulation, integrated telemetry, and lower power draw raise the profitability of refrigerated services despite higher capital costs. Pharmaceutical firms are shifting high-value biologics from air to ocean freight, lured by validated cold-chain corridors that deliver cost savings without compromising product integrity. In food supply chains, the push to cut waste is increasing the share of fresh produce shipped in high-accuracy reefers with continuous monitoring. Consequently, carriers are dedicating larger reefer plugs on newbuild designs, signaling confidence in sustained premium demand. The general-purpose segment, while mature, remains central to the container shipping market, with incremental innovation focused on theft-resistant locks and end-to-end tracking rather than on transformative design changes.
A parallel trend involves the retro-fitting of CO2-based refrigeration systems, improving energy efficiency and reducing global warming potential relative to older HFC units. These technology upgrades, combined with regulatory drivers in food and pharma, are likely to keep reefers at the forefront of revenue growth.
The Container Shipping Market Report is Segmented by Container Size (20-Foot TEU, 40-Foot FEU, Others), Container Type (General, Reefer), Service (Full-Container-Load FCL, Less-Than-Container-Load LCL), End-User Industry (FMCG & Retail, Manufacturing and Automotive, and More), and Geography (North America, South America, Asia-Pacific, Europe, Middle East and Africa). The Market Forecasts are Provided in Terms of Value USD.
Asia-Pacific commanded 40.55% of 2025 revenue, reinforcing its status as the manufacturing and export engine of the container shipping market. Chinese GDP expansion near 5% and accelerated port automation in Shanghai, Ningbo-Zhoushan, and Busan are sustaining the region's slot demand. Intra-Asian trade lanes are registering some of the highest frequency growth, propelled by ASEAN supply-chain integration and electronics component flows. The emergence of the Northern Sea Route as a summer alternative for Asia-Europe cargo offers an additional resilience layer, though uptake remains constrained by ice-class fleet scarcity and geopolitical risk. Continued investment in hinterland rail networks and free-trade zones supports a robust outlook, with the region projected to deliver a 4.12% CAGR through 2031.
North America experienced a 13.1% rebound in loaded container imports during 2024, led by retail restocking and e-commerce fulfillment demand. East Coast gateways such as Savannah and New York-New Jersey benefited from shipper diversification away from West Coast labor uncertainties and from deeper channel dredging that accommodates larger neo-Panamax vessels. Mexico's west-coast port of Lazaro Cardenas is attracting direct Asia services, offering rail connectivity into the U.S. Midwest. Long-beach terminal retrofits emphasizing zero-emission yard equipment align with state regulations and bolster the environmental credentials of the container shipping market in the region. While potential labor negotiations pose near-term volatility, the structural trend toward onshore inventory buffers and near-shoring supports medium-term growth.
Europe's picture is mixed. Northern hubs such as Rotterdam and Antwerp-Bruges posted modest gains after a soft 2023, whereas Mediterranean transshipment hubs enjoyed volume windfalls of about 30% as carriers bypassed the Suez Canal. The container shipping market size in Southern Europe therefore expanded even as regulatory costs rose under the FuelEU Maritime and ETS frameworks. Investments in port community systems and intermodal rail corridors are improving hinterland connectivity, yet congestion risk lingers when Mediterranean hubs become overflow valves during crisis reroutes. Brexit-related customs friction has stabilized, although UK gateways continue to handle lower direct Far East services than before 2021.