


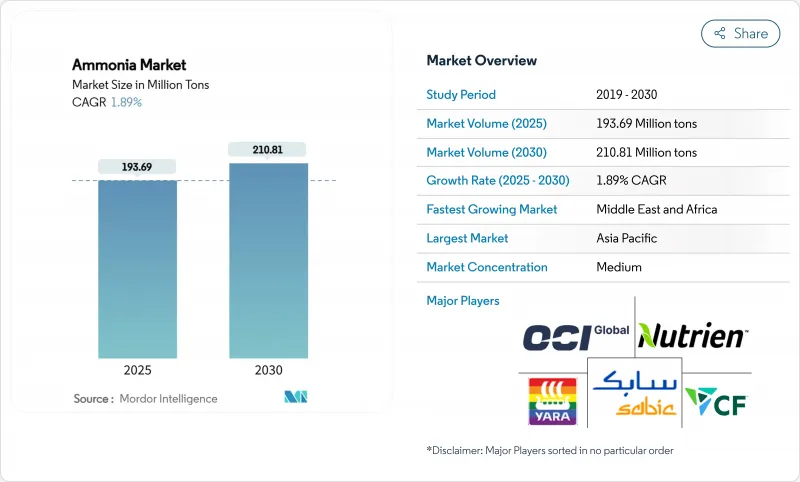
암모니아 시장 규모는 2025년에 1억 9,369만 톤으로 추계되며, 2030년에는 2억 1,081만 톤에 이를 것으로 예상되며, 예측 기간(2025-2030년)의 CAGR은 1.89%를 나타낼 전망입니다.

이 견조한 톱라인은 탈탄소화 목표의 강화, 천연가스 가격의 불안정성 지속, 저탄소 해상연료의 보급에 따른 생산기술, 원료전략, 다운스트림 용도의 근본적인 전환을 뒷받침합니다. 녹색 및 청색 설비에 대한 전략적 투자, 중국의 석탄에서 가스로의 업그레이드, 수소 운반자로서의 암모니아의 상승으로 공급망의 위치가 바뀌고 있는 반면, 안전 요건 증가와 우레아 공급 과잉으로 인해 단기적인 가격은 불안정하게 남아 있습니다. 저탄소 원료를 확보하고, 재생가능 전력을 확보하고, 기술 제휴를 맺을 수 있는 생산자는 비용 경쟁력을 향상시키고 있지만, 유럽의 가스 노출 자산은 여전히 마진 압력 하에 있습니다. 이러한 구조적 힘으로 인해 암모니아 시장이 재구성됨에 따라 지역 성장률, 제품 구성 및 무역 흐름은 주요 톤수가 제안한 것 이상으로 괴리하고 있습니다.
지속가능성을 위한 아시아 농업의 축족발은 저탄소 비료의 도입을 가속화하고 있습니다. 중국은 재생가능한 전력 및 탄소 포획 시스템으로 석탄 기반의 자산을 업그레이드하고 있으며 재생 가능한 혼합 비료에 대한 수요를 높이고 있습니다. 인도네시아의 GAIA 프로젝트는 천연가스와 전해수소를 공동공급하는 최초의 하이브리드 플랜트를 도입하여 마이그레이션 시설을 위한 확장 가능한 템플릿을 제공합니다. 지속 가능한 투입 자재에 대한 우대 대출 제도와 기존 우레아 플랜트의 배출 규제 강화 등의 정책 인센티브가 농가를 프리미엄 제품으로 유도하고 있습니다. 그 파급효과는 모듈식 전해조의 설비수주와 비료판매업자와 재생가능전력개발업자 간의 장기 인수계약에 이미 나타났습니다.
해운 부문의 탈탄소화 서약은 암모니아를 실용적인 수소 벡터로 자리잡고 있습니다. 일본과 한국은 2024년 세계 최초의 트럭에서 선박으로의 연료 보급을 완료하여 엔드 투 엔드에서의 취급 안전성을 입증하여 항만 당국의 신뢰를 강화했습니다. 2050년까지 선박의 배출량을 반감시키는 국제해사기관의 목표가 그린 암모니아 공급계약을 체결할 의욕을 선사에 주었습니다. 선급협회에 의한 암모니아 대응 엔진의 승인과 내항선 설계의 전개는 기술적 리스크를 저감하고 탄소 가격 예측은 프로젝트의 경제성을 향상시키고 있습니다.
유럽 생산자들은 천연가스의 스팟 가격이 2022년 이전 수준을 넘어서고 있기 때문에 만성적인 비용 인플레이션에 직면하고 있습니다. CF 인더스트리즈와 BASF사가 운영하는 여러 플랜트가 생산을 축소하여 최대 700만 톤의 유효 생산 능력을 삭감했습니다. 러시아산 우레아의 수입은 그 격차를 메우고 있으며 지역 정책 목표를 복잡하게 만듭니다. 에너지 공급 계약이 경쟁력 있는 가격을 확보하거나 블루 암모니아 개조가 신속하게 진행되지 않는 한, 유럽 공급은 세계적인 수요를 늦출 것으로 예측됩니다.
2024년 암모니아 시장 톤수의 95%는 액체 제품이었습니다. 이 형태는 압축 수소보다 체적 에너지 밀도가 높다는 장점이있어 해상 벙커 공급업체와 장거리 파이프라인 블렌드의 비용 효율적인 저장을 용이하게합니다. 이 부문은 새로운 항만 벙커링 허브, 현장 냉동 시스템, 해안 전용 운송선의 가동에 따라 암모니아 시장 전체를 약간 웃도는 연률 1.94%를 나타낼 것으로 예측됩니다. 일본의 대형 해안 운송선의 프로토타입을 포함한 기술의 발전은 톤당 배송 비용을 줄이는 더 큰 소포 크기를 지원합니다. 극저온 단열재 및 감지 시스템에 대한 투자는 보일오프 손실을 줄이고 유동성의 이점을 더욱 강화합니다.
특정 폴리머 및 카프로락탐 합성과 같은 즉각적인 가스화를 필요로 하는 공정에서 기체 부문이 필수적인 것은 아니지만, 그 점유율은 높은 취급 비용에 의해 제한됩니다. 안전 규제에 따라 수송 압력이 제한되고 두께가 있는 실린더가 요구되므로 냉장 액체 수송에 비해 물류비가 늘어납니다. 틈새 석유화학 공정에서의 성장이 기대되는 것, 2030년까지 액체 제품이 암모니아 시장을 계속 독점할 것으로 보입니다.
2024년 암모니아 시장은 아시아태평양이 51.40%의 점유율을 차지했습니다. 중국의 석탄가스화 개수와 인도 일일 750톤의 Hygenco 프로젝트가 저탄소 능력을 확대하고 일본과 한국의 항만이 벙커링 시험 운용을 시작했습니다. 신재생에너지에 의한 전력융통과 세제우대조치를 제공하는 지역정책 패키지는 공급비용을 더욱 낮춥니다. 인도네시아 아체의 하이브리드 플랜트는 자원이 풍부하고 전력에 제약이 있는 곳에 적합한 전환 경로를 보여줍니다.
중동 및 아프리카은 2025-2030년 CAGR이 2.67%로 예측되어 가장 급성장하고 있는 지역입니다. 이집트의 330억 달러의 거래 파이프라인, 모로코의 10억 달러의 다크라 프로젝트, 카타르의 12억 달러의 브라운필드 확장은 녹색 또는 블루 암모니아 수출을 통해 태양광과 풍력 자원을 수익화하려는 각국의 야망을 보여줍니다. 멕시코 걸프의 엔지니어링 회사와 조선소의 제휴는 기술적 전문 지식을 제공하고 건설 일정을 앞당깁니다.
북미는 풍부한 셰일 가스와 탄소 포착 허브를 활용하여 한계 생산 비용을 낮게 억제합니다. CF 인더스트리즈의 1,040만 톤 생산 능력과 37개의 미국 프로젝트 제안은 허가되면 이 지역의 생산량을 연간 2,100만 톤에서 7,900만 톤으로 끌어올릴 수 있습니다. 연방 정부의 청정 수소 세액 공제는 청색 시설의 경제성을 향상시키고 멕시코 걸프의 항만은 유럽과 아시아 시장에 심해 접근을 제공합니다.
유럽은 가스 가격 상승과 불투명한 탄소 관세로 고통받고 있습니다. 스팟 가격이 불안정하기 때문에 생산 축소가 계속되고 있지만, 기술 공급자는 최대 99%의 CO2 포집율을 가진 블루 암모니아의 리노베이션을 가속화하고 있습니다. 수입 의존도는 상승하고 있으며, 러시아의 우레아 유입 증가가 현저한 예입니다. 유럽연합(EU)은 국내 에너지 안보를 추진하려고 하지만 자본 배분은 신규 자국 생산 능력보다 강하에서의 청정 연료 인수 계약을 우선하고 있습니다.
라틴아메리카와 오세아니아는 광업과 벙커 연료에 대한 수요로 더욱 성장하고 있습니다. 브라질의 아쿠 항구는 100만 톤의 녹색 암모니아 시설용지를 확보하고 호주 철광석 확대는 화약 소비를 촉진합니다.
The Ammonia Market size is estimated at 193.69 Million tons in 2025, and is expected to reach 210.81 Million tons by 2030, at a CAGR of 1.89% during the forecast period (2025-2030).
This steady topline belies a fundamental transition in production technologies, feedstock strategies, and downstream uses as decarbonization targets tighten, natural-gas price volatility persists, and low-carbon maritime fuels gain traction. Strategic investments in green and blue facilities, coal-to-gas upgrades in China, and the emergence of ammonia as a hydrogen carrier are repositioning supply chains, while rising safety requirements and urea oversupply keep short-term prices volatile. Producers able to lock in low-carbon feedstocks, secure renewable power, and form technology alliances are improving cost competitiveness, whereas Europe's gas-exposed assets remain under margin pressure. As these structural forces reshape the ammonia market, regional growth rates, product mixes, and trade flows are diverging more sharply than headline tonnage suggests.
Asia's agricultural pivot toward sustainability is accelerating low-carbon fertilizer uptake. China is upgrading coal-based assets with renewable electricity and carbon-capture systems, lifting demand for renewable ammonia blends. Indonesia's GAIA project introduces the first hybrid plant that co-feeds natural gas and electrolytic hydrogen, providing a scalable template for transition facilities. Policy incentives, such as preferential loan programs for sustainable inputs and tighter emission limits on conventional urea plants, are nudging farmers to premium products. The ripple effect is already evident in equipment orders for modular electrolysers and in long-term offtake contracts between fertilizer distributors and renewable electricity developers.
The maritime sector's decarbonization pledge is positioning ammonia as a practical hydrogen vector. Japan and South Korea completed the world's first truck-to-ship bunkering operation in 2024, demonstrating end-to-end handling safety and reinforcing confidence among port authorities. The International Maritime Organization's target to halve shipping emissions by 2050 has motivated carriers to lock in green ammonia supply agreements. Class-society approvals for ammonia-ready engines and the rollout of coastal carrier designs are lowering technical risk, while carbon-price forecasts improve project economics.
European producers face chronic cost inflation as natural-gas spot prices remain above pre-2022 levels. Several plants operated by CF Industries and BASF have curtailed output, removing up to 7 million tons of effective capacity. Imports of Russian urea are back-filling the gap, complicating regional policy goals. Unless energy-sourcing contracts lock in competitive prices or blue-ammonia retrofits proceed swiftly, European supply is expected to lag global demand.
Other drivers and restraints analyzed in the detailed report include:
For complete list of drivers and restraints, kindly check the Table Of Contents.
Liquid product accounted for 95% of the ammonia market tonnage in 2024. This form benefits from higher volumetric energy density than compressed hydrogen, facilitating cost-effective storage for maritime bunker suppliers and long-distance pipeline blends. The segment is forecast to grow at 1.94% annually, slightly faster than the overall ammonia market, as new port bunkering hubs, on-site refrigeration systems, and specialized coastal carriers come online. Technological advances, including Japan's large-coastal-carrier prototypes, support larger parcel sizes that reduce delivered cost per ton. Investments in cryogenic insulation and detection systems mitigate boil-off losses, further reinforcing liquidity advantages.
The gaseous segment remains essential for processes requiring immediate gasification, such as certain polymer or caprolactam syntheses, yet its share is constrained by higher handling costs. Safety regulations limit transport pressures and demand thicker-walled cylinders, which inflates logistics expenses relative to refrigerated-liquid shipping. Although incremental growth is expected in niche petrochemical processes, liquid product will continue to dominate the ammonia market through 2030.
The Ammonia Market Report Segments the Industry by Type (Liquid and Gas), Application (Nitrogen Fertiliser Intermediate, Refrigerants (Industrial and Cold-Chain), Explosives and Mining Nitrates, and More), End-User Industry (Agriculture, Textiles, Mining, and More), and Geography (Asia-Pacific, North America, Europe, South America, and Middle East and Africa). The Market Forecasts are Provided in Terms of Volume (tons).
Asia-Pacific dominated the ammonia market with 51.40% share in 2024. China's coal-to-gas revamps and India's 750-ton-per-day Hygenco project expand low-carbon capacity, while Japanese and South Korean ports pioneer bunkering pilots. Regional policy packages offering renewable-power wheeling and tax rebates further lower delivered costs. Indonesia's hybrid plant in Aceh showcases transition pathways suited to resource-rich, power-constrained locations.
The Middle East and Africa region is the fastest-growing geography with a 2.67% CAGR projected for 2025-2030. Egypt's USD 33 billion deal pipeline, Morocco's billion-dollar Dakhla project, and Qatar's USD 1.2 billion brownfield expansion illustrate sovereign ambitions to monetize solar and wind resources through green or blue ammonia exports. Gulf Coast engineering firms and shipyard alliances provide technical expertise, accelerating construction timelines.
North America leverages abundant shale gas and carbon-capture hubs to keep marginal production costs low. CF Industries' 10.4 million-ton capacity and 37 US project proposals could raise regional output from 21 million to 79 million tons annually if sanctioned. Federal clean-hydrogen tax credits improve economics for blue facilities, and Gulf Coast ports offer deep-water access to European and Asian markets.
Europe wrestles with high gas prices and uncertain carbon-border tariffs. Production curtailments continue as spot prices remain volatile, though technology providers are accelerating blue-ammonia retrofits with up to 99% CO2 capture rates. Import dependence is rising, highlighted by increasing Russian urea inflows. Although the European Union seeks to promote domestic energy security, capital allocation favors downstream clean-fuel offtake agreements more than new indigenous capacity.
Latin America and Oceania add incremental growth through mining and bunker-fuel demand. Brazil's Port of Acu reserves land for a 1 million-ton green-ammonia facility, while Australia's iron-ore expansion drives explosives consumption.