에너지 분야 빅데이터 분석 : 시장 점유율 분석, 산업 동향, 통계, 성장 예측(2025-2030년)
Big Data Analytics In Energy Sector - Market Share Analysis, Industry Trends & Statistics, Growth Forecasts (2025 - 2030)
상품코드:1686278
리서치사:Mordor Intelligence
발행일:2025년 03월
페이지 정보:영문
라이선스 & 가격 (부가세 별도)
ㅁ Add-on 가능: 고객의 요청에 따라 일정한 범위 내에서 Customization이 가능합니다. 자세한 사항은 문의해 주시기 바랍니다.
ㅁ 보고서에 따라 최신 정보로 업데이트하여 보내드립니다. 배송기일은 문의해 주시기 바랍니다.
한글목차
에너지 분야 빅데이터 분석 시장은 2025년 106억 2,000만 달러, 2030년에는 179억 5,000만 달러에 이를 것으로 예측되며, 예측 기간(2025-2030년)의 CAGR은 11.07%를 나타낼 것으로 예상됩니다.
빅 데이터 솔루션은 석유 및 가스 회사가 저류층의 생산 효율을 향상시키는 데 필요한 데이터를 수집하고 처리하는 데 도움을 줍니다. 데이터(온도, 음향, 압력 등)를 얻기 위해 다양한 갱내 센서가 사용됩니다. 예를 들어, 기업은 저장층의 압력, 온도, 유량, 음향 변화에 대한 신속하고 실용적인 정보를 제공하는 저장층 관리 시스템을 구축하기 위해 빅 데이터 분석을 사용할 수 있습니다. 이를 통해 기업은 수익성을 향상시키면서 운영 관리를 강화할 수 있습니다.
주요 하이라이트
현재 모든 프로세스가 에너지 부문에 의해 추진되고 지원됩니다. 모든 기업은 그 어느 때보다 많은 에너지를 필요로 하고, 적정한 가격으로 요구하고 있으며, 빅데이터와 애널리틱스의 진보가 이를 현실로 삼고 있습니다. 빅데이터를 사용하면 기업이 대량의 정보(테라바이트 또는 페타바이트)를 수집, 저장 및 분석할 수 있습니다. 수년 동안 전력 및 에너지 산업은 빅 데이터를 처리하고 대량의 데이터를 일상적으로 처리해 왔습니다.
월별 데이터를 제공하는 기존의 전력계와 달리 스마트 계량기는 보다 자세한 수준의 측정값을 분 단위로 제공할 수 있으므로 상당한 데이터가 생성되고 수집되는 데이터의 양이 증가합니다. 센서, 무선 트랜스미션, 네트워크 통신, 클라우드 컴퓨팅 기술의 응용이 진행되고 있기 때문에 데이터는 수요측과 공급측 모두에서 수집되고 있습니다.
유가 변동성은 에너지 관련 프로젝트에 대한 고액 지출로 이어져 빅데이터 분석의 큰 수요를 창출하고 있습니다. 양질의 정보에 대한 요구가 증가하고 있으며, 이는 시장 성장을 뒷받침할 것으로 예상됩니다.
현재 시나리오에서는 분석을 위해 비정형 데이터를 효과적으로 다루는 숙련된 전문가와 노동력 부족으로 인해 악화된 디지털 기술과 디지털 마인드 부족이 시장 성장을 방해하는 요인 중 하나가 되었습니다.
에너지 소비는 GDP 성장률, 산업 생산, 소비자 지출과 같은 거시 경제 변수에 직접 영향을 받습니다. 에너지 소비는 일반적으로 제조, 운송, 주택 등 여러 분야에서 경제 성장과 함께 증가합니다. 생산 유통 및 소비와 관련된 프로세스를 최적화하기 위해 에너지 부문은 점점 더 고급 분석 솔루션을 필요로 합니다. 예를 들어 세계은행의 추정에 따르면 2023년 32조 3,200억 달러였던 북미 GDP는 2023년부터 24년에 걸쳐 1.5% 증가한 것으로 예상되며, 기업 활동과 에너지 부문에서 빅데이터 분석에 대한 투자가 활발해질 것으로 예측되고 있습니다.
에너지 부문의 빅데이터 분석 시장 동향
그리드 운영 용도 부문이 큰 시장 점유율을 차지할 전망
세계 에너지 수요가 증가하고 있습니다. 국제에너지기구(IEA)에 따르면 2005년부터 2030년 사이에 에너지 수요는 55% 확대되고 석유 환산으로 114억톤에서 177억톤으로 증가, 2050년에는 세계 에너지 소비량은 886.3조 영국 열 단위가 될 것으로 예측되고 있습니다. 송전망에 전력을 공급하는 태양광 발전과 같은 재생 가능 에너지에서 전력 회사는 수요 반응 분석을 사용하여 피크 시에 이러한 전원을 해제할 시기를 결정할 수 있습니다.
데이터 분석은 현대 산업 시스템에서 중요한 역할을 담당합니다. 전력망에서는 기존의 화석연료가 고갈의 문제에 직면하고 있으며, 탈탄화수소화에 의해 이산화탄소 배출량을 삭감하는 것이 전력 시스템에 요구되고 있습니다. 스마트그리드와 슈퍼그리드는 신재생에너지원의 높은 보급률을 통해 가전 속도를 가속화하는 효과적인 솔루션입니다.
배전 시스템에서 사용되는 기존의 전력계는 청구를 위해 수동으로 수집하고 분석할 수 있는 소량의 데이터만 생성합니다. 양방향 통신 스마트 그리드에서 다양한 시간 분해능으로 수집되는 엄청난 양의 데이터는 과금 정보 및 전력 네트워크 상태에 대한 중요한 정보를 추출하기 위한 고급 데이터 분석이 필요합니다. 예를 들어, 고해상도 사용자 소비 데이터는 수요 예측, 고객 행동 분석 및 에너지 발전 최적화에도 사용할 수 있습니다.
스마트 그리드의 빅 데이터 분석은 전력 산업을 변화시킬 수 있습니다. 그러나 그 가치를 극대화하기 위해서는 적절하게 활용해야합니다. 스마트 그리드 애널리틱스는 백오피스 애널리틱스(그리드 연결 감독, 부하 예측, 신뢰성 보고 등의 특정 기능)와 분산형 애널리틱스(미터, 센서 및 기타 기기의 데이터 분석)로 나뉩니다.
고급 계측 인프라를 통한 데이터 분석을 기반으로 하는 예지보전 및 고장 검출은 전력 계통의 안전보장에 보다 중요합니다. 이들은 솔루션이 조직에 통합되어 이른 어댑터가 현재 활용할 것으로 예상되는 솔루션입니다. GE의 뉴 애널리틱스 테크놀로지스는 송전망의 효율을 높이고 있습니다. 이 회사는 또한 송전망 및 배전망의 데이터를 활용하여 더 많은 분산 자산이 송전망에 도입됨에 따라 유틸리티 기업이 더 나은 운영 효율성을 달성할 수 있도록 하는 예측 분석의 새로운 포트폴리오를 구축했습니다.
북미가 큰 시장 점유율을 차지할 전망
북미는 빅데이터 분석을 도입하는 주요 혁신가이자 선구자 중 하나입니다. 이 지역은 빅데이터 분석 공급업체의 강력한 발판으로 에너지 부문에서 빅데이터 분석의 대규모 수요를 보여주며 시장 성장을 위한 유리한 기회를 제공합니다.
미국은 캐나다에 비해 북미 수요 증가에 중요한 역할을 합니다. 특히 석유 및 가스, 정제, 발전 분야에서 수요가 증가하고 있습니다. 미국인의 대다수는 태양광 발전과 풍력 발전을 환경에 좋은 에너지원으로 생각하고 있습니다. 약 65%의 사람들이 풍력 발전의 환경 효과가 대부분의 다른 에너지원보다 우수하다고 생각합니다.
석유 및 가스 회사는 예지 보전 솔루션을 적용하여 이익을 얻고 있습니다. IoT 기반의 예지 보전을 통해 석유 및 가스 기업은 가능한 고장을 파악하고 중요도가 높은 자산의 생산량을 늘릴 수 있습니다. 따라서 셰브론과 같은 기업은 IoT 개발을 채택하고 부식 및 파이프라인 손상을 줄이기 위한 예지보전 솔루션을 구축하고 있습니다. 이 솔루션은 파이프라인 전체에 설치된 센서를 사용하여 파이프라인의 내경과 두께와 함께 pH, CO2/H2S 수용액 함량 및 가스 누출을 측정합니다. 이 솔루션은 실시간 센서 데이터를 수집하고 평가, 분석 및 예측을 위해 클라우드로 전달합니다.
이 지역은 스마트 그리드 기술 도입의 최전선에 있습니다. 이 지역의 에너지 유틸리티 부문에서 사업을 전개하는 많은 기업들이 빅데이터 분석을 완전히 도입하고 있거나 도입 과정에 있습니다. 미국 시장에서 많은 대규모 투자자 소유의 공익 기업이 고객을 위해 스마트 미터를 개발 중입니다. 미국 에너지정보국에 따르면 미국에서는 2022년 말까지 1억 1,900만대의 스마트 미터가 설치될 예정이었지만, 2023년 말까지 1억 2,800만대의 스마트 미터 도입이 완료되었습니다.
빅데이터는 이 지역의 기상변수를 정확하게 예측하기 위해 널리 사용됩니다. 다른 데이터 소스와 모델은 실시간 분석을 위한 컴퓨팅 지능 기술을 사용하여 관측됩니다. 최근 풍력발전, 태양광발전, 수력발전, 바이오매스발전, 축전지, 기타 재생가능기술원을 기제품으로 지원해 시장을 선도하는 신재생에너지 감시 및 분석 플랫폼인 Bazefield는 머신러닝 기반의 태양광 발전 고급 분석 패키지인 골드 스탠다드 EnSight를 하나의 플랫폼으로 통합하여 태양광 기능을 강화했습니다.
에너지 부문의 빅 데이터 분석 업계 개요
에너지 부문의 빅 데이터 분석 시장은 글로벌 기업와 중소기업이 존재하기 때문에 매우 세분화되고 있습니다. 이 시장의 주요 기업으로는 IBM Corporation, Siemens AG, SAP SE, Dell Technologies Inc., Accenture PLC 등이 있습니다. 시장 선수들은 제품 제공을 강화하고 지속 가능한 경쟁 우위를 얻기 위해 제휴 및 인수와 같은 전략을 채택합니다.
2023년 11월- Siemens는 그리드 소프트웨어 파트너의 기존 생태계를 확장하기 위해 중요한 인프라 회사에 자산 계획 소프트웨어 및 분석 소프트웨어를 제공하는 캐나다 Copperleaf와 협력했습니다. 이 전략적 파트너십은 변속기 사업자(TSO)와 배전 계통 운영 사업자(DSO)의 투자와 기술 그리드 계획을 최적화하는 것을 목표로 합니다. 이 파트너십은 지멘스 그리드 계획, 운영, 유지 보수 소프트웨어와 카퍼 리프의 자산 관리 능력을 결합하여 광범위한 전력 시스템 및 그리드 제어 분야에 대한 전문 지식을 제공합니다.
기타 혜택:
엑셀 형식 시장 예측(ME) 시트
3개월간의 애널리스트 및 지원
목차
제1장 서론
조사의 전제조건과 시장 정의
조사 범위
제2장 조사 방법
제3장 주요 요약
제4장 시장 인사이트
시장 개요
업계의 매력도 - Porter's Five Forces 분석
공급기업의 협상력
구매자 및 소비자의 협상력
신규 참가업체의 위협
대체품의 위협
경쟁 기업간 경쟁 관계의 강도
거시 경제 동향의 영향 평가
제5장 시장 역학
시장 성장 촉진요인
방대한 데이터의 유입
원유 가격 변동
시장 성장 억제요인
숙련 노동자의 부족
제6장 시장 세분화
용도별
그리드 오퍼레이션
스마트 미터
자산 및 노동력 관리
지역별
북미
유럽
아시아
호주 및 뉴질랜드
라틴아메리카
중동 및 아프리카
제7장 경쟁 구도
기업 프로파일
IBM Corporation
Siemens AG
SAP SE
Dell Technologies Inc.
Accenture PLC
Infosys Limited
Intel Corporation
Microsoft Corporation
Palantir Technologies Inc.
Enel X Italia Srl(Enel SpA)
제8장 투자 분석
제9장 시장의 미래
SHW
영문 목차
영문목차
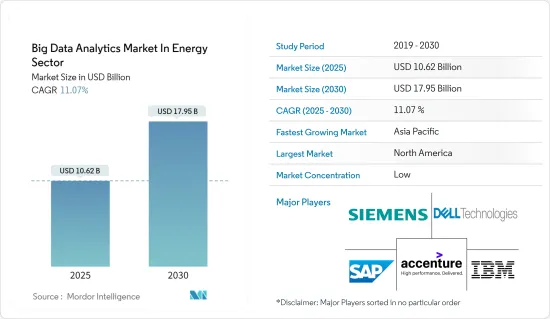
The Big Data Analytics Market In Energy is expected to grow from USD 10.62 billion in 2025 to USD 17.95 billion by 2030, at a CAGR of 11.07% during the forecast period (2025-2030).
Big data solutions aid in collecting and processing data required by oil and gas firms to improve reservoir production efficiency. Various downhole sensors are used to obtain the data (temperature, acoustic, pressure, etc.). Companies, for example, can use big data analytics to create reservoir management systems that provide fast and actionable information about changes in reservoir pressure, temperature, flow, and acoustics. This allows companies to gain greater control over their operations while enhancing profitability.
Key Highlights
Every process currently is driven and supported by the energy sector. Every entity requires more energy than ever before and wants it at a reasonable price, and the advancement of big data and analytics has made it a real possibility. Big data enables enterprises to collect, store, and analyze massive amounts of information (terabytes and petabytes). For years, the power and energy industries have worked with big data and routinely processed large amounts of data.
Unlike conventional electricity meters, which provide data every month, smart meters can give readings on a minute basis that are on a more granular level, causing considerable data generation and resulting in a volumetric increase in data gathered. Data is being collected from both the demand and supply side, owing to the increasing application of sensors, wireless transmission, network communication, and cloud computing technologies.
The volatility in the oil prices leads to high expenditure on energy-related projects, which creates a major demand for big data analytics. The need for quality information is increasing, which is expected to boost the market's growth.
In the current scenario, the lack of digital skills and digital mindsets aggravated by the lack of skilled professionals and workforce to handle the unstructured data effectively for analysis is one of the factors hindering the market growth.
Energy consumption is directly impacted by macroeconomic variables such as GDP growth rates, industrial production, and consumer expenditure. Energy consumption generally rises with economic growth in several sectors, including manufacturing, transportation, and residential. To optimize the processes involved in production distribution and consumption, the energy sector needs increasingly sophisticated analytic solutions. For instance, according to a World Bank estimate, the North American GDP, which was USD 32.32 trillion in 2023, is predicted to increase by 1.5% in 2023-24, suggesting that corporate activity and possible big data analytics in energy sector investments are projected to flourish.
Big Data Analytics in Energy Sector Market Trends
Grid Operations Application Segment is Expected to Hold Significant Market Share
The demand for energy across the world is rising. According to the International Energy Agency, between 2005 and 2030, energy needs are estimated to expand by 55%, with the demand rising from 11.4 billion metric tons of oil equivalent to 17.7 billion, and the forecasted global energy consumption will be 886.3 quadrillion British thermal units by 2050. With renewable energy sources, such as solar power, which contributes electricity to the power grid, utilities can use demand response analytics to determine the timings to release these power sources during peak demand.
Data analytics possess a critical role in modern industrial systems. In the power grid, traditional fossil fuels face the problem of depletion, and de-carbonization demands the power system to reduce carbon emissions. Smart grid and super grid are effective solutions to accelerate the pace of electrification with high penetration of renewable energy sources.
Traditional electricity meters used in distribution systems only produce a small amount of data that can be manually collected and analyzed for billing purposes. The huge volume of data collected from two-way communication smart grids at various time resolutions requires advanced data analytics to extract important information for billing information and the status of the electricity network. For instance, the high-resolution user consumption data can also be used for demand forecasting, customer behavior analysis, and energy generation optimization.
Smart grid big data analytics can potentially transform the utility industry. However, it needs to be appropriately used to maximize its value. Smart grid analytics divided itself into back-office analytics (certain functions, like overseeing grid connectivity, load forecasting, and reliability reporting) and distributed analytics (analyzing data from meters, sensors, and other devices).
Predictive maintenance and fault detection based on data analytics with advanced metering infrastructure are more crucial to the security of the power system. They are expected to be the solutions that are expected to be now utilized by the early adopters as the solutions have been integrated into their organization. GE's New Analytics Technologies is boosting grid efficiency. The company has also rolled out a new portfolio of predictive analytics that could allow utilities to use data from transmission and distribution networks to achieve better operational efficiency as more distributed assets are introduced to the grid.
North America is Expected to Hold Significant Market Share
North America is one of the leading innovators and pioneers in the adoption of big data analytics. The region offers lucrative opportunities for market growth, exhibiting a massive demand for big data analytics in the energy sector owing to the strong foothold of big data analytics vendors.
The United States plays a key role in proliferating the demand from the North American region compared to Canada. The country has increased demand, especially from oil and gas, refining, and power generation segments. The majority of Americans consider solar and wind power as good sources of energy for the environment. Around 65% of the population suggests that the environmental effect of wind turbine farms is better than that of most other sources.
The oil and gas companies benefit from applying predictive maintenance solutions. IoT-based predictive maintenance enables oil and gas companies to identify possible failures and increase the production of highly critical assets. Thus, companies such as Chevron employed IoT development to roll out a predictive maintenance solution that helps mitigate corrosion and pipeline damage. The solution uses sensors installed across the pipeline to measure the pH, aqueous CO2/H2S content, and gaseous leakages along with the pipeline's internal diameter and thickness. The solution collects real-time sensor data and passes it to the cloud for evaluation, analysis, and prediction.
The region has been at the forefront of adopting smart grid technology. A large number of companies operating in the energy utility sector in the region have either fully deployed big data analytics or are in the process of implementation. Many large investor-owned utilities in the US market are still in the process of rolling out smart meters for their customers. According to the US Energy Information Administration, 119 million smart meters were to be installed in the US by the end of 2022, whereas 128 million smart meter deployments were completed by the end of 2023.
Big data is extensively being used for the accurate prediction of meteorological variables in the region. Disparate data sources and models are observed using computational intelligence techniques for real-time analysis. Recently, Bazefield, the market-leading renewable monitoring and analytics platform with off-the-shelf support for wind power, solar, hydro, biomass, battery storage, and other renewable technology sources, enhanced its solar capabilities by embedding the gold standard EnSight, machine learning-based solar advanced analytics package, into Bazefield as one single platform.
Big Data Analytics in Energy Sector Industry Overview
Big data analytics in the energy sector market is highly fragmented due to the presence of global players and small- and medium-sized enterprises. Some of the major players in the market are IBM Corporation, Siemens AG, SAP SE, Dell Technologies Inc., and Accenture PLC. Players in the market are adopting strategies such as partnerships and acquisitions to enhance their product offerings and gain sustainable competitive advantage.
November 2023 - Siemens partnered with Copperleaf, a Canadian-based provider of asset planning software and analytics software for critical infrastructure companies, to grow its existing ecosystem of grid software partners. The strategic partnership aims to optimize investment and technical grid planning for transmission system operators (TSOs) and distribution system operators (DSOs). The partnership will bring extensive power systems and grid control domain expertise, combining Siemens grid planning, operations, and maintenance software and Copperleaf's assets management capabilities.
Additional Benefits:
The market estimate (ME) sheet in Excel format
3 months of analyst support
TABLE OF CONTENTS
1 INTRODUCTION
1.1 Study Assumptions and Market Definition
1.2 Scope of the Study
2 RESEARCH METHODOLOGY
3 EXECUTIVE SUMMARY
4 MARKET INSIGHTS
4.1 Market Overview
4.2 Industry Attractiveness - Porter's Five Forces Analysis
4.2.1 Bargaining Power of Suppliers
4.2.2 Bargaining Power of Buyers/ Consumers
4.2.3 Threat of New Entrants
4.2.4 Threat of Substitutes
4.2.5 Intensity of Competitive Rivalry
4.3 An Assessment of the Impact of Macroeconomics Trends