ㅁ Add-on 가능: 고객의 요청에 따라 일정한 범위 내에서 Customization이 가능합니다. 자세한 사항은 문의해 주시기 바랍니다.
ㅁ 보고서에 따라 최신 정보로 업데이트하여 보내드립니다. 배송기일은 문의해 주시기 바랍니다.
한글목차
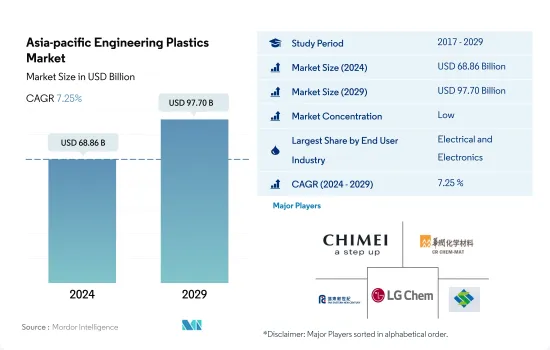
아시아태평양의 엔지니어링 플라스틱 시장 규모는 2024년에 688억 6,000만 달러에 달했습니다. 2029년에는 977억 달러에 이를 것으로 예상되며, 예측 기간 중(2024-2029년) CAGR은 7.25%를 나타낼 것으로 전망됩니다.
포장업계는 전기 및 전자업계에 수량 점유율을 빼앗깁니다.
엔지니어링 플라스틱은 범용성이 높고, 항공우주의 내장벽 패널이나 도어부터 경질 포장이나 연질 포장까지, 모든 용도에 사용되고 있습니다. 아시아태평양의 엔지니어링 플라스틱 시장은 주로 포장, 전기 및 전자, 자동차 산업이 견인하고 있습니다. 2022년에는 엔지니어링 플라스틱 시장 전체의 약 43.80%를 포장, 31.32%를 전기 및 전자가 차지했습니다.
2020년에는 전 세계 공급망의 혼란으로 인해 전 산업을 합친 소비 수익은 전년 대비 6.02% 감소했습니다. 그러나 2021년 시장은 회복되었고 2022년에는 7.18% 증가해 안정된 성장을 이어갔습니다.
포장 산업은 수량 공유에서이 지역에서 가장 큰 최종 사용자 산업입니다. 그러나 수익 데이터에 따르면 포장 용도에 널리 사용되는 다른 엔지니어링 플라스틱 중에서도 PET 가격이 비교적 저렴하기 때문에 전기 및 전자 산업이이 지역에서 가장 큰 점유율을 차지하고 있습니다. 도시화와 가족 구성의 현저한 변화로 인해 기능적이고 포장된 편리한 식품에 대한 수요가 증가하고 있습니다. 예를 들어 아시아태평양의 플라스틱 포장 생산량은 2022년 6,800만 톤에 이르렀으며 전 세계의 51%를 차지했습니다.
전기 및 전자산업이 가장 유망한 시장에서 예측기간(2023-2029년)의 수익과 예측 CAGR은 8.21%를 나타낼 것으로 예상됩니다. 이 지역의 전자부품 생산 수입은 스마트 전자 디바이스 수요 증가, 전기자동차, 자율형 로봇, 고도 방어 기술 등 수요 증가로 2029년까지 6조 7,400억 달러에 달할 것으로 예측됩니다.
중국과 일본이 가장 큰 수요 창출국으로 계속
2022년 아시아태평양의 엔지니어링 플라스틱은 세계 소비량의 56.7%를 차지했습니다. 엔지니어링 플라스틱은 자동차, 포장, 전기 및 전자 등 다양한 산업에서 용도를 찾을 수 있기 때문에 범용성이 높은 특성을 나타냅니다.
중국은 전기 및 전자, 포장, 자동차 등의 산업이 성장하고 있기 때문에 이 지역에서 가장 큰 엔지니어링 플라스틱 소비국입니다. 2022년 중국의 전기 및 전자산업은 아시아태평양 전체에 비해 29.26%의 수익 점유율을 차지했습니다. 중국의 전기 및 전자 부품 생산으로부터의 수익은 2022년에 29억 2,000만 달러를 차지했습니다.
일본은 이 지역에서 두 번째로 큰 엔지니어링 플라스틱의 소비국입니다. 이 나라는 건설 및 전기 및 전자산업이 급성장하고 있기 때문에 2022년에는 8.29%의 매출 점유율을 기록했습니다. 2022년 일본의 건축 및 건설 업계의 신설 바닥 면적은 2021년에 7.47%, 2022년에 4.11%의 비율로 증가했습니다. 전기 및 전자부품의 생산이 증가하고 있기 때문에 이 나라에서는 향후 엔지니어링 플라스틱 수요가 높아질 것으로 예측됩니다.
중국은 자동차 및 일렉트로닉스 등 산업의 급성장으로 예측기간 동안 금액 기준으로 CAGR은 7.50%가 될 것으로 전망되고 아시아태평양의 엔지니어링 플라스틱 시장에서 가장 빠른 성장을 이룰 것으로 예상됩니다. 2022년 이후 중국은 승용차 제조에 있어서의 외자 규제를 철폐해, 중국 정부와 자동차 엔지니어링 기업과의 합작 사업에 대한 투자가 50대 50의 비율로 최대까지 인정되었습니다. 이러한 변화는 투자 확대로 중국 자동차 산업의 성장 기회를 가져옵니다.
아시아태평양의 엔지니어링 플라스틱 시장 동향
전자 생산을 촉진하는 ASEAN 국가의 급성장
아시아태평양에서는 2020년부터 2021년에 걸쳐 전기 및 전자기기 생산 수입이 13.9% 증가했습니다. 전자부문은 대부분의 아시아 국가 수출 총액의 20-50%를 차지합니다. TV, 라디오, 컴퓨터, 휴대전화 등 대부분의 가전제품은 ASEAN 지역에서 생산되고 있습니다.
ASEAN은 하드 디스크 드라이브 생산을 선도하고 있으며 하드 디스크 드라이브의 80% 이상이 ASEAN 지역 내에서 생산되고 있습니다. 전반적으로 ASEAN의 전기 및 전자(E&E) 산업은 다른 산업보다 외국에서의 투입물과 기술에 의존하고 있으며, E&E 수출의 53%는 ASEAN의 E&E 수출에 내장된 외국 부가가치(FVA) 또는 외국에서의 투입물로부터 발생하고 있습니다.
태국과 말레이시아 같은 국가들은 지역 내 전자 생산을 선도하고 있습니다. 동남아시아 최대급 전자기기 조립기지를 보유한 태국은 하드 드라이브, 집적회로, 반도체 생산에 선도하고 있습니다. 에어컨 제조에서는 2위, 세계 냉장고 시장에서는 4위입니다.
전자 산업은 중국과 일본과 같은 아시아 경제 대국과의 무역 개선을 촉진하는 ASEAN의 통합 생산 네트워크로부터 큰 혜택을 누리고 있습니다.
중국은 전기 제품의 세계 수출에서 11.2%의 점유율을 차지했으며, 2019년부터 2020년까지 디지털 제품의 수출에서 5.8%의 성장을 기록했습니다. 아시아개발은행에 따르면 중국은 이 지역의 전자기기에 큰 시장을 제공합니다. 태국, 일본, 중국, 말레이시아, 인도, 필리핀 등의 국가들은 전자 생산에서 계속 이 지역을 선도하고 있습니다.
아시아태평양의 엔지니어링 플라스틱 산업의 개요
아시아태평양의 엔지니어링 플라스틱 시장은 단편화되어 있으며 상위 5개사에서 22.59%를 차지하고 있습니다. 이 시장 주요 기업은 다음과 같습니다. CHIMEI, China Resources(Holdings), Far Eastern New Century Corporation, LG Chem and Sanfame Group(알파벳순 정렬).
기타 혜택
엑셀 형식 시장 예측(ME) 시트
3개월의 애널리스트 서포트
목차
제1장 주요 요약과 주요 조사 결과
제2장 보고서 제안
제3장 소개
조사의 전제조건과 시장 정의
조사 범위
조사 방법
제4장 주요 산업 동향
최종 사용자 동향
항공우주
자동차
건축 및 건설
전기 및 전자
포장
수출입 동향
플루오로폴리머 무역
폴리아미드(PA) 무역
폴리카보네이트(PC) 무역
폴리에틸렌 테레프탈레이트(PET) 무역
폴리메틸 메타크릴레이트(PMMA) 무역
폴리옥시메틸렌(POM) 무역
스티렌 공중합체(ABS와 SAN) 무역
가격 동향
재활용 동향
폴리아미드(PA) 재활용 동향
폴리카보네이트(PC) 재활용 동향
폴리에틸렌 테레프탈레이트(PET) 재활용 동향
스티렌 공중합체(ABS, SAN) 재활용 동향
규제 프레임워크
호주
중국
인도
일본
말레이시아
한국
밸류체인과 유통채널 분석
제5장 시장 세분화
최종 사용자 산업
항공우주
자동차
건축 및 건설
전기 및 전자
산업 및 기계
포장
기타 최종 사용자 산업
수지 유형
플루오로폴리머
하위 수지 유형별
에틸렌테트라플루오로에틸렌(ETFE)
불소화 에틸렌-프로필렌(FEP)
폴리테트라플루오로에틸렌(PTFE)
폴리비닐플루오라이드(PVF)
폴리비닐리덴 플루오라이드(PVDF)
기타 하위 수지 유형
액정 폴리머(LCP)
폴리아미드(PA)
하위 수지 유형별
아라미드
폴리아미드(PA) 6
폴리아미드(PA) 66
폴리프탈아미드
폴리부틸렌 테레프탈레이트(PBT)
폴리카보네이트(PC)
폴리에테르 에테르 케톤(PEEK)
폴리에틸렌 테레프탈레이트(PET)
폴리이미드(PI)
폴리메틸 메타크릴레이트(PMMA)
폴리옥시메틸렌(POM)
스티렌 공중합체(ABS 및 SAN)
국가
호주
중국
인도
일본
말레이시아
한국
기타 아시아태평양
제6장 경쟁 구도
주요 전략 동향
시장 점유율 분석
기업 상황
기업 프로파일
Asahi Kasei Corporation
CHIMEI
China Petroleum & Chemical Corporation
China Resources(Holdings) Co.,Ltd.
Covestro AG
Far Eastern New Century Corporation
Formosa Plastics Group
LG Chem
Lotte Chemical
Mitsubishi Chemical Corporation
Sanfame Group
Sinochem
Solvay
Sumitomo Chemical Co., Ltd.
Toray Industries, Inc.
제7장 CEO에 대한 주요 전략적 질문
제8장 부록
세계 개요
개요
Five Forces 분석 프레임워크(산업 매력도 분석)
세계의 밸류체인 분석
시장 역학(DROs)
정보원과 참고문헌
도표 일람
주요 인사이트
데이터 팩
용어집
KTH
영문 목차
영문목차
The Asia-pacific Engineering Plastics Market size is estimated at 68.86 billion USD in 2024, and is expected to reach 97.70 billion USD by 2029, growing at a CAGR of 7.25% during the forecast period (2024-2029).
Packaging industry to lose its volume share to electrical and electronics industry
Engineering plastics are versatile, finding applications in everything from interior wall panels and doors in aerospace to rigid and flexible packaging. The Asia-Pacific engineering plastics market is primarily driven by the packaging, electrical and electronics, and automotive industries. In 2022, packaging and electrical and electronics accounted for approximately 43.80% and 31.32% of the total engineering plastics market volume, respectively.
In 2020, the combined consumption revenue across all industries fell by 6.02% compared to the previous year due to disruptions in the global supply chain. However, the market recovered in 2021 and continued to grow steadily, increasing by 7.18% in 2022.
The packaging industry is the largest end-user industry in the region in terms of volume share. However, according to revenue data, the electrical and electronics industry holds the largest share in the region due to the relatively low price of PET, among other engineering plastics, which are widely used in packaging applications. Significant changes in urbanization and family demographics have increased the demand for functional, prepackaged, and convenient food products. For instance, Asia-Pacific plastic packaging production reached a volume of 68 million tons in 2022, accounting for 51% of the global total.
The electrical and electronic industry is the most promising market, with an expected CAGR of 8.21% by revenue during the forecast period (2023-2029). Electronics component production revenue in the region is projected to reach USD 6.74 trillion by 2029, driven by the increasing demand for smart electronic devices, the growing demand for electric vehicles, autonomous robots, and advanced defense technologies.
China and Japan to remain as largest demand generators
Asia-Pacific accounted for 56.7% by volume of the consumption of engineering plastics globally in 2022. Engineering plastics exhibit versatile properties due to which they find applications in various industries, such as automotive, packaging, and electrical and electronics.
China is the largest consumer of engineering plastics in the region owing to its growing electrical and electronics, packaging, automotive, and other industries. In 2022, the Chinese electrical and electronics industry held a revenue share of 29.26% compared to the overall Asia-Pacific region. In China, the revenue from electrical and electronic component production accounted for USD 2.92 billion in 2022.
Japan is the second-largest consumer of engineering plastics in the region. The country registered a revenue share of 8.29% in 2022 due to its rapidly growing construction and electrical and electronics industries. In 2022, the new construction floor area of the Japanese building and construction industry increased at a rate of 7.47% and 4.11% in 2021 and 2022 by revenue, respectively. The rising electrical and electronics component production is projected to drive the demand for engineering plastics in the country in the future.
China is expected to witness the fastest growth in the Asia-Pacific engineering plastics market, with a CAGR of 7.50% in terms of value during the forecast period, owing to the rapid growth of industries like automotive and electronics. From 2022 onward, China lifted the restrictions on foreign investment in passenger car manufacturing, allowing for maximum investment in joint ventures between the Chinese government and automotive engineering companies to reach a 50:50 ratio. This change presents an opportunity for growth in the Chinese automotive industry through increased investment.
Asia-pacific Engineering Plastics Market Trends
Rapid growth in ASEAN countries to foster electronics production
The Asia-Pacific region saw an increase in electrical and electronics production revenue by 13.9% from 2020 to 2021. The electronics sector accounts for 20-50% of the total value of most Asian countries' exports. Consumer electronics such as televisions, radios, computers, and cellular phones are largely manufactured in the ASEAN region.
ASEAN leads the production of hard drives, with over 80% of hard drives being manufactured in the region. Overall, the electrical and electronics (E&E) industry in ASEAN relies more on foreign inputs and technology than other industries, with 53% of E&E exports arising from foreign value added (FVA) or foreign inputs integrated into ASEAN's E&E exports.
Countries like Thailand and Malaysia lead in the production of electronics in the region. Thailand, home to one of the largest electronics assembly bases in Southeast Asia, leads in the production of hard drives, integrated circuits, and semiconductors. It ranks second in manufacturing air conditioning units and fourth in the global refrigerators market.
The electronics industry has greatly benefitted from ASEAN's integrated production networks, which foster improved trade with larger Asian economies like China and Japan.
China held an 11.2% share of global exports in electrical products and registered a growth of 5.8% in the export of digital products from 2019 to 2020. According to the Asian Development Bank, China provides a large market for electronics in the region. Countries such as Thailand, Japan, China, Malaysia, India, and the Philippines continue to lead the region in the production of electronics.
APAC Engineering Plastics Industry Overview
The Asia-pacific Engineering Plastics Market is fragmented, with the top five companies occupying 22.59%. The major players in this market are CHIMEI, China Resources (Holdings) Co.,Ltd., Far Eastern New Century Corporation, LG Chem and Sanfame Group (sorted alphabetically).
4.4.4 Styrene Copolymers (ABS and SAN) Recycling Trends
4.5 Regulatory Framework
4.5.1 Australia
4.5.2 China
4.5.3 India
4.5.4 Japan
4.5.5 Malaysia
4.5.6 South Korea
4.6 Value Chain & Distribution Channel Analysis
5 MARKET SEGMENTATION (includes market size in Value in USD and Volume, Forecasts up to 2029 and analysis of growth prospects)
5.1 End User Industry
5.1.1 Aerospace
5.1.2 Automotive
5.1.3 Building and Construction
5.1.4 Electrical and Electronics
5.1.5 Industrial and Machinery
5.1.6 Packaging
5.1.7 Other End-user Industries
5.2 Resin Type
5.2.1 Fluoropolymer
5.2.1.1 By Sub Resin Type
5.2.1.1.1 Ethylenetetrafluoroethylene (ETFE)
5.2.1.1.2 Fluorinated Ethylene-propylene (FEP)
5.2.1.1.3 Polytetrafluoroethylene (PTFE)
5.2.1.1.4 Polyvinylfluoride (PVF)
5.2.1.1.5 Polyvinylidene Fluoride (PVDF)
5.2.1.1.6 Other Sub Resin Types
5.2.2 Liquid Crystal Polymer (LCP)
5.2.3 Polyamide (PA)
5.2.3.1 By Sub Resin Type
5.2.3.1.1 Aramid
5.2.3.1.2 Polyamide (PA) 6
5.2.3.1.3 Polyamide (PA) 66
5.2.3.1.4 Polyphthalamide
5.2.4 Polybutylene Terephthalate (PBT)
5.2.5 Polycarbonate (PC)
5.2.6 Polyether Ether Ketone (PEEK)
5.2.7 Polyethylene Terephthalate (PET)
5.2.8 Polyimide (PI)
5.2.9 Polymethyl Methacrylate (PMMA)
5.2.10 Polyoxymethylene (POM)
5.2.11 Styrene Copolymers (ABS and SAN)
5.3 Country
5.3.1 Australia
5.3.2 China
5.3.3 India
5.3.4 Japan
5.3.5 Malaysia
5.3.6 South Korea
5.3.7 Rest of Asia-Pacific
6 COMPETITIVE LANDSCAPE
6.1 Key Strategic Moves
6.2 Market Share Analysis
6.3 Company Landscape
6.4 Company Profiles (includes Global Level Overview, Market Level Overview, Core Business Segments, Financials, Headcount, Key Information, Market Rank, Market Share, Products and Services, and Analysis of Recent Developments).
6.4.1 Asahi Kasei Corporation
6.4.2 CHIMEI
6.4.3 China Petroleum & Chemical Corporation
6.4.4 China Resources (Holdings) Co.,Ltd.
6.4.5 Covestro AG
6.4.6 Far Eastern New Century Corporation
6.4.7 Formosa Plastics Group
6.4.8 LG Chem
6.4.9 Lotte Chemical
6.4.10 Mitsubishi Chemical Corporation
6.4.11 Sanfame Group
6.4.12 Sinochem
6.4.13 Solvay
6.4.14 Sumitomo Chemical Co., Ltd.
6.4.15 Toray Industries, Inc.
7 KEY STRATEGIC QUESTIONS FOR ENGINEERING PLASTICS CEOS
8 APPENDIX
8.1 Global Overview
8.1.1 Overview
8.1.2 Porter's Five Forces Framework (Industry Attractiveness Analysis)