북미의 산업용 공기 품질 관리 시스템 : 시장 점유율 분석, 산업 동향과 통계, 성장 예측(2025-2030년)
North America Industrial Air Quality Control Systems - Market Share Analysis, Industry Trends & Statistics, Growth Forecasts (2025 - 2030)
상품코드:1683801
리서치사:Mordor Intelligence
발행일:2025년 03월
페이지 정보:영문
라이선스 & 가격 (부가세 별도)
ㅁ Add-on 가능: 고객의 요청에 따라 일정한 범위 내에서 Customization이 가능합니다. 자세한 사항은 문의해 주시기 바랍니다.
ㅁ 보고서에 따라 최신 정보로 업데이트하여 보내드립니다. 배송기일은 문의해 주시기 바랍니다.
한글목차
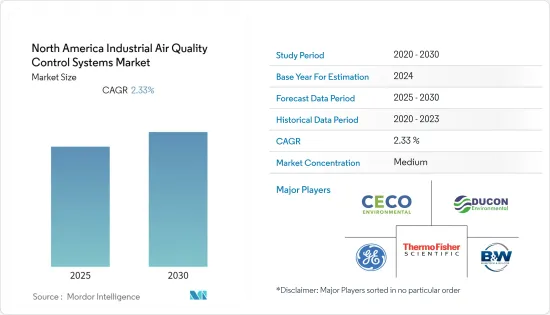
북미의 산업용 공기 품질 관리 시스템 시장은 예측 기간 동안 CAGR 2.33%로 성장할 전망입니다.
주요 하이라이트
중기적으로 시장은 대기 오염을 통제하기 위한 엄격한 정부 규제에 의해 주도될 것으로 예상됩니다.
반면, 재생 에너지의 채택이 증가하면서 예측 기간 동안 시장 성장을 저해할 것으로 예상됩니다.
그럼에도 불구하고 시멘트 및 철강 산업에는 상당한 기회가 있습니다. 이는 결국 산업용 공기질 관리 시스템 공급업체가 이 시장에 진출할 수 있는 중요한 기회를 창출할 것으로 예상됩니다.
미국이 대부분의 수요가 수많은 최종 사용 산업에서 발생하면서 시장을 지배 할 것으로 예상됩니다.
북미의 산업용 공기 품질 관리 시스템 시장 동향
발전 산업 부문이 현저한 성장을 이루
화석 연료를 통한 발전은 대기 오염의 중요한 원인 중 하나이며 전 세계적으로 지구 온난화 배출의 주요 원인입니다. 발전소 배출은 광범위한 영향을 미치며 대기 오염과 같은 장기적인 영향을 초래할 수 있습니다.
화석 연료 기반 에너지는 천연가스나 석탄과 같은 화석 연료를 연소하여 전기를 생산하는 화력발전소에서 배출됩니다. 발전소에서 화석 연료를 연소하면 질소산화물(NOX), 이산화황(SO2), 입자상 물질(PM), 이산화탄소(CO2), 수은(Hg) 및 기타 오염 물질을 포함한 배출물이 발생하게 됩니다.
미국 에너지 정보국(EIA)에 따르면 2021년 미국 전력부문은 115억 3,900만 톤(MMmt)의 이산화탄소를 배출했습니다. 이는 2010년 이후 연간 배출량의 가장 큰 증가였습니다. 2022년 미국은 COVID-19 팬데믹으로부터의 회복을 목표로, 배출량은 급회복했습니다. 2022년 증가에도 불구하고 미국 전력 부문 배출량은 20년 이상 두 번째로 적었고, 2007년(2.4GtCO2)보다 36%나 적습니다.
미국의 석탄 발전소는 2022년 8억 4,700만 톤의 이산화탄소(MtCO2)를 배출했습니다. 증가에도 불구하고, 석탄은 미국의 전력 관련 배출의 1차 출처로 계속되고 있습니다. 석탄발전소 배출량은 2020년 사상 최저 787 MtCO2로 감소했습니다.배출량 감소는 미국에서 발전원으로서 석탄을 단계적으로 퇴출하고 천연가스 발전으로 전환했기 때문입니다. 미국의 전력 산업 배출량은 석탄과 천연가스의 경우 텍사스에서 가장 높습니다.
2021년 캐나다 전력부문의 이산화탄소 배출량은 7,880만톤(MtCO)에 이르렀습니다. 이는 전년 대비 약 4.09% 증가했습니다. 캐나다 전력 부문 배출량은 2000년 135.5MtCO에서 2022년 78.8MtCO로 감소했습니다. 그 이후로 배출량은 2000년과 2022년 사이에 크게 감소했습니다.
2022년 7월 캐나다는 '배출 감축 계획 2030'을 발표했습니다. 이것은 깨끗한 공기와 강력한 경제를 목표로 캐나다의 후속 단계에 대한 야심적이고 실현 가능한 로드맵입니다. 이 계획에는 2030년까지 40%, 2050년까지 순배출 제로라는 배출 감축 목표를 달성하기 위한 캐나다의 부문별 접근 방식이 요약되어 있습니다.
따라서 부문별 배출 목표가 설정됨에 따라 예측 기간 동안 발전 산업에서 대기질 관리 시스템에 대한 수요가 크게 증가할 것으로 예상됩니다.
시장을 독점하는 미국
미국은 발전, 산업 및 자동차 부문의 상당한 온실가스 배출 기여로 인해 북미에서 산업용 대기질 관리 시스템의 가장 큰 시장 중 하나가 될 것으로 예상됩니다.
미국 에너지 정보국(EIA)에 따르면 미국의 에너지 소비로 인한 CO2 배출량은 2022년 약 49억 7,000만 톤이었습니다. 이산화탄소 배출량은 202년에 약간 증가했으며, 지난 수십년간 더 깨끗한 에너지원으로의 전환과 석탄으로부터의 철수에 따라 크게 감소하고 있습니다.
그러나 2021년에는 미국 내 90% 이상의 도시가 PM2.5 수준의 WHO 연간 5㎍/m3 가이드라인을 밑돌지 못했고, 이들 도시는 지역 인구의 98% 이상을 차지하고 있습니다. 주요 오염원은 가스 및 디젤 동력 운송, 석탄 기반 에너지 발전 산업 배출, 산불이었습니다.
발전 외에도 예측 기간 동안 자동차, 석유 및 가스, 철강, 시멘트 제조, 화학 부문의 급속한 성장으로 인해 산업 대기질 관리 시스템의 채택이 늘어날 것으로 예상됩니다.
미국은 최근 몇 년 동안 자동차 산업에서 가장 강력한 발전을 목격하고 있습니다. 미국은 세계에서 가장 큰 자동차 시장 중 하나입니다. 미국 경제분석국에 따르면 2022년 11월 미국의 자동차 총 판매량은 1,460만대를 넘어 2021년 동월 대비 약 8% 증가했습니다.전반적으로 미국은 중국에 이어 세계에서 두 번째로 큰 자동차 판매 및 생산 시장입니다. 또한, 미국은 자동차 부문에 대한 대규모 투자를 목격할 가능성이 높으며, 이는 향후 산업용 공기질 관리 시스템 시장의 성장을 증가시킬 것입니다.
따라서 미국의 산업 전반에 걸친 투자가 증가함에 따라 예측 기간 동안 산업 공기질 제어 시스템 시장을 지배 할 것으로 예상됩니다.
북미의 산업용 공기 품질 관리 시스템 산업 개요
북미의 산업용 공기 품질 관리 시스템 시장은 그 특성상 적당히 단편화되어 있습니다. 시장의 주요 기업(특정한 순서 없음)에는 Babcock & Wilcox Enterprises Ltd, Ducon Technologies Inc, General Electric Company, CECO Environmental Corporation, Thermo Fisher Scientific Inc. 등이 있습니다.
기타 혜택:
엑셀 형식 시장 예측(ME) 시트
3개월간의 애널리스트 지원
목차
제1장 서론
조사 범위
시장의 정의
조사의 전제
제2장 주요 요약
제3장 조사 방법
제4장 시장 개요
소개
시장 규모 및 수요 예측(-2028년)
최근 동향과 개발
정부의 규제와 정책
시장 역학
성장 촉진요인
대기 오염을 통제를 위한 엄격한 정부 규제
억제요인
재생 에너지 채택 증가
공급망 분석
Porter's Five Forces 분석
공급기업의 협상력
소비자의 협상력
신규 참가업체의 위협
대체품의 위협
경쟁 기업간 경쟁 관계의 강도
제5장 시장 세분화
유형
전기 집진 장치(ESP)
배연 탈황 장치(FGD)와 스크러버
선택적 촉매 환원(SCR)
패브릭 필터
기타
용도
발전산업
시멘트 산업
화학 및 비료
철강 산업
자동차 산업
석유 및 가스 산업
기타 용도
배출 가스(정성 분석만)
질소 산화물(NOx)
황 산화물(SO2)
미립자 물질(PM)
지역
미국
캐나다
멕시코
제6장 경쟁 구도
M&A, 합작사업, 제휴, 협정
주요 기업의 전략
기업 프로파일
Babcock & Wilcox Enterprises Ltd
Ducon Technologies Inc
General Electric Company
Pollution Systems
LDX Solutions
CECO Environmental Corporation
FuelTech Inc
Thermo Fisher Scientific Inc.
Tri-Mer Corporation
Sly Inc
제7장 시장 기회와 앞으로의 동향
시멘트 및 철강 업계에 있어서의 중요한 기회
HBR
영문 목차
영문목차
The North America Industrial Air Quality Control Systems Market is expected to register a CAGR of 2.33% during the forecast period.
Key Highlights
Over the medium term, the market is expected to be driven by strict government regulations to control air pollution.
On the other note, increasing adoption of renewable energy is expected to hinder market growth during the forecast period.
Nevertheless, significant opportunities in the cement and steel industry. This, in turn, is expected to create a significant opportunity for industrial air quality control system providers to tap into this market.
United Staes is expected to dominate the market, with most of the demand coming from numorous end-use indutries.
North America Industrial Air Quality Control Systems Market Trends
Power Generation Industry Segment to Witness Significant Growth
Power generation through fossil fuels is one of the significant causes of air pollution and a leading cause of global warming emissions worldwide. Power plant emissions have extensive effects and can cause long-lasting impacts like air pollution.
Fossil fuel-based energy is released from thermal power plants that burn fossil fuels, such as natural gas or coal, to produce electricity. The burning of fossil fuels at power plants produces emissions, including nitrogen oxide (NOX), sulfur dioxide (SO2), particulate matter (PM), carbon dioxide (CO2), mercury (Hg), and other pollutants.
In 2021, according to the United States Energy Information Administration (EIA), the power sector in the United States produced 11,539 million metric tons (MMmt) of carbon dioxide emissions. This had been the most significant annual increase in emissions since 2010. In 2022, emissions in the United States rebounded rapidly as the country looked to recover from the COVID-19 pandemic. Despite the increase in 2022, power sector emissions in the United States were still the second lowest for more than two decades and 36% lower than in 2007, when they peaked at 2.4 GtCO2.
Coal power plants in the United States emitted 847 million metric tons of carbon dioxide (MtCO2) in 2022. Despite the increase, coal continues to be the primary source of electricity-related emissions in the United States. Coal power plant emissions declined to an all-time low of 787 MtCO2 in 2020. The decline in emissions was due to the phasing out of coal as a source of electricity generation and shifting toward natural gas electric power in the United States. The electric power industry emissions in the United States are highest in Texas for coal and natural gas.
In 2021, Canada's power sector's carbon dioxide emissions amounted to 78.8 million metric tons (MtCO). This was increased by approximately 4.09 % compared to the previous year. Power sector emissions in Canada declined from 135.5 MtCO in 2000 to 78.8 MtCO in 2022. Since then, emissions have plunged significantly between 2000 and 2022.
In July 2022, Canada announced the Emissions Reduction Plan 2030, an ambitious and feasible roadmap for Canada's subsequent steps for clean air and a strong economy. The plan summarizes a sector-by-sector approach for Canada to achieve its emissions reduction target of 40% by 2030 and net-zero emissions by 2050.
Therefore, the set emission targets sector-by-sector is expected to witness significant demand for air quality control systems in the power generation industry during the forecast period.
United States to Dominate the Market
The United States is expected to be one of the largest markets for industrial air quality control systems in North America owing to the significant greenhouse gas emissions contributions from the power generation, Industrial, and automobile sectors.
According to the US Energy Information Administration (EIA), CO2 emissions from the energy consumption in the United States, contributed about 4,970 million metric ton of CO2 in 2022. Though there was a slight rise in CO2 emissions in 202w, the emissions have fallen significantly in recent decades as the country shifts toward cleaner energy sources and phases out coal.
However, in 2021, more than 90% of the cities in the United States could not get below the WHO annual 5 μg/m3 guideline for PM2.5 levels, with those cities accounting for more than 98% of the region's population. The primary sources of pollution were gas and diesel-powered transportation, coal-based energy generation industrial emissions, and wildfires.
In addition to power generation, the adoption of industrial air quality control systems is expected to come from the rapid growth in the automobile, oil and gas, steel, cement manufacturing, and chemical sector during the forecast period.
The United States is witnessing the strongest developments in the automobile industry in recent years. The country has one of the largest automotive markets in the world. According to the US Bureau of Economic Analysis, the total vehicle sales in the United States in November 2022 was more than 14.6 million units, recording about an 8% rise from the same month of 2021. Overall, the United States is the world's second-largest vehicle sales and production market after China. Further, the country is likely to witness massive investments in the automotive sector, which will likely increase the growth of the industrial air quality control systems market in the future.
Therefore, with increasing investments across the industries in the United States is expected to dominate the industrial air quality control systems market during the forecast period.
North America Industrial Air Quality Control Systems Industry Overview
The North America industrial air quality control systems market is moderately fragmented in nature. Some of the major players in the market (in no particular order) include Babcock & Wilcox Enterprises Ltd, Ducon Technologies Inc, General Electric Company, CECO Environmental Corporation, and Thermo Fisher Scientific Inc., among others.
Additional Benefits:
The market estimate (ME) sheet in Excel format
3 months of analyst support
TABLE OF CONTENTS
1 INTRODUCTION
1.1 Scope of the Study
1.2 Market Definition
1.3 Study Assumptions
2 EXECUTIVE SUMMARY
3 RESEARCH METHODOLOGY
4 MARKET OVERVIEW
4.1 Introduction
4.2 Market Size and Demand Forecast in USD, till 2028
4.3 Recent Trends and Developments
4.4 Government Policies and Regulations
4.5 Market Dynamics
4.5.1 Drivers
4.5.1.1 Presence of Strict Government Regulations to Control Air Pollution
4.5.2 Restraints
4.5.2.1 Increasing Adoption of Renewable Energy
4.6 Supply Chain Analysis
4.7 Porter's Five Forces Analysis
4.7.1 Bargaining Power of Suppliers
4.7.2 Bargaining Power of Consumers
4.7.3 Threat of New Entrants
4.7.4 Threat of Substitute Products and Services
4.7.5 Intensity of Competitive Rivalry
5 MARKET SEGMENTATION
5.1 Type
5.1.1 Electrostatic Precipitators (ESP)
5.1.2 Flue Gas Desulfurization (FGD) and Scrubbers
5.1.3 Selective Catalytic Reduction (SCR)
5.1.4 Fabric Filters
5.1.5 Others
5.2 Application
5.2.1 Power Generation Industry
5.2.2 Cement Industry
5.2.3 Chemicals and Fertilizers
5.2.4 Iron and Steel Industry
5.2.5 Automotive Industry
5.2.6 Oil & Gas Industry
5.2.7 Other Applications
5.3 Emissions (Qualitative Analysis only)
5.3.1 Nitrogen Oxides (NOx)
5.3.2 Sulphur Oxides (SO2)
5.3.3 Particulate Matter (PM)
5.4 Geography
5.4.1 United States
5.4.2 Canada
5.4.3 Mexico
6 COMPETITIVE LANDSCAPE
6.1 Mergers and Acquisitions, Joint Ventures, Collaborations, and Agreements
6.2 Strategies Adopted by Leading Players
6.3 Company Profiles
6.3.1 Babcock & Wilcox Enterprises Ltd
6.3.2 Ducon Technologies Inc
6.3.3 General Electric Company
6.3.4 Pollution Systems
6.3.5 LDX Solutions
6.3.6 CECO Environmental Corporation
6.3.7 FuelTech Inc
6.3.8 Thermo Fisher Scientific Inc.
6.3.9 Tri-Mer Corporation
6.3.10 Sly Inc
7 MARKET OPPORTUNITIES AND FUTURE TRENDS
7.1 Significant Opportunities in the Cement and Steel Industry