US Reverse Logistics - Market Share Analysis, Industry Trends & Statistics, Growth Forecasts (2025 - 2030)
상품코드:1683220
리서치사:Mordor Intelligence
발행일:2025년 03월
페이지 정보:영문
라이선스 & 가격 (부가세 별도)
ㅁ Add-on 가능: 고객의 요청에 따라 일정한 범위 내에서 Customization이 가능합니다. 자세한 사항은 문의해 주시기 바랍니다.
ㅁ 보고서에 따라 최신 정보로 업데이트하여 보내드립니다. 배송기일은 문의해 주시기 바랍니다.
한글목차
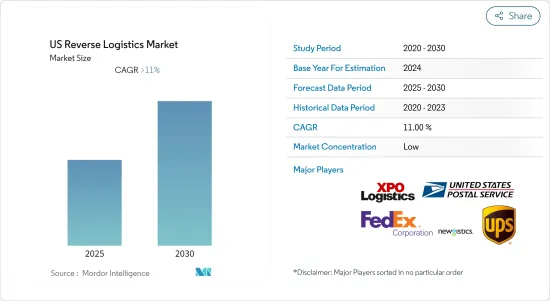
미국의 역물류 시장은 예측 기간 동안 11% 이상의 CAGR을 기록할 것으로 예상됩니다.
주요 하이라이트
온라인 쇼핑과 판매는 계속해서 빠른 속도로 성장하고 있습니다. 소매업체와 배송업체는 점점 더 많은 수의 아웃바운드 패키지를 이동함에 따라 증가하는 반품 물량 문제도 해결해야 합니다. 2017년에는 약 1,200억 달러의 전자상거래 구매 상품이 반품되었습니다. 온라인에서 구매한 상품은 일반 오프라인 매장에서 구매한 상품보다 반품될 가능성이 3배 더 높습니다. 반품은 소매상에게 어려움을 주지만, 고객들은 점점 더 반품을 온라인 쇼핑 경험의 중요한 부분으로 인식하고 있기 때문에 반품을 제한하기가 어렵습니다. 빠르고 무료이며 친절한 반품에 대한 평판은 고객 충성도를 높일 수 있는 반면, 열악한 반품 경험은 고객을 쉽게 이탈시킬 수 있습니다. 포장 폐기물을 제외하고도 50억 파운드 상당의 반품이 매립지에 버려지는 상황에서 소매업체들은 역공급망의 지속가능성을 높이기 위해 고심하고 있습니다. 관련 비용을 관리하고 고객 경험을 개선하기 위해 소매상들은 여러 가지 전략을 시도하고 있습니다. 기존 오프라인 매장을 보유한 소매상들은 옴니채널 반품을 도입하여 기존 오프라인 매장에서 온라인 구매를 반품할 수 있도록 허용하기 시작했습니다. 자동 택배 보관함, 스마트폰 앱과 같은 새로운 기술은 더욱 원활한 반품 환경을 조성하고 있습니다. 그러나 소매업체들은 여전히 반품을 극복해야 할 중요한 과제로 인식하고 있으며, 역물류 업계의 모든 업체에게 혁신의 기회를 창출하는 비용 센터로 인식하고 있습니다.
역물류는 정방향 물류보다 더 복잡합니다. 소매업체는 새로운 효율성을 창출하고 비용을 절감하는 배송업체를 원합니다. 업계 설문조사에 따르면 온라인 쇼핑객의 60%가 무료 반품이 좋은 반품 경험의 필수 요소라고 답했습니다.
미국의 자동차 산업은 2018년 1,730만 대의 판매량을 기록하여 업계 예상을 뛰어넘는 실적을 달성했습니다. 미국 자동차 및 자동차 부품 산업에서 역물류 비용은 상당합니다.
또한 기업들은 역물류, 주문 처리, 재고 관리, 유통, 라벨링 및 포장과 같은 비전통적인 물류 요구 사항을 아웃소싱하고자 합니다. 이는 물류 서비스 제공업체(LSP)에게 더 많은 기회를 제공할 것으로 예상됩니다.
미국의 역물류 시장 동향
전자상거래와 기술의 성장이 효율적인 역물류 수요를 촉진
전자상거래의 급속한 성장은 미국의 정방향 물류 및 역물류의 주요 촉인요인 중 하나입니다. 2017년 미국의 온라인 소매 판매액은 4,535억 달러로 2016년 3,900억 달러에서 16%의 성장률을 기록했습니다. 오프라인 소매점 매출은 3.4% 증가했습니다. 2017년 온라인 소매 판매는 전체 소매 판매의 8.9%를 차지했습니다. 전자상거래의 지속적인 급증은 반품 건수의 증가를 촉진했습니다. 전자상거래가 소매 시장에서 차지하는 비중이 커짐에 따라 전체 소매 반품률, 특히 배송을 통한 반품률이 계속 증가하여 전체 역공급망에 압력을 가할 수 있습니다.
기술은 역공급망의 다른 부문에서도 중요한 역할을 하고 있습니다. 인기 있는 소프트웨어 제공업체 중 하나인 Optoro는 과거 가격과 개별 제품 데이터를 결합하여 각 반품 품목을 재판매, 청산, 수리, 재활용 등 가장 수익성이 높은 처분 경로로 보내야 하는 위치를 알려주는 알고리즘을 기업에 제공합니다. Optoro는 스마트 라우팅이 반품 재고의 수익성을 크게 향상시킨다고 주장합니다.
옴니채널 반품에 대한 인기 증가
또 다른 성장 추세는 옴니채널 반품으로, 판매자는 소비자가 오프라인 매장에서 온라인 상품을 반품할 수 있도록 함으로써 더욱 편리하게 반품할 수 있도록 하고 있습니다. BORIS 반품(온라인 구매 후 매장 내 반품)은 판매자의 퍼스트마일 반품 배송 비용을 절감할 뿐만 아니라 추가 구매를 유도합니다. UPS 설문조사에 따르면 온라인 쇼핑객의 66%가 오프라인 매장에서 반품할 때 새로운 구매를 한 반면, 온라인에서 반품할 때는 44%에 그쳤습니다. 소매업체에 더 유리할 뿐만 아니라 전자상거래 쇼핑객의 58%는 우편으로 반품하는 것보다 오프라인 매장에서 반품하는 것을 선호했습니다. 또한 이러한 선호에도 불구하고 쇼핑객들은 전자상거래 반품을 매장으로 가져오는 것보다 배송을 선호할 가능성이 훨씬 더 높습니다. 또한 배송업체들은 인구 밀집 지역에 물리적 접근 지점을 확대하고 있습니다. 최근 월그린은 7,500개 매장에서 FedEx 패키지 픽업 및 배송 서비스를 제공하기로 합의했습니다. UPS 액세스 포인트는 세탁소, 편의점 등 4,000여 곳의 네트워크를 통해 서비스를 제공합니다. 해피 리턴즈는 쇼핑몰이나 매장의 키오스크에서 분실된 반품 물품을 수거하고 집하하는 스타트업입니다. 온라인 전용 소매업체에 반품 수거를 위한 물리적 채널을 제공합니다. 소매업체는 배송비를 절약하고, 고객은 즉시 환불을 받을 수 있으며, 상품을 포장하는 번거로움을 피할 수 있고, 쇼핑몰은 추가 유동인구를 확보할 수 있습니다.
미국의 역물류 산업 개요
미국의 역물류 시장 환경은 전자상거래 부문의 수요 증가와 첨단 기술의 발전으로 경쟁이 치열해지고 있습니다. 소매업체들은 효율적인 역물류 운영을 위해 점점 더 3자 물류(3PL) 제공업체에 의존하고 있습니다. 물류 회사는 반품 문제를 해결할 수 있는 좋은 위치에 있습니다. 이러한 기업은 자본, 규모, 전문성을 활용하여 상품이 역공급망을 통해 이동할 때 소매업체가 흔히 겪는 문제를 해결할 수 있습니다. 이러한 시나리오는 기존 업체뿐만 아니라 신규 업체들도 역물류에 더욱 집중하도록 유도하여 시장의 경쟁력을 높이고 있습니다. 기업들이 경쟁 우위를 확보하기 위한 새로운 방법을 모색하는 가운데, 종종 간과되는 반품 기능이 잠재적인 원천이 될 수 있습니다. 반품 관리에 더 많은 관심을 기울이는 기업은 보다 효율적이고 일관되며 신속한 고객 경험을 제공하고, 비용 절감은 물론 서비스와 수익성을 향상시키는 이점을 얻을 수 있을 것으로 기대됩니다.
기타 혜택
엑셀 형식 시장 예측(ME) 시트
3개월간의 애널리스트 지원
목차
제1장 서론
시장 범위
시장의 정의
주요 요약
제2장 조사 방법
조사의 성과
조사의 전제
분석 방법
조사 단계
제3장 시장 인사이트
현재의 시장 시나리오
기술 동향 및 자동화(신흥 스타트업에 대한 심층 분석)
변화하는 소비자 행동과 선호도에 대한 연구
스포트라이트 : 미국의 전자상거래 산업(현재 시나리오, 동향, 전망)
반품 비용이 소매업에 미치는 영향 : 분석가의 견해
자동차의 역물류와 애프터마켓에 관한 개요
새로운 옴니채널 반품의 리뷰와 해설
폐쇄 루프 공급망에 대한 통찰
제4장 시장 역학
성장 촉진요인
억제요인
기회
Porter's Five Forces 분석
산업 밸류체인 분석
제5장 시장 세분화
기능별
운송
도로
항공
기타 운송 수단
보관업(보관, 유통, 통합)
기타 부가가치 서비스(반품 처리, 재입고, 개조, 처분 등)
최종 사용자별
소비재 및 소매(전자상거래, 소비자 전자제품, 의류 등)
자동차
의료 및 의약품
기타 산업 활동 부문
기타
제6장 경쟁 구도
M&A, 합작사업, 제휴, 협정
시장 집중 개요
주요 기업의 전략
제7장 기업 프로파일
United Parcel Service(UPS)
FedEx Corporation
United States Postal Service(USPS)
XPO Logistics
Newgistics Inc.
Happy Returns Inc.
American Distribution Inc.
DHL
FW Logistics
YRC Worldwide Inc.
DGD Transport
A2B Fulfillment
Optoro
CH Robinson Worldwide Inc.
Yusen Logistics
Excelsior Integrated LLC
제8장 밸류체인의 기타 주요 기업별 통찰
제9장 부록
경제 통계 : 운송 및 보관 부문, 경제 기여도
미국의 주요 반품 제품에 대한 통찰
포워드 물류에 관한 정성적, 정량적 통찰
소매업의 GDP 점유율
전자상거래 매출액이 GDP에 차지하는 비율
제10장 면책사항
HBR
영문 목차
영문목차
The US Reverse Logistics Market is expected to register a CAGR of greater than 11% during the forecast period.
Key Highlights
Online shopping and sales continue to grow at a rapid pace. As retailers and delivery companies move increasing numbers of outbound packages, they must also address the issue of rising volume of return goods. Around USD 120 billion of e-commerce purchases were returned in 2017. Online purchased goods are three times more likely to be returned than those made in a general physical store. Though returns pose challenges for retailers, they find it challenging to limit returns because customers increasingly see returns as a critical part of online shopping experience. The reputation for fast, free, and friendly returns can earn customer loyalty, while a poor return experience can easily drive them away. With GBP 5 billion worth of returns ending up in landfills, apart from the waste from packaging, retailers are also struggling to make their reverse supply chains highly sustainable. To control the associated costs and improve customer experience, retailers are trying several strategies. Retailers with an existing physical presence have started embracing omnichannel returns, allowing returns of online purchases at existing physical stores. Emerging technologies, such as automated parcel lockers, and smartphone apps, are creating a more seamless return experience. However, retailers still see returns as a significant challenge to be overcome, and as a cost center, which has created opportunities for innovation for all players in the reverse logistics industry.
Reverse logistics is more complicated than forward logistics. Retailers want shipping companies that create new efficiencies and cut costs. According to an industry survey, 60% of active online shoppers say that free returns are a vital part of a good returns experience.
The US auto industry recorded the sales of 17.3 million vehicles in 2018, beating the industry expectations. Reverse logistics cost in the US auto and auto components industry is significant.
Additionally, companies are looking to outsource non-traditional logistics requirements, such as reverse logistics, order processing, inventory management, distribution, and labeling and packaging. This is expected to provide more opportunities for logistics service providers (LSPs).
US Reverse Logistics Market Trends
Growth in E-commerce and Technology Propels the Demand for Efficient Return Logistics
The rapid growth in e-commerce is one of the major drivers of the forward and reverse logistics in the United States. In 2017, the online retail sales in the United States reached USD 453.5 billion, registering a growth rate of 16%, from USD 390 billion in 2016. The physical retail stores sales increased by 3.4%. The online retail sales accounted for 8.9% of the total retail sales, in 2017. The continuing surge of e-commerce was fueling a rise in the number of packages returned. As e-commerce grabs a greater share of the retail market, the overall retail return rate may continue to climb, especially the rate of goods returned via shipping, adding pressure to the entire reverse supply chain.
Technology is also playing a crucial role in other segments of the reverse supply chain. One popular software provider is Optoro, which combines historical pricing and individual product data into an algorithm that tells companies where they should route each return item, to the most profitable disposition path for a return, i.e., resale, liquidation, repair, recycling, or something else. Optoro claims that its smart routing dramatically improves the profitability of returned inventory.
Growing Popularity for Omnichannel Returns
Another growing trend is the omnichannel returns, in which merchants are making returns more convenient, by allowing consumers to return online items in physical locations. BORIS returns (buy online and return in store) not only save merchants the cost of first-mile return shipping, but also encourage additional purchases. According to a UPS survey, 66% of online shoppers made a new purchase when returning in store, compared to 44% when returning online. In addition to being better for retailers, 58% of e-commerce shoppers preferred to make returns at brick-and-mortar stores rather than mail them. Moreover, despite this preference, the shoppers are much more likely to ship their e-commerce returns than bring them to a store. Delivery companies are also expanding physical access points in high-population areas. Recently, Walgreens agreed to provide FedEx package pickup and delivery service at 7,500 stores. UPS Access Point offers services through a network of 4,000 locations, such as dry cleaners and convenience stores. Happy Returns is a startup that collects and aggregates loose return items at kiosks in malls or stores. It provides online-only retailers with a physical channel for collecting returns. Retailers save on shipping, customers get their refunds immediately and avoid the hassle of packing their item, and malls get additional foot traffic.
US Reverse Logistics Industry Overview
The reverse logistics market landscape of the United States is becoming highly competitive, with increasing demand from the e-commerce sector and evolution of advanced technologies. Retailers are increasingly turning toward third-party logistics (3PL) providers, to help them establish efficient reverse logistics operations. Logistics firms are well positioned to solve returns issues. These companies can take advantage of their capital, and scale and expertise to solve pain points commonly experienced by retailers, as goods move through the reverse supply chain. This scenario is attracting existing, as well as new player, to focus more on return logistics, thus making the market more competitive. As organizations seek new ways to gain competitive advantage, the often-overlooked returns function can be a potential source. Businesses that pay more attention to returns management are expected to obtain the benefits of delivering a more efficient, consistent, and responsive customer experience, and operate to cut costs, as well as enhance service and profitability.
Additional Benefits:
The market estimate (ME) sheet in Excel format
3 months of analyst support
TABLE OF CONTENTS
1 INTRODUCTION
1.1 Scope of the Market
1.2 Market Definition
1.3 Executive Summary
2 RESEARCH METHODOLOGY
2.1 Study Deliverables
2.2 Study Assumptions
2.3 Analysis Methodology
2.4 Research Phases
3 MARKET INSIGHTS
3.1 Current Market Scenario
3.2 Technological Trends and Automation (In-depth Focus on Emerging Startups)
3.3 Study on Changing Consumer Behavior and Their Preferences
3.4 Spotlight - US E-commerce Industry (Current Scenario, Trends, and Outlook)
3.5 Impact of Cost of Returns on Retailers - Analyst's View
3.6 Brief on Automotive Reverse Logistics and Aftermarket
3.7 Review and Commentary on Emerging Omnichannel Returns
3.8 Insights on Closed-loop Supply Chain
4 MARKET DYNAMICS
4.1 Drivers
4.2 Restraints
4.3 Opportunities
4.4 Porter's Five Forces Analysis
4.5 Industry Value Chain Analysis
5 MARKET SEGMENTATION
5.1 By Function
5.1.1 Transportation
5.1.1.1 Road
5.1.1.2 Air
5.1.1.3 Other Modes of Transportation
5.1.2 Warehousing (Storage, Distribution, and Consolidation)
5.1.3 Other Value-added Services (Return Processing, Restocking, Refurbishment, Disposition, etc.)
5.2 By End User
5.2.1 Consumer and Retail (Covers E-commerce, Consumer Electronics, Apparel and Garment Sectors, etc.)
5.2.2 Automotive
5.2.3 Healthcare and Pharmaceuticals
5.2.4 Other Industrial Activity Sectors
5.2.5 Other End Users
6 COMPETITIVE LANDSCAPE
6.1 Mergers and Acquisitions, Joint Ventures, Collaborations, and Agreements
6.2 Market Concentration Overview
6.3 Strategies Adopted by Major Players
7 COMPANY PROFILES
7.1 United Parcel Service (UPS)
7.2 FedEx Corporation
7.3 United States Postal Service (USPS)
7.4 XPO Logistics
7.5 Newgistics Inc.
7.6 Happy Returns Inc.
7.7 American Distribution Inc.
7.8 DHL
7.9 FW Logistics
7.10 YRC Worldwide Inc.
7.11 DGD Transport
7.12 A2B Fulfillment
7.13 Optoro
7.14 C.H. Robinson Worldwide Inc.
7.15 Yusen Logistics
7.16 Excelsior Integrated LLC
8 INSIGHTS ON OTHER KEY PLAYERS IN THE VALUE CHAIN
9 APPENDIX
9.1 Economic Statistics - Transport and Storage Sector, Contribution to Economy
9.2 Insights on Key Products Returned in the United States
9.3 Qualitative and Quantitative Insights on Forward Logistics