남미의 폴리에틸렌 테레프탈레이트(PET) 시장 : 시장 점유율 분석, 산업 동향, 성장 예측(2025-2030년)
South America Polyethylene Terephthalate (PET) - Market Share Analysis, Industry Trends & Statistics, Growth Forecasts (2025 - 2030)
상품코드:1683146
리서치사:Mordor Intelligence
발행일:2025년 03월
페이지 정보:영문
라이선스 & 가격 (부가세 별도)
ㅁ Add-on 가능: 고객의 요청에 따라 일정한 범위 내에서 Customization이 가능합니다. 자세한 사항은 문의해 주시기 바랍니다.
ㅁ 보고서에 따라 최신 정보로 업데이트하여 보내드립니다. 배송기일은 문의해 주시기 바랍니다.
한글목차
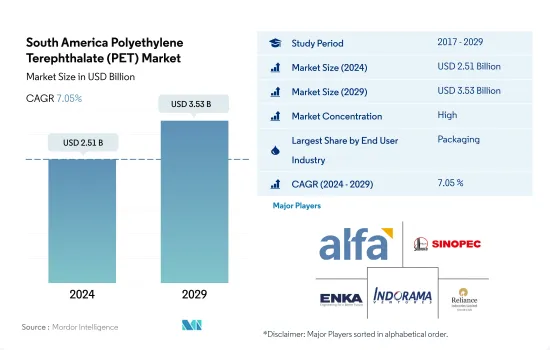
남미의 폴리에틸렌 테레프탈레이트(PET) 시장 규모는 2024년에 25억 1,000만 달러로 추정되고, 2029년에는 35억 3,000만 달러에 이를 것으로 예측되며, 예측기간 2024년부터 2029년까지 CAGR은 7.05%로 성장할 전망입니다.
라이프 스타일 변화 및 소매 대응 포장 성장이 시장 수요를 뒷받침
남미의 폴리에틸렌 테레프탈레이트 시장은 PET 소비량으로 세계 4위입니다. 이 산업은 2021년에 비해 2022년에는 금액 기준으로 8.72%의 성장을 기록했습니다.
포장 산업은 PET 수지의 가장 큰 소비자입니다. 소비자의 기호가 편의식품과 온더고의 라이프스타일로 크게 쉬프트하고 있는 것, 소매 대응 포장 증가로 2022년의 연간 성장률은 전년대비 8.75%(금액 기준)를 기록했습니다. 이것은 포장 재료 수요를 밀어 올리고 있습니다. 예를 들어, 이 지역의 플라스틱 포장 생산량은 2021년 5,816킬로톤에 비해 2022년 6,069킬로톤으로 증가했습니다.
시장은 예측기 2023년부터 2029년까지 금액 기준으로 7.08%의 연평균 복합 성장률(CAGR)을 나타낼 것으로 예측되고 있으며, 예측 기간 중에 금액 기준으로 8.44%로 가장 높은 CAGR을 기록한 것은 전기 및 전자산업입니다. 첨단 재료 사용, 유기 전자, 소형화, 5G, 인공지능(AI), 사물인터넷(IoT) 등 파괴적 기술 등의 동향은 스마트한 제조 프랙티스를 가능하게 하고, 산업의 촉진요인으로서 기능할 것으로 예상됩니다.
포장 산업은 두 번째로 급성장하는 산업입니다. 이는 각국 정부가 플라스틱이 없는 법규를 시행하고 소매업체와 소비자 브랜드가 완전히 재활용 가능한 소재인 PET 폴리머와 같은 지속 가능한 포장을 선택할 수밖에 없기 때문입니다. 포장재 생산량은 2022년 6,069킬로톤에서 2029년 8,553킬로톤에 이를 것으로 예상됩니다. 따라서 플라스틱 포장의 생산량 증가는 예측 기간 동안 시장을 견인할 것으로 예상됩니다.
예측 기간 동안에도 브라질이 우위를 유지합니다.
PET는 음식, 편의점 규모의 청량 음료, 물, 코일 폼, 전기 밀봉, 전기 장비, 스마트 미터 포장 등 포장 및 전기 및 전자 부문에서 광범위한 용도가 있습니다. 남미는 2022년 세계 PET 수지 소비량의 9.17%를 금액 기준으로 차지했습니다.
브라질은 이 지역 최대의 PET 수지 소비국이며, 급성장하고 있으며 예측 기간중의 점유율은 66.63%로 가장 높고, CAGR은 금액 베이스에서도 수량 베이스에서 7.21%입니다. 이 성장은 포장, 전기, 전자 및 산업기계 산업의 성장 때문입니다. 연질 플라스틱 포장 수요는 경량 제품의 사용, 전자상거래 성장, 지속가능성의 중요성, 이 지역의 주요 소비자 제품 제조업체의 채용률이 증가함에 따라 증가하고 있습니다. 이 나라의 전자상거래 시장 매출은 2023년 538억 6,000만 달러에서 2027년 946억 3,000만 달러에 이를 것으로 예측됩니다. 포장 시장의 성장은 예측 기간 동안 PET 수지 수요를 촉진할 것으로 예상됩니다.
아르헨티나의 PET 수지 수요는 포장과 전기 및 전자 산업의 성장에 의해 크게 증가하고 있습니다. 스마트폰, 노트북, 컴퓨터, 카메라, 텔레비전 등 기술적으로 선진적 소비자용 전자기기나 전자제품 수요가 급증하고 있기 때문에 향후 수년간은 소비자용 전자기기 수요가 높아질 것으로 예상됩니다. 2023년 20억 달러에서 2027년에는 34억 달러에 이를 것으로 예상됩니다. 그 결과, 동국에서의 전기 및 전자 시장의 성장이, 장래에 PET 수지 수요를 견인할 것으로 예측됩니다.
남미의 폴리에틸렌 테레프탈레이트(PET) 시장 동향
기술 혁신의 급속한 속도가 산업 성장을 뒷받침
남미에서는 2017년 브라질이 이 지역의 전기 및 전자 제품 생산 수입의 40%에 가까운 주요 점유율을 차지했습니다. 2017년 브라질의 전자 제품은 전자상거래 부문에서 20% 가까운 보급률을 보였습니다. 이 지역의 기술 발전은 스마트 TV, 스마트 냉장고, 스마트 에어컨 및 기타 전기 및 전자 제품과 같은 소비자 전자 제품에 대한 수요를 증가 시켰습니다. 남미의 전기 및 전자 제품 생산 수입은 2017년부터 2019년까지 6.16% 이상의 CAGR을 기록했습니다.
2020년 팬데믹에 의한 리모트 워크 및 홈 엔터테인먼트용 소비자용 전자기기 제품 수요 증가에 따라 이 지역의 전기 및 전자 제품 생산은 전년 대비 매출 성장률 1.1%로 증가했습니다. 가처분 소득 증가, 고급품에 대한 수요 증가, 기술의 진보, 생활 수준의 향상은 전기 및 전자 기기 시장의 성장을 촉구하는 주요인 중 하나입니다. 그 결과 이 지역에서는 2021년 전기 및 전자기기 생산도 매출액에서 14.9%의 비율로 증가했습니다.
전자기술 혁신의 급속한 페이스는 보다 새롭고 빠른 전기 및 전자제품에 대한 일관된 수요를 촉진하고 있습니다. 그 결과 이 지역의 전기 및 전자기기 생산 수요도 증가하고 있습니다. LG, Samsung, Microsoft, Panasonic, Dell, Intel, Toshiba Corporation, Sony, Philips, Sharp, Apple, Lenovo 등 다국적 기업의 진출도 전기 및 전자기기 시장에 긍정적인 영향을 미치고 있습니다. 이러한 모든 요인은 예측기간 동안 이 지역의 전기 및 전자기기 생산고를 7% 전후의 비율로 밀어올릴 것으로 예상됩니다.
남미의 폴리에틸렌 테레프탈레이트(PET) 산업 개요
남미의 폴리에틸렌 테레프탈레이트(PET) 시장은 상당히 통합되어 있으며 상위 5개 기업이 100%를 차지하고 있습니다. 이 시장의 주요 기업은 Alfa SAB de CV, China Petroleum & Chemical Corporation, Enka, Indorama Ventures Public Company Limited, Reliance Industries Limited입니다.
기타 혜택
엑셀 형식 시장 예측(ME) 시트
3개월의 애널리스트 서포트
목차
제1장 주요 요약 및 주요 조사 결과
제2장 보고서 제안
제3장 서문
조사 전제조건 및 시장 정의
조사 범위
조사 방법
제4장 주요 산업 동향
최종 사용자 동향
항공우주
자동차
건축 및 건설
전기 및 전자
포장
수출입 동향
폴리에틸렌 테레프탈레이트(PET) 무역
가격 동향
형태 동향
재활용 개요
폴리에틸렌 테레프탈레이트(PET)의 재활용 동향
규제 프레임워크
아르헨티나
브라질
밸류체인 및 유통채널 분석
제5장 시장 세분화
최종 사용자 산업별
자동차
건축 및 건설
전기 및 전자
공업 및 기계
포장
기타
국가별
아르헨티나
브라질
기타 남미
제6장 경쟁 구도
주요 전략 동향
시장 점유율 분석
기업 상황
기업 프로파일(세계 수준 개요, 시장 수준 개요, 주요 비즈니스 부문, 재무, 직원 수, 주요 정보, 시장 순위, 시장 점유율, 제품 및 서비스, 최근 동향 분석 포함).
Alfa SAB de CV
China Petroleum & Chemical Corporation
Enka
Far Eastern New Century Corporation
Formosa Plastics Group
Indorama Ventures Public Company Limited
Reliance Industries Limited
SABIC
제7장 CEO에 대한 주요 전략적 질문
제8장 부록
세계 개요
개요
Porter's Five Forces 분석 프레임워크(산업 매력도 분석)
세계의 밸류체인 분석
시장 역학(DROs)
정보원 및 참고문헌
도표 일람
주요 인사이트
데이터 팩
용어집
AJY
영문 목차
영문목차
The South America Polyethylene Terephthalate (PET) Market size is estimated at 2.51 billion USD in 2024, and is expected to reach 3.53 billion USD by 2029, growing at a CAGR of 7.05% during the forecast period (2024-2029).
Changing lifestyles and the growth of retail-ready packaging to aid market demand
The South American polyethylene terephthalate market ranks fourth globally in the consumption of PET. The industry registered a growth of 8.72%, by value, in 2022 compared to 2021.
The packaging industry is the largest consumer of PET resin. It registered an annual growth rate of 8.75%, by value, in 2022 compared to the previous year, owing to a significant shift in consumer preferences toward convenience foods and on-the-go lifestyles, as well as the growth of retail-ready packaging. This is driving the demand for packaging materials. For instance, plastic packaging production in the region increased to 6,069 kilotons in 2022 compared to 5,816 kilotons in 2021.
The market is expected to register a CAGR of 7.08%, by value, during the forecast period (2023-2029), with the electrical and electronics industry reporting the highest CAGR of 8.44%, by value, during the forecast period. Trends like using advanced materials, organic electronics, miniaturization, and disruptive technologies like 5G, artificial intelligence (AI), and the Internet of Things (IoT), are expected to enable smart manufacturing practices and act as growth drivers for the industry.
The packaging industry is the second-fastest-growing industry. It is projected to register a CAGR of 7.07%, by value, during the forecast period owing to governments implementing plastic-free legislation, forcing retailers and consumer brands to move toward sustainable packaging choices like PET polymer as it is a fully recyclable material. Packaging production volume is expected to reach 8,553 kilotons by 2029 from 6,069 kilotons in 2022. Thus, the growth in plastic packaging production is expected to drive the market during the forecast period.
Brazil to remain dominant during the forecast period
PET has a wide range of applications in packaging and electrical and electronics, such as packaging foods and beverages, convenience-sized soft drinks, water, coil forms, electrical encapsulations, electrical devices, and smart meters. South America accounted for 9.17% of the global PET resin consumption in 2022 by value.
Brazil is the region's largest and fastest-growing consumer of PET resin, with the highest share of 66.63% and a CAGR of 7.21% in terms of value and volume during the forecast period. This growth is due to its growing packaging, electrical and electronics, and industrial machinery industries. The demand for flexible plastic packaging is increasing due to the usage of lightweight products, e-commerce growth, emphasis on sustainability, and higher adoption rates among major consumer product manufacturers in the region. The country's e-commerce market is projected to reach a revenue of USD 94.63 billion in 2027 from USD 53.86 billion in 2023. The growing packaging market is projected to drive the demand for PET resins during the forecast period.
The demand for PET resin in Argentina is increasing significantly due to the growing packaging and electrical and electronics industries. The surging demand for technologically advanced consumer electronics and appliances, such as smartphones, laptops, computers, cameras, and televisions, is expected to boost the demand for consumer electronics in the coming years. The sales of consumer electronics in the country are projected to reach a revenue of USD 3.4 billion in 2027 from USD 2.0 billion in 2023. As a result, the growing electrical and electronics market in the country is projected to drive the demand for PET resin in the future.
South America Polyethylene Terephthalate (PET) Market Trends
Rapid pace of technological innovations to boost the industry growth
In South America, Brazil held the major share of nearly 40% of the region's electrical and electronics production revenue in 2017. In 2017, Brazilian electronics products had a penetration of nearly 20% in the e-commerce sector. The advancement of technology in the region increased the demand for consumer electronics products, such as smart TVs, smart refrigerators, smart air conditioners, and other electrical and electronic products. South American electrical and electronics production revenue witnessed a CAGR of over 6.16% between 2017 and 2019.
In 2020, with the rise in demand for consumer electronics for remote working and home entertainment due to the pandemic, the production of electrical and electronic products in the region increased at a growth rate of 1.1% by revenue compared to the previous year. Rising disposable income, increased demand for luxury products, technological advancements, and improvement in living standards are some of the major factors driving the electrical and electronics market's growth. As a result, in the region, electrical and electronics production also increased at a rate of 14.9% by revenue in 2021.
The rapid pace of electronic technological innovation is driving consistent demand for newer and faster electrical and electronic products. As a result, it has also increased the demand for the production of electrical and electronics in the region. The penetration of multinational companies, like LG, Samsung, Microsoft, Panasonic, Dell, Intel, Toshiba, Sony, Philips, Sharp, Apple, and Lenovo, also positively affects the electrical and electronics market. All such factors are expected to fuel the production revenue of electrical and electronics in the region during the forecast period at a rate of around 7%.
South America Polyethylene Terephthalate (PET) Industry Overview
The South America Polyethylene Terephthalate (PET) Market is fairly consolidated, with the top five companies occupying 100%. The major players in this market are Alfa S.A.B. de C.V., China Petroleum & Chemical Corporation, Enka, Indorama Ventures Public Company Limited and Reliance Industries Limited (sorted alphabetically).
5 MARKET SEGMENTATION (includes market size in Value in USD and Volume, Forecasts up to 2029 and analysis of growth prospects)
5.1 End User Industry
5.1.1 Automotive
5.1.2 Building and Construction
5.1.3 Electrical and Electronics
5.1.4 Industrial and Machinery
5.1.5 Packaging
5.1.6 Other End-user Industries
5.2 Country
5.2.1 Argentina
5.2.2 Brazil
5.2.3 Rest of South America
6 COMPETITIVE LANDSCAPE
6.1 Key Strategic Moves
6.2 Market Share Analysis
6.3 Company Landscape
6.4 Company Profiles (includes Global Level Overview, Market Level Overview, Core Business Segments, Financials, Headcount, Key Information, Market Rank, Market Share, Products and Services, and Analysis of Recent Developments).
6.4.1 Alfa S.A.B. de C.V.
6.4.2 China Petroleum & Chemical Corporation
6.4.3 Enka
6.4.4 Far Eastern New Century Corporation
6.4.5 Formosa Plastics Group
6.4.6 Indorama Ventures Public Company Limited
6.4.7 Reliance Industries Limited
6.4.8 SABIC
7 KEY STRATEGIC QUESTIONS FOR ENGINEERING PLASTICS CEOS
8 APPENDIX
8.1 Global Overview
8.1.1 Overview
8.1.2 Porter's Five Forces Framework (Industry Attractiveness Analysis)