유럽의 건설용 화학제품 시장 : 시장 점유율 분석, 산업 동향 및 통계, 성장 예측(2025-2030년)
Europe Construction Chemicals - Market Share Analysis, Industry Trends & Statistics, Growth Forecasts (2025 - 2030)
상품코드:1683091
리서치사:Mordor Intelligence
발행일:2025년 03월
페이지 정보:영문
라이선스 & 가격 (부가세 별도)
ㅁ Add-on 가능: 고객의 요청에 따라 일정한 범위 내에서 Customization이 가능합니다. 자세한 사항은 문의해 주시기 바랍니다.
ㅁ 보고서에 따라 최신 정보로 업데이트하여 보내드립니다. 배송기일은 문의해 주시기 바랍니다.
한글목차
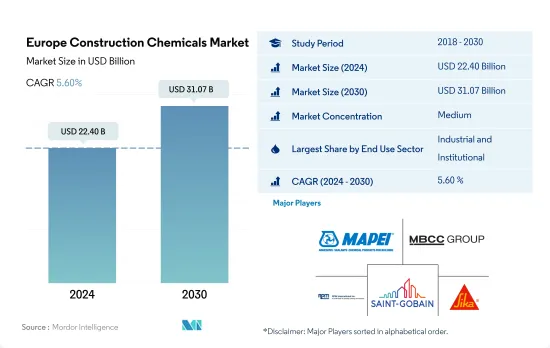
유럽의 건설용 화학제품 시장 규모는 2024년에 224억 달러로 평가되었고, 2030년에는 310억 7,000만 달러에 이를 전망이며, 예측 기간중 2024년부터 2030년까지 CAGR 5.60%를 나타낼 것으로 예측됩니다.
산업 및 상업 부문의 건설 투자 증가로 건설용 화학제품 물품 수요 견인
2023년까지 유럽이 세계 건설용 화학제품 시장의 약 24.99%에 해당하는 큰 점유율을 차지할 것으로 예상됩니다. 2022년 유럽의 건설용 화학제품 시장은 주로 상업, 산업 및 시설 건설 분야 수요 증가에 견인되어 금액 기준으로 6.15%의 성장을 이루었습니다.
2022년에 약 35.55%의 점유율을 차지하는 산업 및 시설 건설 부문은 이 지역 시장에서 건설용 화학제품의 최대 소비자로 부상했습니다. 이 부문의 신설 바닥 면적은 2023년 대비 증가하여 2030년에는 2억 4,500만 평방 피트에 달할 것으로 예측되고 있습니다. 이 급증은 유럽 각국의 산업, 교육 및 의료 건설에 대한 투자 증가로 인한 것입니다. 이 지역의 산업 및 시설 부문을 대상으로 한 건축 화학 시장은 도시화 및 산업화 등의 요인에 따라 2023년 74억 8,000만 달러에서 2030년에는 104억 4,000만 달러로 성장할 것으로 예측됩니다.
이 지역의 상업 건설 부문은 건설용 화학제품의 소비자로 가장 빠르게 성장하고 있으며 예측 기간 동안 CAGR은 6.10%로 예측됩니다. 이 지역의 경제 확대는 사무실, 호텔 및 소매 쇼핑몰을 포함한 상업시설 수요를 촉진합니다. 이 부문의 신규 바닥 면적은 2023년 대비 2030년까지 3억 9,400만 평방 피트 증가할 것으로 예상됩니다. 이러한 개발에 견인되어 이 부문을 위한 유럽의 건축용 화학제품 시장은 2023년부터 2030년까지 23억 6,000만 달러 증가가 전망되고 있습니다.
이탈리아에서는 산업 건설에 대한 투자 증가로 건설용 화학제품 수요가 높아질 것으로 예상됩니다.
콘크리트 혼화제, 방수 솔루션, 접착제 및 실란트, 앵커 및 그라우트, 바닥재용 수지를 포함한 건설용 화학제품은 건물과 구조물의 기능을 향상시킵니다. 2022년 유럽의 건설용 화학제품 시장 규모는 전년대비 6.15% 증가했습니다. 유럽 연합(EU)은 2022년 1조 5,550억 달러를 건설 프로젝트에 할당했으며, EU의 건설 주도형 GDP 15조 3,750억 달러에 기여했으며 2021년부터 3.5% 증가했습니다. 이러한 투자는 건설 부문을 강화해 건설용 화학제품 수요에 박차를 가했습니다. 2023년 건설용 화학제품 시장은 전년 기세를 이어 금액 기준으로 4.44%의 성장이 예측됩니다.
2022년 건설용 화학제품 시장은 독일이 석권하고 금액 기준으로 17% 시장 점유율을 획득했습니다. 이 나라의 건설 부문은 주로 주택, 토목 및 비주택 프로젝트를 위한 5,200억 달러의 투자를 모았습니다. 건설 활동이 급증함에 따라 건설용 화학제품물질 수요도 이에 따라 2022년 시장 규모는 35억 달러에 달했습니다. 이 시장은 2023년에는 금액 기준으로 3.65% 성장할 것으로 예상되고 있습니다.
이탈리아는 건설용 화학제품 시장에서 가장 높은 CAGR 6.21%를 기록할 전망입니다. 이 성장의 주요 원동력은 산업 건설 부문입니다. 2050년까지 제로 방출을 달성하는 유럽의 기후 목표에 따라 렙솔과 같은 기업은 이탈리아의 신재생 에너지 프로젝트에 5억 5,000만 달러의 투자를 약속합니다. 그 결과, 이탈리아의 산업용 건축의 신규 바닥 면적은 2022년에 비해 2030년까지 1,590만 평방 피트 증가할 것으로 예측되고, 건설용 화학제품에 대한 수요 증가를 시사하고 있습니다.
유럽의 건설용 화학제품 시장 동향
스페인이나 이탈리아 등에서 오피스 빌딩 확대 프로젝트가 유럽 상업 건축 시장을 뒷받침
유럽에서는 2030년 이산화탄소 배출 목표에 따른 에너지 효율적인 오피스 빌딩 건설에 대한 주목이 높아졌고, 2022년 상업 건축의 신규 바닥 면적이 12.70% 급증했습니다. 직원이 사무실 공간으로 돌아오면서 유럽 기업도 이번에는 임대 의사결정을 활발히 하게 되었고, 그 결과 2022년에는 570만 평방 피트의 새로운 사무실 공간이 추가되었습니다. 이 성장은 2023년도 지속될 것으로 예상되며 2022년 대비 2.68%의 성장률이 예측됩니다.
COVID-19의 팬데믹은 상당한 노동력 부족과 자재 부족을 일으켜 몇몇 업무용 건설 프로젝트의 중단과 연기로 이어졌습니다. 그러나 폐쇄가 완화되고 건설활동이 재개되면 유럽에서는 2021년 상업시설의 신설 바닥 면적이 16.60%의 견조한 성장을 보였으며 스페인이 105.05%의 성장률로 선두에 올랐습니다.
유럽의 상업 건축 부문은 상당한 성장을 이루는 태세에 있으며 예측 기간 동안 신설 바닥 면적의 CAGR은 3.88%를 나타낼 것으로 예상됩니다. 이탈리아의 밀라노 미국 총영사관 복합시설(6,500만 달러, 2025년 완성 예정)과 스페인의 Arteixo 오피스 빌딩 확대 공사(2억 6,000만 달러, 180만 평방 피트, 2024년 가동 예정) 등 주목할 만한 프로젝트가 이 지역의 상업 건설 상황을 강화할 것으로 예상됩니다. 소비자 선호도가 온라인 소매에서 대면 소매로 이동하는 동안 유럽 소매 쇼핑몰의 신규 바닥 면적은 2022년에 비해 2030년까지 4억 2,830만 평방 피트 증가할 것으로 예상됩니다.
영국과 유럽에서 합리적인 가격의 주택 계획, 주택 프로젝트의 완성 건수 증가로 주택 건설의 신규 바닥 면적이 증가할 것으로 예상됩니다.
유럽 주택 건설 부문에서는 2022년 신설 바닥 면적이 전년 대비 2.71% 증가했습니다. 이 배경에는 도시화율의 상승이 있어 도시 인구가 2020년의 73.5%에서 2022년에는 75%를 차지했습니다. 이 동향은 2023년도 계속된 것으로 평가되었고, 2022년 대비 3.21% 성장했습니다. EURO CONSTRUCT 네트워크에 따르면 유럽에서는 2023년 주택 프로젝트 완성 건수가 2.7% 증가하여 헝가리, 아일랜드, 노르웨이, 폴란드에서 현저한 증가를 보였습니다.
COVID-19의 유행은 경기 침체로 이어졌고, 그 결과 많은 주택 건설 프로젝트가 중단되거나 연기되었습니다. 그 결과 2020년 유럽의 주택 신축상 면적은 전년 대비 9.40% 감소했습니다. 그러나 시정규제가 완화되고 건설활동이 재개되면 이 분야는 힘차게 회복해 2021년 신설 바닥면적은 2020년 대비 18.28% 급증했습니다. 스페인은 40.23% 증가하고 현저한 성장을 보였으며 이탈리아는 25.07% 증가로 이어졌습니다.
유럽의 주택 신설 바닥 면적은 예측 기간 동안 CAGR 3.89%를 나타낼 것으로 예측됩니다. 이 성장을 선도하는 것은 영국이며 CAGR은 5.94%를 기록합니다. 이 성장의 배경에는 특히 인구 증가와 주택 공급의 한계에 고민하는 도시 지역에서 저렴한 주택에 대한 수요가 높아지고 있습니다. 영국 정부의 어포더블 홈즈 프로그램은 80억 달러의 투자를 배경으로 2026년까지 13만호의 주택을 공급해 국내 주택 건설 바닥 면적을 확대하는 것을 목표로 하고 있습니다.
유럽 건설용 화학제품 산업 개요
유럽 건설용 화학제품 시장은 적당히 통합되어 있으며 상위 5개 기업에서 49.49%를 차지하고 있습니다. 이 시장의 주요 기업은 MAPEI SpA, MBCC Group, RPM International Inc., Saint-Gobain, Sika AG입니다.
기타 혜택
엑셀 형식 시장 예측(ME) 시트
3개월의 애널리스트 서포트
목차
제1장 주요 요약 및 주요 조사 결과
제2장 보고서 제안
제3장 서문
조사 전제조건 및 시장 정의
조사 범위
조사 방법
제4장 주요 산업 동향
최종 용도 부문의 동향
상업
산업 및 시설
인프라
주택용
주요 인프라 프로젝트(현재로 발표됨)
규제 프레임워크
밸류체인 및 유통채널 분석
제5장 시장 세분화(시장 규모, 예측 및 성장 전망 분석 포함)(-2030년)
최종 용도별
상업
산업 및 시설
인프라
주택용
제품별
접착제
서브 제품별
핫멜트
반응성
용제계
수성
앵커와 그라우트
서브 제품별
시멘트계 고정재
수지 고정
기타
콘크리트 혼화제
서브 제품별
촉진제
공기혼입혼화제
고범위 감수제(초가소제)
지연제
수축 저감 혼화제
점도 조정제
감수제(가소제)
기타
콘크리트 보호 페인트
서브 제품별
아크릴계
알키드
에폭시
폴리우레탄
기타
바닥재용 수지
서브 제품별
아크릴
에폭시
폴리아스파라긴
폴리우레탄
기타
보수 및 재생 화학제품
서브 제품별
섬유 포장 시스템
주입 그라우트재
마이크로 콘크리트 모르타르
개질 모르타르
철근보호재
실링재
서브 제품별
아크릴
에폭시
폴리우레탄
실리콘
기타
표면 처리 약품
서브 제품별
경화 컴파운드
이형제
기타
방수 솔루션
서브 제품별
화학제품
멤브레인
국가별
프랑스
독일
이탈리아
러시아
스페인
영국
기타 유럽
제6장 경쟁 구도
주요 전략 동향
시장 점유율 분석
기업 상황
기업 프로파일
Ardex Group
Arkema
Atlas
CEMEX, SAB de CV
Fosroc, Inc.
Henkel AG & Co. KGaA
Kingspan Group
MAPEI SpA
MBCC Group
MC-Bauchemie
RPM International Inc.
Saint-Gobain
Schomburg
Selena Group
Sika AG
제7장 CEO에 대한 주요 전략적 질문
제8장 부록
세계 개요
개요
Porter's Five Forces 분석 프레임워크(산업 매력도 분석)
세계의 밸류체인 분석
시장 역학(DROs)
정보원 및 참고문헌
도표 일람
주요 인사이트
데이터 팩
용어집
AJY
영문 목차
영문목차
The Europe Construction Chemicals Market size is estimated at 22.40 billion USD in 2024, and is expected to reach 31.07 billion USD by 2030, growing at a CAGR of 5.60% during the forecast period (2024-2030).
Increase in investments for constructions in the industrial and commercial sectors to drive the demand for construction chemicals
By 2023, Europe was expected to hold a significant share, amounting to approximately 24.99% of the global construction chemicals market. In 2022, the construction chemicals market in Europe saw a 6.15% growth in value, driven primarily by rising demand from the commercial and industrial & institutional construction sectors.
Accounting for a share of about 35.55% in 2022, the industrial and institutional construction sector emerged as the largest consumer of construction chemicals in the regional market. The sector's projected new floor area is set to rise and reach 245 million sq. ft by 2030 compared to 2023. This surge is attributed to increased investments in industrial, education, and healthcare construction across European countries. The region's construction chemicals market for the industrial and institutional sector is forecast to grow from USD 7.48 billion in 2023 to USD 10.44 billion in 2030, driven by factors like urbanization and industrialization.
The commercial construction sector in the region is poised to be the fastest-growing consumer of construction chemicals, with a projected CAGR of 6.10% during the forecast period. The region's expanding economy is fueling demand for commercial properties, including offices, hotels, and retail malls. The sector's new floor area is anticipated to rise by 394 million sq. ft by 2030 compared to 2023. Driven by such developments, the European construction chemicals market for this sector is expected to witness a USD 2.36 billion increase from 2023 to 2030.
Construction chemicals are expected to witness high demand in Italy due to rising investments in industrial construction
Construction Chemicals, including concrete admixtures, waterproofing solutions, adhesives & sealants, anchors & grouts, and flooring resins, enhance the functionality of buildings and structures. In 2022, the value of Europe's construction chemicals market grew by 6.15% from the previous year. The European Union (EU) allocated USD 1555 billion to construction projects in 2022, contributing to the EU's construction-driven GDP of USD 15375 billion, a 3.5% increase from 2021. These investments bolstered the construction sector and fueled the demand for construction chemicals. The construction chemicals market was projected to grow by 4.44% in value in 2023, building on the momentum of the previous year.
Germany dominated the construction chemicals market in 2022, capturing a 17% market share by value. The country's construction sector attracted investments of USD 520 billion, primarily directed toward residential, civil engineering, and non-residential projects. As construction activities surged, the demand for construction chemicals followed suit, resulting in a market worth USD 3.5 billion in 2022. This market was anticipated to grow by 3.65% in value in 2023.
Italy is poised to witness the highest compound annual growth rate (CAGR) of 6.21% in the construction chemicals market. This growth is largely driven by the industrial construction segment. In line with Europe's climate goals of achieving zero emissions by 2050, companies like Repsol have committed to investing USD 550 million in renewable energy projects in Italy. Consequently, the projected new floor area for industrial construction in Italy is set to increase by 15.9 million square feet by 2030 compared to 2022, signaling a rising demand for construction chemicals.
Europe Construction Chemicals Market Trends
Office building expansion projects in countries such as Spain and Italy are boosting the commercial construction market in Europe
Europe witnessed a 12.70% surge in the new floor area for commercial construction in 2022, driven by an increased focus on constructing energy-efficient office buildings, which aligns with the region's 2030 carbon emission targets. As employees returned to office spaces, European companies, in turn, ramped up their leasing decisions, resulting in the addition of 5.7 million square feet of new office space in 2022. This growth was expected to persist in 2023, with a projected growth rate of 2.68% over 2022.
The COVID-19 pandemic caused a significant labor and material shortage, leading to the cancellation or postponement of several commercial construction projects. However, as lockdowns eased and construction activities resumed, Europe witnessed a robust 16.60% growth in new floor area for commercial construction in 2021, with Spain being the leader with a 105.05% growth rate.
The commercial construction sector in Europe is poised for substantial growth, with the new floor area anticipated to register a CAGR of 3.88% during the forecast period. Noteworthy projects, such as the USD 65 million Milan US Consulate General Complex in Italy, slated for completion by 2025, and the USD 260 million Arteixo Office Building Expansion in Spain, spanning 1.8 million square feet and set to be operational in 2024, are expected to bolster the region's commercial construction landscape. As consumer preferences shift from online to in-person retail experiences, the new floor area is expected to increase by 428.3 million square feet for retail shopping malls in Europe by 2030 compared to 2022.
Affordable housing schemes in the UK and Europe and growth in housing project completions are expected to increase the new floor area for residential construction
Europe's residential construction sector witnessed a 2.71% growth in new floor area in 2022 compared to the previous year. This can be attributed to the escalating urbanization rate, with the urban population accounting for 75% of the total in 2022, up from 73.5% in 2020. This trend was expected to persist in 2023, with a projected growth rate of 3.21% over 2022. According to the EURO CONSTRUCT network, Europe witnessed a 2.7% rise in housing project completions in 2023, with notable increases in Hungary, Ireland, Norway, and Poland.
The COVID-19 pandemic led to an economic downturn, resulting in the cancellation or postponement of numerous residential construction projects. Consequently, the new floor area for residential construction in Europe plummeted by 9.40% in 2020 compared to the preceding year. However, as lockdown restrictions eased and construction activities resumed, the sector rebounded strongly, with an 18.28% surge in new floor area in 2021 compared to 2020. Spain led the growth with a remarkable 40.23% increase, followed by Italy at 25.07%.
The new floor area for residential construction in Europe is projected to witness a CAGR of 3.89% during the forecast period. The United Kingdom is poised to lead this growth, recording a CAGR of 5.94%. This growth can be attributed to factors such as a mounting demand for affordable housing, particularly in urban centers grappling with population growth and limited housing supply. The UK government's Affordable Homes Programme, backed by an investment of USD 8 billion, aims to deliver 130,000 housing units by 2026, bolstering the nation's residential construction floor area.
Europe Construction Chemicals Industry Overview
The Europe Construction Chemicals Market is moderately consolidated, with the top five companies occupying 49.49%. The major players in this market are MAPEI S.p.A., MBCC Group, RPM International Inc., Saint-Gobain and Sika AG (sorted alphabetically).
Additional Benefits:
The market estimate (ME) sheet in Excel format
3 months of analyst support
TABLE OF CONTENTS
1 EXECUTIVE SUMMARY & KEY FINDINGS
2 REPORT OFFERS
3 INTRODUCTION
3.1 Study Assumptions & Market Definition
3.2 Scope of the Study
3.3 Research Methodology
4 KEY INDUSTRY TRENDS
4.1 End Use Sector Trends
4.1.1 Commercial
4.1.2 Industrial and Institutional
4.1.3 Infrastructure
4.1.4 Residential
4.2 Major Infrastructure Projects (current And Announced)
4.3 Regulatory Framework
4.4 Value Chain & Distribution Channel Analysis
5 MARKET SEGMENTATION (includes market size, forecasts up to 2030 and analysis of growth prospects.)
5.1 End Use Sector
5.1.1 Commercial
5.1.2 Industrial and Institutional
5.1.3 Infrastructure
5.1.4 Residential
5.2 Product
5.2.1 Adhesives
5.2.1.1 By Sub Product
5.2.1.1.1 Hot Melt
5.2.1.1.2 Reactive
5.2.1.1.3 Solvent-borne
5.2.1.1.4 Water-borne
5.2.2 Anchors and Grouts
5.2.2.1 By Sub Product
5.2.2.1.1 Cementitious Fixing
5.2.2.1.2 Resin Fixing
5.2.2.1.3 Other Types
5.2.3 Concrete Admixtures
5.2.3.1 By Sub Product
5.2.3.1.1 Accelerator
5.2.3.1.2 Air Entraining Admixture
5.2.3.1.3 High Range Water Reducer (Super Plasticizer)
5.2.3.1.4 Retarder
5.2.3.1.5 Shrinkage Reducing Admixture
5.2.3.1.6 Viscosity Modifier
5.2.3.1.7 Water Reducer (Plasticizer)
5.2.3.1.8 Other Types
5.2.4 Concrete Protective Coatings
5.2.4.1 By Sub Product
5.2.4.1.1 Acrylic
5.2.4.1.2 Alkyd
5.2.4.1.3 Epoxy
5.2.4.1.4 Polyurethane
5.2.4.1.5 Other Resin Types
5.2.5 Flooring Resins
5.2.5.1 By Sub Product
5.2.5.1.1 Acrylic
5.2.5.1.2 Epoxy
5.2.5.1.3 Polyaspartic
5.2.5.1.4 Polyurethane
5.2.5.1.5 Other Resin Types
5.2.6 Repair and Rehabilitation Chemicals
5.2.6.1 By Sub Product
5.2.6.1.1 Fiber Wrapping Systems
5.2.6.1.2 Injection Grouting Materials
5.2.6.1.3 Micro-concrete Mortars
5.2.6.1.4 Modified Mortars
5.2.6.1.5 Rebar Protectors
5.2.7 Sealants
5.2.7.1 By Sub Product
5.2.7.1.1 Acrylic
5.2.7.1.2 Epoxy
5.2.7.1.3 Polyurethane
5.2.7.1.4 Silicone
5.2.7.1.5 Other Resin Types
5.2.8 Surface Treatment Chemicals
5.2.8.1 By Sub Product
5.2.8.1.1 Curing Compounds
5.2.8.1.2 Mold Release Agents
5.2.8.1.3 Other Product Types
5.2.9 Waterproofing Solutions
5.2.9.1 By Sub Product
5.2.9.1.1 Chemicals
5.2.9.1.2 Membranes
5.3 Country
5.3.1 France
5.3.2 Germany
5.3.3 Italy
5.3.4 Russia
5.3.5 Spain
5.3.6 United Kingdom
5.3.7 Rest of Europe
6 COMPETITIVE LANDSCAPE
6.1 Key Strategic Moves
6.2 Market Share Analysis
6.3 Company Landscape
6.4 Company Profiles
6.4.1 Ardex Group
6.4.2 Arkema
6.4.3 Atlas
6.4.4 CEMEX, S.A.B. de C.V.
6.4.5 Fosroc, Inc.
6.4.6 Henkel AG & Co. KGaA
6.4.7 Kingspan Group
6.4.8 MAPEI S.p.A.
6.4.9 MBCC Group
6.4.10 MC-Bauchemie
6.4.11 RPM International Inc.
6.4.12 Saint-Gobain
6.4.13 Schomburg
6.4.14 Selena Group
6.4.15 Sika AG
7 KEY STRATEGIC QUESTIONS FOR CONCRETE, MORTARS AND CONSTRUCTION CHEMICALS CEOS
8 APPENDIX
8.1 Global Overview
8.1.1 Overview
8.1.2 Porter's Five Forces Framework (Industry Attractiveness Analysis)