스마트 전력 미터 : 시장 점유율 분석, 산업 동향 및 통계, 성장 예측(2025-2030년)
Smart Electricity Meter - Market Share Analysis, Industry Trends & Statistics, Growth Forecasts (2025 - 2030)
상품코드:1640689
리서치사:Mordor Intelligence
발행일:2025년 01월
페이지 정보:영문
라이선스 & 가격 (부가세 별도)
ㅁ Add-on 가능: 고객의 요청에 따라 일정한 범위 내에서 Customization이 가능합니다. 자세한 사항은 문의해 주시기 바랍니다.
ㅁ 보고서에 따라 최신 정보로 업데이트하여 보내드립니다. 배송기일은 문의해 주시기 바랍니다.
한글목차
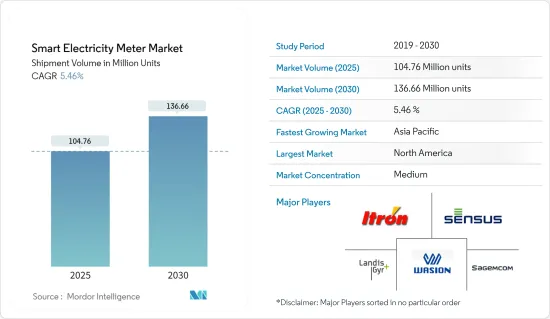
스마트 전력 미터 시장 규모는 출하대수 기준으로 2025년 1억 476만대에서 2030년에는 1억 3,666만대로 확대되며, 예측기간(2025-2030년)의 CAGR은 5.46%로 예상됩니다.
스마트 미터의 도입은 홈 에너지 관리 시스템(HEMS)과 빌딩 에너지 관리 시스템(BEMS)의 도입을 가능하게 하여 개별 가정이나 건물 전체의 전력 사용량을 가시화합니다.
주요 하이라이트
경제활동의 활성화에 의해 에너지소비량이 증가하고 세계의 전력망이 한계에 도달하고 있기 때문에 세계적으로 에너지효율이 점점 중시되고 있습니다. BP에 따르면 2021년 세계의 발전량은 28,466테라와트시였습니다.
디지털화를 통해 에너지 효율화 대책은 더욱 가속화되고 현대화되고 있습니다. 이에 따라 공급을 동적으로 최적화하고 태양광 발전 등 재생가능에너지에 의한 대량의 전력 공급을 촉진할 수 있는 스마트 그리드의 도입이 세계적으로 증가하고 있습니다.
최근 COVID-19 세계의 유행과 전국적인 봉쇄는 스마트 미터의 세계 전반에 영향을 미쳤습니다. COVID-19의 세계적인 유행으로 인해 세계 각지에서 록다운이 발생하여 업계 전반에 걸쳐 일부 업무가 중단되었습니다. 그 결과 스마트 미터의 출하와 설치에도 영향을 미쳤습니다.
그러나 COVID-19 규정이 점차 완화되고 있기 때문에 스마트 미터의 설치 대수는 장기적으로 증가할 것으로 예상됩니다. 많은 고급 지역에서 많은 에너지 공급 회사가 스마트 미터로 업그레이드를 고객에게 촉구합니다. 스마트 미터는 사람과의 직접적인 상호작용을 최소화하고 에너지 절약 동기 부여, 간편한 청구서 지불, 원격 검침, 청구 및 회수 효율성 향상, 기술적 및 상업적인 총 손실 감소, 전력 도난 억제 등 밸류체인 전반에 걸쳐 몇 가지 이점을 제공하기 때문입니다.
가전제품, 사무기기, 기타 플러그 부하는 주요 모드가 아닌 동안 주택·상업시설 전체의 전력의 15%-20% 가까이를 소비하고 있습니다. 에너지의 대부분은 저전력 모드에서 (사용하지 않을 때도) 소비됩니다. 소비자는 이러한 시나리오를 추적하기 위해 스마트 에너지 관리 시스템을 도입하는 경향이 커지고 있습니다.
스마트 전력 미터 시장 동향
주택 부문이 큰 성장을 기록
스마트 전력 미터는 소비자가 소비하는 에너지를 측정하기 때문에 주택 부문에서 중요한 역할을 수행합니다. 스마트 그리드에 대한 투자 증가와 신흥 경제 국가에서 신재생 전력의 기존 그리드로의 통합률이 급증하는 것은 스마트 전력 미터 시장의 성장을 지원할 것으로 예상됩니다.
미터는 전력 소비를 측정하고 이를 중앙 유틸리티 시스템에 전달합니다. 세계적으로, 주택 부문에서 이러한 장비의 설치는 최고 에너지 소비에 기여하는 소비자 증가로 인해 CO2 배출량을 줄이는 데 도움이 됩니다.
주택건설활동 증가나 설치미터의 80% 이상을 스마트화하는 것을 목표로 하는 EU의 20-20-20 정책과 같은 정부의 지령에 의해 스마트 전력미터 시장의 성장 전망은 확실시 되어 있습니다.
또한 소비자가 독립형 에너지 발전 시스템으로 전환함에 따라 스마트 그리드의 상호 작용 능력이 점점 더 중요해지고 있습니다. 옥상 태양광 발전 시스템과 소형 풍력 터빈은 현재 널리 보급되어 있으며 많은 가정과 기업에 비용 효율적입니다. 스마트 미터를 설치하면 이러한 모든 미니 발전 시스템을 효율적으로 그리드에 연결하고 전체 배전 및 측정 프로세스를 효과적이고 효율적으로 만드는 데 도움이 될 것입니다.
게다가 도시화가 진행되어 도시형 라이프스타일을 중시하는 경향이 강해짐에 따라, 낭비를 없애기 위해 전기, 조명, 에너지의 자동 제어를 실시하는 스마트 홈 기술과 디바이스의 도입이 확대되었습니다. 그러므로 세계적으로 가정에서 스마트 홈 디바이스와 기술의 채택이 증가하고 있으며, 주택 부문에서 스마트 미터의 성장이 더욱 촉진될 것으로 예상됩니다.
미국이 큰 시장 점유율을 차지
자동검침 솔루션 시장은 미국에서 성숙기를 맞아 성장이 둔화되고 있습니다. 또한 미국의 Institute for Electric Innovation에 따르면 미국에서는 2021년까지 1억 1,500만대의 스마트 미터가 설치됐다고 합니다.
1세대 미터의 교체와 고급 미터 인프라로의 전환(더 높은 기능과 향상된 기술을 갖춘)이 향후 스마트 전력 미터 시장을 견인할 것으로 예상됩니다.
미국의 전력 회사는 에너지 그리드의 건전성을 모니터링하고 정전 발생 시 전기 서비스를 보다 신속하게 복구하고 분산형 에너지 자원(DER)을 통합하며 에너지 서비스와 솔루션을 고객에게 제공하기 위해 스마트 미터 데이터를 활용합니다. 또한 미국의 전력 회사는 에너지 그리드를 강화하기 위해 많은 투자를 하고 있습니다.
또한 이 지역공급업체는 고객 참여 도구 및 기타 인센티브 전략과 같은 추가 도구와 결합하여 스마트 전력 미터의 잠재력을 활용하고 시장에서 스마트 전력 미터의 채택을 촉진할 것으로 예상됩니다. 예를 들어, 볼티모어 가스 앤 일렉트릭은 스마트 전력 미터가 설치될 때마다 고객을 스마트 에너지 보상 프로그램에 등록합니다. 고객은 의견 및 피크 리베이트 인센티브를 받아 에너지 비용 절감에 기여합니다.
마찬가지로 미국의 퍼시픽 가스 앤 일렉트릭은 AMI를 타겟으로 하는 주택 리노베이션 프로그램이 타겟 주택에서 3.5배의 에너지 절약을 실현했다고 보고했습니다. 또한 스마트 전력 미터와 데이터 분석과 같은 기술의 통합은 이 지역에서 조사된 시장 성장을 더욱 촉진할 것으로 예상됩니다.
스마트 전력 미터 산업 개요
스마트 전력 미터 시장은 적당한 경쟁 상태에 있으며 여러 대형 기업으로 구성되어 있습니다. 크고 작은 기업이 존재하기 때문에 시장은 적당히 단편화됩니다. 이러한 기업들은 전략적 혁신과 공동 이니셔티브를 활용하여 시장 점유율을 확대하고 수익성을 높이고 있습니다. 또한, 이 시장에서 사업을 전개하는 기업은 자사의 제품력을 강화하기 위해, 기업용 네트워크 기기 기술에 임하는 신흥 기업을 인수하고 있습니다.
2022년 10월, 안도라 프라데시의 전력 공사는 스마트 전력 미터 프로젝트를 전개하기 위한 훌륭한 업을 발표했습니다. 연방정부는 스마트미터 국가계획(SMNP)하에 인도 전역에서 약 2억 5,000개의 기존 미터를 스마트 미터로 교환하기로 결정했습니다.
기타 혜택
엑셀 형식 시장 예측(ME) 시트
3개월간의 애널리스트 서포트
목차
제1장 서론
조사의 전제조건과 시장 정의
조사 범위
제2장 조사 방법
제3장 주요 요약
제4장 시장 인사이트
시장 개요
산업 밸류체인 분석
업계의 매력도 - Porter's Five Forces 분석
신규 참가업체의 위협
구매자의 협상력
공급기업의 협상력
대체품의 위협
경쟁 기업 간 경쟁 관계의 강도
COVID-19의 업계에 대한 영향 평가
제5장 시장 역학
시장 성장 촉진요인
주요 지역을 위한 정부의 지원 규제
스마트 시티 전개 증가
시장 성장 억제요인
높은 비용과 보안에 대한 우려
스마트 미터와의 통합의 어려움
제6장 시장 세분화
최종 사용자별
주택
상업
산업
지역별
북미
미국
캐나다
유럽
영국
스페인
독일
이탈리아
프랑스
터키
북유럽
베네룩스
기타 유럽
아시아태평양
중국
인도
일본
호주 및 뉴질랜드
한국
동남아시아(말레이시아, 싱가포르, 태국, 기타)
기타 아시아태평양
라틴아메리카
브라질
멕시코
콜롬비아
칠레
기타 라틴아메리카
중동 및 아프리카
GCC
남아프리카
이집트
기타 아프리카
기타 중동
제7장 경쟁 구도
기업 프로파일
Landis gyr Group AG
Wasion Group Holdings
Elster Group GMBH(Honeywell International Inc.)
Jiangsu Linyang Energy Co. Ltd
Sagemcom SAS
Ningbo Sanxing Electric Co. Ltd
Kamstrup A/S
Hexing Electric Company Ltd
Itron Inc.
Holley Technology Ltd
Nanjing Xinlian Electronics Co. Ltd
Sensus USA Inc.(Xylem Inc)
Shenzhen Hemei Group Co. Ltd
제8장 투자 분석
제9장 시장의 미래
KTH
영문 목차
영문목차
The Smart Electricity Meter Market size in terms of shipment volume is expected to grow from 104.76 million units in 2025 to 136.66 million units by 2030, at a CAGR of 5.46% during the forecast period (2025-2030).
Smart meters deployment enabled the implementation of a Home Energy Management System (HEMS) or Building Energy Management System (BEMS) that allows visualization of the electric power usage in individual homes or entire buildings.
Key Highlights
Energy efficiency is increasingly becoming the primary focus globally, owing to the increasing economic activities, which led to high energy consumption rates and pushed global electricity grids to their limits. The global electricity generation in 2021 stood at 28,466 Terawatt-hours, according to BP.
Digitization has been further accelerating and modernizing energy efficiency measures due to which the deployment of smart grids has been increasing globally, as they are capable of dynamically optimizing supply and fostering supply of large amounts of electricity from renewable energy sources, such as solar power.
The recent COVID -19 outbreak and nationwide lockdown across the globe impacted the overall rollout of Smart meters globally. The global COVID -19 pandemic resulted in lockdowns in various parts of the world, which halted several operations across industries. As a result, the shipments and installations of smart meters were also affected.
However, as the COVID-19 regulations are slowly being eased, the number of smart meters being installed is also expected to witness an increase in the long term. In many developed regions, most energy suppliers have been motivating their customers to upgrade to smart meters as it minimizes direct human interaction and offers several other benefits across the entire value chain, such as incentivizing energy conservation and facilitating easy bill payments, remote meter reading, improving billing and collection efficiency, reducing aggregate technical and commercial losses, and curbing power theft, among others.
Consumer electronics, office equipment, and other plug loads consume nearly 15% to 20% of the total residential and commercial electricity while not in the primary mode. Most of this energy is consumed when they operate in low-power modes (even while they are not in use). Consumers are increasingly tending to install a smart energy management system to track such scenarios.
Smart Electricity Meter Market Trends
Residential Segment to Register Significant Growing
Smart electric meter plays a significant role in the residential sector, as this meter measures the energy consumed by the consumers. The increasing smart grid investments and the surge in the rate of integration of renewable sources of power generation to the existing grids in developed economies are expected to support the growth of the smart electricity meter market.
The meter measures the electricity consumption and communicates this to the central utility system. Globally, installations of these devices in the residential sector help in the reduction of CO2 emissions, owing to the increased consumer's inclination toward peak time savings of energy.
The increasing residential construction activities and government mandates, like the EU 20-20-20 policy aiming to convert over 80% of the installed meter base to a smart one, have ensured growth prospects for the smart electricity meters market.
Furthermore, as consumers move toward stand-alone energy generation systems, the interactive capacity of the Smart Grid will become more and more important. Rooftop solar electric systems and small wind turbines are now widely available and have become cost-effective for many homeowners and businesses. Installations of smart meters will help to effectively connect all these mini-power generating systems to the grid to help the overall power distribution and measurement process be effective and more efficient.
Moreover, increasing urbanization and the increasing inclination toward the focus on developing urban lifestyles led to the expansion of deployment of smart home technologies and devices, which involves automatic control of electricity, light, and energy to avoid wastage. Hence, the increasing adoption of smart home devices and technologies across the homes globally is further expected to foster the growth in smart meters in the residential segment.
United States to Hold Significant Market Share
The automatic meter reading solutions market has been reaching maturity in the United States, resulting in sluggish growth. Furthermore, according to the Institute for Electric Innovation in the United States, 115 million smart meters have been installed in the US by 2021.
The replacement of first-generation meters and the shift to advanced metering infrastructure (with higher capabilities and improved technology) are expected to drive the smart electricity meters market in the future.
Electric companies across the United States are leveraging smart meter data to monitor the health of the energy grid, restore electric service more quickly when outages occur, integrate distributed energy resources (DERs), and deliver energy services and solutions to customers. Furthermore, electricity companies in the United States are making significant investments to enhance the energy grid.
Moreover, vendors in the region leveraging smart electric meters' potential by pairing them with additional tools, such as customer engagement tools and other incentive strategies, are expected to drive the adoption of smart electric meters in the market. For instance, Baltimore Gas and Electric enrolls its customers into its smart energy rewards program whenever the Smart electricity meter is installed. Customers receive feedback, peak time rebate incentives, and help reduce energy costs.
Similarly, Pacific Gas & Electric, in the United States, reported AMI targeting a home retrofit program that delivers 3.5 times more energy savings in the targeted homes. Additionally, the integration of smart electric meters with technologies, such as data analytics, is expected to further foster the growth of the market studied in the region.
Smart Electricity Meter Industry Overview
The smart electricity meters market is moderately competitive and consists of several major players. The market is moderately fragmented, owing to the presence of many small and large players. These companies are leveraging strategic innovations and collaborative initiatives to increase their market share and increase their profitability. The companies operating in the market are also acquiring start-ups working on enterprise network equipment technologies to strengthen their product capabilities.
In October 2022, the power utilities of Andhra Pradesh announced a great up for rolling out a smart electricity meter project. The Union government decided to replace around 25 crore conventional meters with smart meters across India under the Smart Meter National Programme (SMNP).
Additional Benefits:
The market estimate (ME) sheet in Excel format
3 months of analyst support
TABLE OF CONTENTS
1 INTRODUCTION
1.1 Study Assumptions and Market Definition
1.2 Scope of the Study
2 RESEARCH METHODOLOGY
3 EXECUTIVE SUMMARY
4 MARKET INSIGHTS
4.1 Market Overview
4.2 Industry Value Chain Analysis
4.3 Industry Attractiveness - Porter's Five Forces Analysis
4.3.1 Threat of New Entrants
4.3.2 Bargaining Power of Buyers
4.3.3 Bargaining Power of Suppliers
4.3.4 Threat of Substitute Products
4.3.5 Intensity of Competitive Rivalry
4.4 Assessment of the Impact of COVID-19 on the Industry
5 MARKET DYNAMICS
5.1 Market Drivers
5.1.1 Supportive Government Regulations in Key Regions
5.1.2 Rise in Smart City Deployment
5.2 Market Restraints
5.2.1 High Costs and Security Concerns
5.2.2 Integration Difficulties with Smart Meters
6 MARKET SEGMENTATION
6.1 By End-user
6.1.1 Residential
6.1.2 Commercial
6.1.3 Industrial
6.2 By Geography
6.2.1 North America
6.2.1.1 United States
6.2.1.2 Canada
6.2.2 Europe
6.2.2.1 United Kingdom
6.2.2.2 Spain
6.2.2.3 Germany
6.2.2.4 Italy
6.2.2.5 France
6.2.2.6 Turkey
6.2.2.7 Nordics
6.2.2.8 Benelux
6.2.2.9 Rest of Europe
6.2.3 Asia-Pacific
6.2.3.1 China
6.2.3.2 India
6.2.3.3 Japan
6.2.3.4 Australia and New Zealand
6.2.3.5 South Korea
6.2.3.6 Southeast Asia (Malaysia, Singapore, Thailand and Others)
6.2.3.7 Rest of Asia-Pacific
6.2.4 Latin America
6.2.4.1 Brazil
6.2.4.2 Mexico
6.2.4.3 Columbia
6.2.4.4 Chile
6.2.4.5 Rest of Latin America
6.2.5 Middle East & Africa
6.2.5.1 GCC
6.2.5.2 South Africa
6.2.5.3 Egypt
6.2.5.4 Rest of Africa
6.2.5.5 Rest of Middle East
7 COMPETITIVE LANDSCAPE
7.1 Company Profiles
7.1.1 Landis+gyr Group AG
7.1.2 Wasion Group Holdings
7.1.3 Elster Group GMBH (Honeywell International Inc.)