ㅁ Add-on 가능: 고객의 요청에 따라 일정한 범위 내에서 Customization이 가능합니다. 자세한 사항은 문의해 주시기 바랍니다.
ㅁ 보고서에 따라 최신 정보로 업데이트하여 보내드립니다. 배송기일은 문의해 주시기 바랍니다.
한글목차
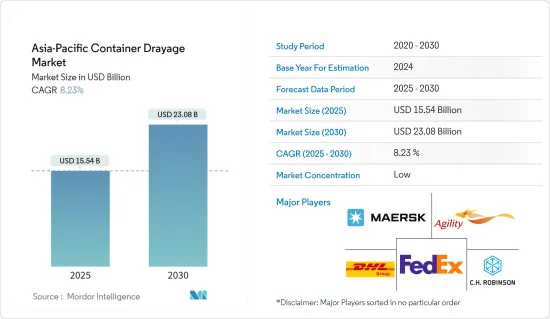
아시아태평양의 컨테이너 드레이지 시장 규모는 2025년에 155억 4,000만 달러로 추정되며, 예측 기간 중(2025-2030년)의 연평균 성장율(CAGR)은 8.23%로, 2030년에는 230억 8,000만 달러에 달할 것으로 예측되고 있습니다.
주요 하이라이트
아시아태평양의 컨테이너 드레이징 시장은 주로 빠른 무역 활동으로 인한 컨테이너 운송 수요의 급증에 의해 주도되고 있습니다. 아시아 태평양 지역은 광활한 해안선과 특히 중국에 집중된 제조업체로 인해 컨테이너에 대한 수요가 증가하고 있습니다. 또한 지역 국가의 정부가 지원을 강화하고 인도와 인도네시아 같은 미개발 시장이 가능성을 보임에 따라 향후 시장 성장이 유망해 보입니다.
전 세계 상위 25개 항만 중 18개가 아시아에 위치해 있어 아시아 국가들이 화물 처리에서 우위를 점하고 있습니다. 세계은행과 S&P 글로벌 마켓 인텔리전스의 컨테이너 항만 성과 지수(CPPI)를 기반으로 한 이 데이터에 따르면 동아시아는 상위 항만 중 11개를 보유하고 있으며, 서아시아는 4개 항만을 보유하고 있는 것으로 나타났습니다.
2023년 2분기에는 중국이 시장을 주도하면서 아시아 경제가 글로벌 연결 환경을 지배했습니다. 대한민국, 싱가포르, 말레이시아가 그 뒤를 바짝 쫓았습니다. 이들 국가는 모두 정기선 해운 연결성 지수(LSCI)가 전년 대비 3%에서 5% 상승하여 지수 값이 사상 최고치를 기록했습니다.
2023년 중국은 원자재에 대한 강력한 수요와 해상 무역에 대한 높은 의존도를 바탕으로 아시아 태평양 컨테이너 시장을 장악했습니다. 화물 운송 수요의 급증과 무역 협정 등의 요인이 시장을 강화하는 반면, 운송 및 재고 비용의 변동은 도전 과제가 되고 있습니다. 그러나 해상 운송의 자동화 추세와 강화된 안전 규범이 더 많은 기회를 제공하면서 시장은 성장할 준비가 되어 있습니다.
아시아태평양의 컨테이너 드레이지 시장 동향
아시아의 주요 허브 항구의 혼잡 완화, 컨테이너 드레이지 수요의 급증이 수송 부문을 주도
2024년 6월까지 북아시아 및 동남아시아의 주요 항만에서 선박 지연이 눈에 띄게 감소했으며, 중국도 장비 가용성이 증가했습니다. 그러나 해상 운송업체와 포워더의 보고서에 따르면 인도에서는 혼잡 문제가 심화되고 있습니다. 아시아 전역의 해운 업계 임원들은 싱가포르, 닝보, 칭다오, 말레이시아 클랑과 같은 항구에서 선박 지연은 줄어들고 있지만 컨테이너 운송에 대한 수요는 증가하고 있다고 강조했습니다.
싱가포르의 혼잡은 다소 완화되었지만, 운송업자는 클랑 항구와 탄중 페레파스 항구와 같은 말레이시아 항구를 이용하게 되었습니다. 특히 탄중 펠레파스는 싱가포르에서의 전환도 있어 2024년 상반기 컨테이너 취급량이 20% 급증했습니다. 마찬가지로 클랜의 노스포트에서는 2024년 5월 컨테이너 취급량이 전년 대비 26% 증가한 33만 5,361TEU가 되었습니다.
싱가포르의 경우 대기 시간이 2일에서 3일로 다소 개선되었지만, 대기 시간이 줄기는 했지만 여전히 항공사 및 서비스에 따라 큰 차이가 있습니다. 특히 싱가포르의 극심한 혼잡으로 인해 아시아-유럽 극동 태평양 1 서비스의 지연이 두드러진 것으로 조사되었습니다. 2024년 5월 말에는 지연이 8일로 최고조에 달했지만, 이후 일부 FP1 항로에서 최대 5일로 줄었습니다.
다른 곳에서는 2024년 4월 말 최대 3일이었던 대기 시간이 닝보에서는 2일, 칭다오에서는 24시간 이내로 줄었다고 Hapag-Lloyd는 보고했습니다. 데이터에 따르면 싱가포르에서는 정박 대기 중인 선박이 2024년 6월 15일 350,281TEU에서 6월 말에는 286,778TEU로 감소하여 개선된 것으로 나타났습니다. 그러나 정박 대기 중인 총 선복량은 2024년 5월 초부터 증가세를 보이고 있습니다.
중국의 장비 가용성은 특히 20피트 컨테이너의 경우 다롄과 대만 항구에서 개선 조짐을 보였지만, 중국 중부, 특히 우한과 같은 지역에서는 여전히 눈에 띄게 타이트한 상황이 지속되고 있습니다. 반면 인도의 주요 컨테이너 관문인 문드라는 환적 물동량 증가로 인한 압박이 가중되고 있습니다. 싱가포르와 두바이를 운항하는 일부 운송업체는 다른 아시아 항구를 우선시하기 위해 문드라 항로 운항을 축소했습니다.
최근 무역 업데이트에 따르면 혼잡한 컨테이너 야드의 수입 통관 부진으로 인해 문드라의 컨테이너 체류 시간이 상당히 길어졌습니다. 인도 컨테이너 철도 운영사(CTO)들은 열차 처리 지연으로 인해 수입업체들이 추가 비용을 부담하고 있다고 지적하고 있습니다. CTO 소식통에 따르면 철도 화물의 야적장 적체가 평소 7-9일에서 현재 평균 15-20일로 두 배로 증가했다고 합니다. 특히 문드라의 물동량 중 약 절반이 철도를 이용하고 있습니다.
상황이 악화되자 컨테이너 열차 운영자 협회는 항만 당국의 불가항력 선언 가능성을 암시했습니다. 동시에 컨테이너 선사 협회(인도)는 화물 흐름을 원활하게 하기 위해 항만 당국의 신속한 조치를 촉구하고 있습니다.
중국의 무역 수요 급증으로 시장 주도
미국의 소매 재고 및 매출 증가 : 2024년 1월부터 4월까지 미국의 소매 재고는 7,693억 달러에서 꾸준히 증가하여 7,935억 달러에 이르렀습니다. 특히 자동차, 건축자재 등의 분야에서 현저한 상승이 보였습니다.
소매 매출의 지속적인 성장: 2024년 5월 미국 소매 매출은 전월 대비 0.1% 증가, 전년 대비 2.3% 증가했습니다. 자동차 딜러, 주유소, 레스토랑을 제외한 핵심 소매 매출은 전월 대비 0.3% 증가, 전년 대비 2.9% 증가했습니다. 이 수치는 NRF가 예측하는 2024년 성장률 2.5%에서 3.5%에 가깝습니다.
미국의 소매 재고, 특히 자동차 및 건축자재 산업의 재고 급증은 컨테이너 배수 서비스에 대한 왕성한 수요를 나타냅니다. 이 상승은 매우 중요한 제조 거점인 중국의 컨테이너 드레이지의 필요성을 높입니다.
중국 항구는 2024년 첫 4개월 동안 전년 대비 9%의 증가율을 기록하며 무려 1억 4,033만 TEU를 처리했습니다. 동시에 대외 무역 화물은 전년 동기 대비 9.1% 증가했습니다.
주목할 만한 점은 2024년 전체 화물 처리량이 55억 5,500만 톤을 기록하여 전년 대비 5.2% 증가했다는 점입니다.
아시아태평양의 컨테이너 드레이지 산업 개요
아시아태평양의 컨테이너 드레이지 시장은 단편화 되어있습니다. 이 시장의 주요 기업으로는 머스크 아시아 퍼시픽, 민첩성, CH 로빈슨 월드 와이드 잉크, 페덱스 코퍼레이션, 독일 포스트 DHL 그룹 등이 있습니다.
주요 기업들은 경쟁력을 유지하기 위해 다양한 전략 분야에 주력하고 있습니다. 비즈니스 프로세스의 디지털 변환과 자동화는 효율성을 높이고 비즈니스 비용을 줄이기 위해 점점 더 중요해지고 있습니다.
기타 혜택
엑셀 형식 시장 예측(ME) 시트
3개월간의 애널리스트 지원
목차
제1장 서론
조사의 성과
조사의 전제
조사 범위
제2장 조사 방법
제3장 주요 요약
제4장 시장 역학과 인사이트
현재의 시장 시나리오
시장 역학
성장 촉진요인
철도거래 증가
전자상거래 분야의 성장
억제요인
항만의 혼잡에 의한 화물의 집배 지연
회피 가능한 비용 발생의 위험
기회
시장을 견인하는 기술의 진보
업계의 매력 - Porter's Five Forces 분석
신규 진입업자의 위협
구매자, 소비자의 협상력
공급기업의 협상력
대체품의 위협
경쟁 기업간 경쟁 관계
밸류체인, 서플라이체인 분석
업계의 규제와 정책에 대한 통찰
기술통합에 관한 통찰
아시아태평양의 전자상거래 산업에 대한 통찰
아시아태평양의 컨테이너 데이터 개요
화물 운송 비용, 운임
COVID-19가 시장에 미치는 영향
제5장 시장 세분화
수송 모드별
철도
도로
기타 수송 모드
지역별
중국
일본
인도
한국
인도네시아
베트남
호주
기타 아시아태평양
제6장 경쟁 구도
시장 집중도 개요
기업 프로파일
Maersk Asia Pacific
Agility
CH Robinson Worldwide Inc.
FedEx Corp.
Deutsche Post DHL Group
Hitachi Ltd
CMA CGM SA Group
DB Schenker
United Parcel Services Inc.
Ceva Logistics
Yusen Logistics Co. Ltd*
기타 기업
제7장 시장 전망
제8장 부록
거시경제지표
자본 흐름의 통찰(수송 및 저장 부문에 대한 투자)
대외무역 통계
HBR
영문 목차
영문목차
The Asia-Pacific Container Drayage Market size is estimated at USD 15.54 billion in 2025, and is expected to reach USD 23.08 billion by 2030, at a CAGR of 8.23% during the forecast period (2025-2030).
Key Highlights
The Asia-Pacific container drayage market is mainly driven by the surge in demand for shipping containers due to rapid trade activities. Asia-Pacific, bolstered by its expansive coastal lines and a concentration of manufacturers, particularly in China, is witnessing heightened demand for these containers. Moreover, as governments in regional countries ramp up initiatives and untapped markets like India and Indonesia show promise, future market growth looks promising.
Asian countries maintain their dominance in cargo handling, with 18 of the top 25 global ports located in Asia. This data, sourced from the Container Port Performance Index (CPPI) by the World Bank and S&P Global Market Intelligence, highlights that Eastern Asia boasts 11 of these top ports, while Western Asia hosts four.
Asian economies dominated the global connectivity landscape in Q2 2023, with China leading the market. The Republic of Korea, Singapore, and Malaysia followed closely. Each of these nations saw their Liner Shipping Connectivity Index (LSCI) rise by 3% to 5% compared to the previous year, hitting all-time highs in their index values.
In 2023, China dominated the Asia-Pacific shipping container market, underpinned by its robust demand for commodities and heavy reliance on seaborne trade. While factors like a surge in cargo transportation demand and trade agreements bolster the market, fluctuations in transportation and inventory costs pose challenges. However, the market is poised for growth, with automation trends in marine transportation and heightened safety norms offering further opportunities.
Asia-Pacific Container Drayage Market Trends
Port Congestion Easing in Key Asian Hubs, Surge in Demand for Container Drayage Driving the Transportation Segment
By June 2024, major ports in North and Southeast Asia have seen a notable drop in vessel delays, with China also marking an uptick in equipment availability. However, reports from ocean carriers and forwarders underscore a mounting congestion challenge in India. Executives in the shipping industry across Asia have highlighted that while ports like Singapore, Ningbo, Qingdao, and Klang in Malaysia are witnessing fewer vessel delays, the demand for container drayages is on the rise.
Although congestion in Singapore has slightly alleviated, carriers are increasingly turning to Malaysian ports like Klang and Tanjung Pelepas. Tanjung Pelepas, in particular, saw a 20% surge in container volumes in the first half of 2024, partly due to diversions from Singapore. Similarly, Northport in Klang recorded a notable 26% uptick in container volumes in May 2024, reaching 335,361 TEUs compared to the previous year, largely fueled by ad-hoc carrier calls.
While there has been a modest improvement in wait times in Singapore, ranging from two to three days, the wait times, though reduced, still vary significantly based on the carrier and service. Notably, research highlighted delays in the Asia-Europe Far East Pacific 1 service, primarily due to severe congestion in Singapore. Although delays peaked at eight days by the end of May 2024, they have since reduced to a maximum of five days on some FP1 sailings.
Elsewhere, Hapag-Lloyd reported that wait times had decreased to two days in Ningbo and less than 24 hours in Qingdao, compared to up to three days at the end of April 2024. Data indicates an improvement in Singapore, with vessels waiting at anchorage dropping from 350,281 TEUs on June 15, 2024, to 286,778 TEUs by the end of June. However, the total capacity waiting to berth has seen an uptick since early May 2024.
While equipment availability in China has shown signs of improvement, especially in ports like Dalian and Taiwanese ports for 20-foot containers, there is still a noticeable tightness in central China, particularly in areas like Wuhan. On the other hand, Mundra, India's primary container gateway, is grappling with mounting pressure from escalating transshipment volumes. Some carriers plying between Singapore and Dubai have curtailed sailings at Mundra to prioritize other Asian ports.
Recent trade updates underscore that container dwell times at Mundra have significantly lengthened, attributed to sluggish import clearance in congested container yards. Indian container rail operators (CTOs) are pointing fingers at the port for train turnaround disruptions, leading to additional charges for importers. CTO sources reveal that yard backlogs for railed freight have doubled, now averaging 15 to 20 days, up from the usual seven to nine days. Notably, approximately half of Mundra's traffic is rail-bound.
With the circumstances escalating, the Association of Container Train Operators has hinted at a potential force majeure declaration from the port authority. Simultaneously, the Container Shipping Lines Association (India) is urging swift action from the port to smoothen cargo flows.
Surge in Demand for Trade in China Driving the Market
US Retail Inventories and Sales Growth: From January to April 2024, US retail inventories climbed steadily, starting at USD 769.3 billion and reaching USD 793.5 billion. Notably, sectors like motor vehicles and building materials saw pronounced upticks.
Continued Retail Sales Growth: In May 2024, retail sales in the United States inched up by 0.1% from the previous month and 2.3% from the prior year. Core retail sales, which exclude automobile dealers, gasoline stations, and restaurants, saw a 0.3% monthly increase and a 2.9% yearly rise. These figures closely mirror the NRF's projected 2.5% to 3.5% growth for 2024.
The surge in US retail inventories, especially in motor vehicles and building materials industries, signals a robust demand for container shipping services. This uptick is poised to drive an increased necessity for container shipments from China, a pivotal manufacturing hub.
China's ports, recording a 9% Y-o-Y surge, processed a staggering 104.03 million TEUs in the initial four months of 2024. Simultaneously, foreign trade cargo saw a 9.1% Y-o-Y upswing.
Noteworthy is the overall cargo throughput, which hit 5.55 billion tonnes in 2024, marking a 5.2% uptick from the preceding year's figures.
Asia-Pacific Container Drayage Industry Overview
The Asia-Pacific container drayage market is fragmented. Key players in this market include Maersk Asia Pacific, Agility, C H Robinson Worldwide Inc., FedEx Corp., and Deutsche Post DHL Group.
The leading companies are focusing on various strategic areas to maintain their competitive edge. Digital transformation and automation in operational processes are increasingly emphasized to improve efficiency and reduce operational costs.
Additional Benefits:
The market estimate (ME) sheet in Excel format
3 months of analyst support
TABLE OF CONTENTS
1 INTRODUCTION
1.1 Study Deliverables
1.2 Study Assumptions
1.3 Scope of the Study
2 RESEARCH METHODOLOGY
3 EXECUTIVE SUMMARY
4 MARKET DYNAMICS AND INSIGHTS
4.1 Current Market Scenario
4.2 Market Dynamics
4.2.1 Drivers
4.2.1.1 Increasing Railway Trade
4.2.1.2 Growing E-commerce Sector
4.2.2 Restraints
4.2.2.1 Port Congestion Delaying Cargo Pick-up and Delivery
4.2.2.2 Risk of Incurring Avoidable Costs
4.2.3 Opportunities
4.2.3.1 Technological Advancements Driving the Market
4.3 Industry Attractiveness - Porter's Five Forces Analysis
4.3.1 Threat of New Entrants
4.3.2 Bargaining Power of Buyers/Consumers
4.3.3 Bargaining Power of Suppliers
4.3.4 Threat of Substitute Products
4.3.5 Intensity of Competitive Rivalry
4.4 Value Chain/Supply Chain Analysis
4.5 Insights into Industry Policies and Regulations
4.6 Insights into Technological Integration
4.7 Insights into E-commerce Industry in Asia-Pacific