Energy Logistics - Market Share Analysis, Industry Trends & Statistics, Growth Forecasts (2025 - 2030)
상품코드:1636168
리서치사:Mordor Intelligence
발행일:2025년 01월
페이지 정보:영문
라이선스 & 가격 (부가세 별도)
ㅁ Add-on 가능: 고객의 요청에 따라 일정한 범위 내에서 Customization이 가능합니다. 자세한 사항은 문의해 주시기 바랍니다.
ㅁ 보고서에 따라 최신 정보로 업데이트하여 보내드립니다. 배송기일은 문의해 주시기 바랍니다.
한글목차
에너지 물류 시장은 예측 기간 동안 0%의 CAGR을 기록할 것으로 예상됩니다.
주요 하이라이트
국제에너지기구(IEA)에 따르면, 에너지 가격의 급등, 에너지 안보에 대한 우려, 기후 정책의 강화로 인해 천연가스의 10년간의 급격한 성장에 종지부를 찍고 경제 전망은 2021년 전망보다 낙관적이지 않다고 합니다.
석유 수요는 2030년까지 연평균 0.8% 성장하여 피크시 일일 약 1억 3천만 배럴에 달할 것으로 예상되나, EV와 효율 개선으로 인해 수요는 감소할 것으로 보입니다. 석탄은 천연가스 가격 상승에 따라 일부 지역의 에너지 및 산업 부문의 수요가 일시적으로 증가할 것으로 예상되나, 배출가스 감축 노력으로 석탄은 곧 감소세로 전환되어 10년 후에는 현재보다 9% 감소할 것으로 보입니다.
재생에너지, 특히 태양광과 풍력발전은 2023년 세계 발전량의 28%를 차지하던 것이 2030년에는 43%를 차지하게 될 것입니다. 에너지 위기는 수년간 지속되어 온 수요 추세를 바꾸고 있습니다.
세계 가격 상승으로 큰 타격을 입은 산업계는 이제 생산 배분의 현실적인 위험에 직면해 있습니다. 소비자들은 가격 상승에 대응하고 경우에 따라서는 긴급 수요 감소 이니셔티브에 대응하여 에너지 소비 패턴을 재평가하고 있습니다.
정책적 대응은 다양하지만, 대부분 청정에너지에 대한 투자를 가속화하는 데 중점을 두고 있습니다. 이는 에너지 부문의 재생에너지에 대한 강조와 산업 공정, 자동차, 난방의 전기화 가속화를 의미합니다.
위기에 대한 대응의 상당 부분이 세계 기후변화 목표 달성에 필요한 대응과 일치한다는 점에서 에너지 위기는 에너지 안보 증진과 배출량 감축이라는 측면에서 결정적인 순간이 될 수 있습니다.
에너지 물류 시장 동향
석유 및 가스 부문은 호황을 누리고 있습니다.
석유와 가스는 여전히 전 세계적으로 중요한 에너지 공급원이기 때문에 석유 및 가스 부문은 에너지 물류 시장의 중요한 구성요소입니다. 이 부문은 원유, 정유, 천연가스의 운송, 저장, 유통을 포함합니다.
국제에너지기구(IEA)에 따르면 2022-2028년 석유 수요는 석유화학 산업과 항공 산업의 활발한 수요에 힘입어 6% 증가한 1억570만 mmb/d에 달할 것으로 예측됩니다. 그러나 이러한 누적 증가는 연간 수요 증가율이 2023년 약 2.4Mb/d에서 2028년 약 0.4Mb/d로 둔화될 것으로 예상되며, 이는 수요 정점이 임박했음을 의미합니다.
비OPEC 산유국들은 중기적으로 세계 공급능력을 증강할 계획을 가지고 있으며, 미국, 브라질, 가이아나 공화국을 필두로 2028년까지 510만 배럴/일 증가할 것으로 예상되며, OPEC 내 생산능력 증강 계획은 사우디아라비아, 아랍에미리트, 이라크가 주도하고 있으며, 아프리카 및 아시아 회원국은 감소할 것으로 예상됩니다. 아프리카와 아시아 회원국은 계속 감소하고, 러시아의 생산량은 제재로 인해 감소할 것으로 예상됩니다. 이는 예측 기간 동안 OPEC 23개 회원국의 생산능력이 80만 Mb/d 증가할 것임을 의미합니다.
에너지 물류의 석유 및 가스 부문은 다양한 요인의 영향을 받습니다. 시장 수요, 지정학적 요인, 규제 프레임워크는 산업 형성에 중요한 역할을 합니다. 유가 변동, 세계 에너지 정책의 변화, 지정학적 긴장은 석유 및 가스 자원의 운송 및 유통에 영향을 미칠 수 있습니다.
세계 에너지 수요 증가
세계 전력 수요는 2050년 660조 BTU에 달할 것으로 예측되며, 2023년 대비 18% 증가할 것으로 예상됩니다. 주거용 및 상업용 1차 에너지 수요는 에너지 효율 개선으로 인구 증가에 따른 에너지 수요가 감소함에 따라 2050년까지 약 15% 감소할 것으로 예상됩니다.
가장 빠르게 성장하고 있는 에너지 부문은 발전 부문으로, 개발도상국의 안정적인 에너지 접근성 증가가 그 원동력이 되고 있습니다. 전기화의 성장은 선진국의 에너지 효율 개선에 의해 일부 상쇄될 것입니다.
새로운 건물과 인프라의 건설, 인간의 필요를 충족시키는 제품의 생산이 산업 부문의 성장을 뒷받침하고 있습니다.
경제가 성장하고 물자 운송의 필요성이 증가함에 따라 상업용 운송에 대한 수요가 증가하고 있습니다. 그러나 개인 이동의 증가는 효율성 향상과 전기자동차의 증가로 인해 상쇄되고 있습니다.
세계 에너지 소비에서 차지하는 비중은 신흥 경제국의 인구와 경제 성장에 비례하여 계속 증가하여 2050년에는 약 70%에 달할 것으로 예상됩니다.
전 세계 에너지 수요 증가의 100% 이상은 신흥국이 주도하고 있습니다. 에너지 효율 개선은 선진국의 경제 성장률을 상회하며, 과거 경제 성장에 따른 에너지 수요 증가를 상쇄하는 역할을 하고 있으며, 2023년 미국과 유럽에서 소비되는 에너지의 비중을 합치면 2023년 35%에서 2050년 약 20%로 감소할 것으로 예상됩니다.
에너지 물류 산업 개요
에너지 물류 시장의 경쟁 환경은 매우 다양하고 역동적이며, 많은 기업들이 시장 점유율을 놓고 경쟁하고 있습니다.
ExxonMobil, Chevron, BP와 같은 대형 종합 석유회사들은 에너지 물류 시장에서 큰 영향력을 행사하고 있습니다. 이들 기업은 자체 운송 및 물류 부문을 보유하고 있으며, 생산에서 유통까지 전체 공급망을 통제할 수 있습니다. 이들 기업은 파이프라인, 저장 터미널, 유조선 선단 등 광범위한 인프라를 보유하고 있는 경우가 많아 효율성과 비용 효율성 측면에서 경쟁 우위를 점하고 있습니다.
기타 혜택
엑셀 형식의 시장 예측(ME) 시트
3개월간 애널리스트 지원
목차
제1장 소개
조사 가정과 시장 정의
조사 범위
제2장 조사 방법
분석 방법
조사 단계
제3장 주요 요약
제4장 시장 인사이트
시장 개요
현재 시장 시나리오
산업 기술 동향
정부 이니셔티브와 규제
E-Commerce에 관한 인사이트
밸류체인/공급망 분석
수요와 공급 분석
COVID-19의 시장에 대한 영향
제5장 시장 역학
성장 촉진요인
시장을 지지하는 산업의 성장
시장을 견인하는 세계 무역
성장 억제요인
시장에 영향을 미치는 컴플라이언스 과제
한정된 인프라가 시장을 저해
기회
시장을 견인하는 기술의 진보
시장을 견인하는 지속가능한 실천
산업의 매력 - Porter's Five Forces 분석
공급 기업의 교섭력
소비자/구매자의 교섭력
신규 참여업체의 위협
대체품의 위협
경쟁 기업 간의 경쟁 강도
제6장 시장 세분화
용도별
석유 및 가스
재생에너지
발전
에너지 광업
최종사용자별
정부 부문
민간 부문
운송 수단별
철도
항공
도로
수로
제7장 경쟁 구도
기업 개요
ExxonMobil
Chevron
BP
DHL
Kuehne+Nagel
C.H. Robinson
Maersk
Mediterranean Shipping Company(MSC)
COSCO Shipping Lines
TransCanada*
기타 기업
제8장 시장 전망
제9장 부록
ksm
영문 목차
영문목차
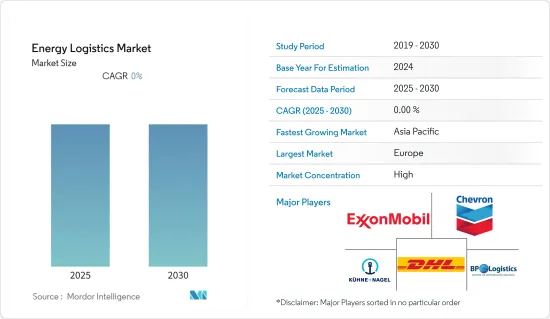
The Energy Logistics Market is expected to register a CAGR of 0% during the forecast period.
Key Highlights
According to the International Energy Agency (IEA), the economic outlook is less optimistic than 2021's outlook, with high energy prices, energy security concerns, and reinforced climate policies ending a decade of rapid growth for natural gas; it is projected to grow at a rate of 0.4% annually between now and 2030 compared to 2.3% between 2010 and 2019.
Oil demand is projected to grow by 0.8% annually to 2030, reaching a peak of around 103 million barrels per day, with EVs and efficiency improvements reducing its demand. Coal is expected to witness a temporary increase in demand from some regions from the energy and industry sectors as natural gas prices rise, but efforts to cut emissions will soon put coal back into decline, ending the decade 9% lower than it is now.
Renewables, particularly solar photovoltaic and wind, will account for 43% of global electricity generation in 2030 compared to 28% in 2023. The energy crisis is changing the demand trends that have long been in place.
Industries that were hit hard by global prices are now facing real risks of production rationing. Consumers are re-evaluating their energy consumption patterns in response to higher prices and, in some cases, to emergency demand reduction initiatives.
While policy responses vary, many are focused on accelerating clean energy investments. This implies an even greater emphasis on renewables in the energy sector and accelerating electrification in industrial processes, cars, and heating.
As many of the responses to the crisis align with those required to achieve global climate objectives, the energy crisis may turn out to be a defining moment in terms of driving energy security and reducing emissions.
Energy Logistics Market Trends
The Oil & Gas Segment is booming
The oil & gas segment is a significant component of the energy logistics market, as oil and gas remain crucial sources of energy globally. This segment involves the transportation, storage, and distribution of crude oil, refined petroleum products, and natural gas.
According to the International Energy Agency (IEA), from 2022 to 2028, the oil demand is projected to grow by 6% to 105.7 Mmb/d, driven by strong demand from the petrochemical and aviation industries. However, this cumulated increase implies that annual demand growth will slow from around 2.4 Mb/d in 2023 to around 0.4 Mb/d in 2028, indicating that the peak demand is just around the corner.
Non-OPEC+ oil-producing countries have plans to increase global supply capacity over the medium term, projected to increase by 5.1 million barrels per day (mb/d) by 2028, led by the United States, Brazil, and the Republic of Guyana. Plans to build capacity within OPEC+ are led by Saudi Arabia, the United Arab Emirates, and Iraq, with African and Asian members expected to continue declining and Russian production declining due to sanctions. This implies a net capacity increase of 0.8 million Mb/d among the 23 members of OPEC+ over the forecast period.
The oil & gas segment of energy logistics is influenced by various factors. Market demand, geopolitical factors, and regulatory frameworks play a significant role in shaping the industry. Fluctuations in oil prices, changes in global energy policies, and geopolitical tensions can impact the transportation and distribution of oil and gas resources.
Increasing Global Demand for Energy
The global electricity demand is projected to reach 660 quadrillion BTUs in 2050, an increase of 18% compared to 2023, driven by population growth and rising prosperity. The demand for residential and commercial primary energy is projected to decline by around 15% by 2050 as improvements in energy efficiency reduce the need for energy from a rising population.
The largest and fastest-growing energy sector is electricity generation, driven by increasing access to reliable energy in developing countries. The growth of electrification is partly offset by improved energy efficiency in developed countries.
The construction of new buildings and infrastructure and the production of products that meet human needs support the growth in the industrial sector.
The demand for commercial transportation is growing as economies expand and the need to transport goods increases. However, the increase in personal mobility is offset by efficiency improvements and an increase in the number of electric vehicles.
The share of global energy consumption continues to grow proportionally to the population and economic growth in developing economies, reaching approximately 70% in 2050.
More than 100% of global energy demand growth is driven by developing countries. Energy efficiency improvements are outpacing economic growth in developed economies, helping to offset energy demand growth that has traditionally been associated with economic growth. The combined percentage of energy consumed in the United States and Europe in 2023 is expected to drop from 35% to around 20% by 2050.
Energy Logistics Industry Overview
The competitive landscape of the energy logistics market is quite diverse and dynamic, with numerous players vying for market shares.
Major integrated oil companies like ExxonMobil, Chevron, and BP have a significant presence in the energy logistics market. These companies have their own transportation and logistics divisions, allowing them to control the entire supply chain from production to distribution. They often have extensive infrastructure, including pipelines, storage terminals, and tanker fleets, giving them a competitive advantage in terms of efficiency and cost-effectiveness.
Additional Benefits:
The market estimate (ME) sheet in Excel format
3 months of analyst support
TABLE OF CONTENTS
1 INTRODUCTION
1.1 Study Assumptions and Market Definitions
1.2 Scope of the Study
2 RESEARCH METHODOLOGY
2.1 Analysis Methodology
2.2 Research Phases
3 EXECUTIVE SUMMARY
4 MARKET INSIGHTS
4.1 Market Overview
4.2 Current Market Scenario
4.3 Technological Trends in the Industry
4.4 Government Initiatives and Regulations
4.5 Insights into the Ecommerce
4.6 Value Chain / Supply Chain Analysis
4.7 Demand and Supply Analysis
4.8 Impact of COVID-19 on the Market
5 MARKET DYNAMICS
5.1 Drivers
5.1.1 Industrial Growth Supporting the Market
5.1.2 Global Trade Driving the Market
5.2 Restraints
5.2.1 Compliance Challenges Affecting the Market
5.2.2 Limited Infrastructure Inhibiting the Market
5.3 Opportunitites
5.3.1 Technological Advancements Driving the Market
5.3.2 Sustainable Practices Driving the Market
5.4 Industry Attractiveness - Porter's Five Forces Analysis
5.4.1 Bargaining Power of Suppliers
5.4.2 Bargaining Power of Consumers / Buyers
5.4.3 Threat of New Entrants
5.4.4 Threat of Substitute Products
5.4.5 Intensity of Competitive Rivalry
6 MARKET SEGMENTATION
6.1 By Application
6.1.1 Oil & Gas
6.1.2 Renewable Energy
6.1.3 Power Generation
6.1.4 Energy Mining
6.2 By End-User
6.2.1 Government Sector
6.2.2 Private Sector
6.3 By Mode of Transport
6.3.1 Railways
6.3.2 Airways
6.3.3 Roadways
6.3.4 Waterways
7 COMPETITIVE LANDSCAPE
7.1 Overview (Market Concentration and Major Players)