South America City Gas Distribution - Market Share Analysis, Industry Trends & Statistics, Growth Forecasts (2025 - 2030)
상품코드:1635513
리서치사:Mordor Intelligence
발행일:2025년 01월
페이지 정보:영문
라이선스 & 가격 (부가세 별도)
ㅁ Add-on 가능: 고객의 요청에 따라 일정한 범위 내에서 Customization이 가능합니다. 자세한 사항은 문의해 주시기 바랍니다.
ㅁ 보고서에 따라 최신 정보로 업데이트하여 보내드립니다. 배송기일은 문의해 주시기 바랍니다.
한글목차
남미의 도시가스 배급 시장은 예측기간 동안 2% 이상의 CAGR을 나타낼 것으로 예상됩니다.
중기적으로는 대체연료로서 천연가스 수요 증가와 석탄·석유에 비해 저탄소 입자를 배출하는 도시가스의 능력이 조사 대상 시장의 성장을 가속할 것으로 예상되는 요인입니다. 한편, 운송부문에서 재생가능연료의 채용이 증가하고 있는 것은 예측기간 중 시장성장을 억제할 것으로 예상됩니다.
CNG를 동력원으로 하는 프로젝트는 도시가스 배급의 진출기업에 광대한 시장을 제공할 가능성이 높습니다. 게다가 이 지역의 급속한 도시화는 앞으로 수년간 남미의 도시가스 공급 시장에 큰 기회를 가져올 것으로 예상됩니다.
브라질은 시장을 독점하고 있으며 예측 기간 동안 가장 높은 CAGR을 나타낼 것으로 예상됩니다. 이 성장은 주로 이 나라의 다양한 부문에서 천연가스 수요 증가가 원동력이 되고 있습니다.
남미의 도시가스 공급시장 동향
전력부문이 시장을 독점
가스 화력 발전소는 가스 화력 발전소 또는 천연 가스 발전소라고도 불리며 천연 가스를 연소시켜 발전하는 화력 발전소입니다. 천연 가스 발전소는 다른 발전소에 비해 저렴한 비용으로 단시간에 건설할 수 있으며 열역학적 효율도 매우 높습니다. 천연가스의 연소에 의해 발생하는 NOx, SOx, 입자상물질 등의 오염물질은 석탄·석유에 비해 적습니다.
콤바인드 사이클 발전소가 보다 효율적인 것은 그렇지 않으면 시스템에서 버려져 버리는 고온의 배기 가스를 이용하기 때문입니다. 터빈을 돌려 더욱 발전하기 때문에 열효율은 최대 60%에 달할 전망입니다.
2021년에는 남미의 다양한 발전시설에서 약 1,364.8TWh의 전력이 발전되었습니다. 이 중 약 20.6%가 천연가스에 의한 발전입니다. 예측 기간 동안 가스 화력 발전소 수요는 증가할 것으로 예상됩니다.
국제에너지기구(IEA)에 따르면 아르헨티나에서는 천연가스(55%)와 석유(33%)가 1차 에너지 믹스의 대부분을 차지하고, 바이오에너지가 5%, 원자력과 수력이 각각 3%를 차지하고 있습니다. 아르헨티나에서 향후 예정된 가스 화력 발전 프로젝트는 조사 대상 시장의 성장을 가속할 것으로 예상됩니다.
2022년 10월, Invenergy는 엘살바도르의 아카프트라 항구에 위치한 Energia del Pacifico(EDP) LNG-to-power 프로젝트의 운영을 시작했습니다. 발전소와 부유식 저장 재기화 유닛을 연결하는 1.8킬로미터의 해저 파이프라인, 230킬로볼트의 송전선 2개(중 1개는 중미 전기 상호 접속 시스템에 접속)를 포함하고 있습니다.
이러한 요인으로부터 남미 각국에서 천연가스를 기반으로 한 발전소의 개발이 진행되고 있으며, 예측기간 중 시장을 독점할 것으로 예상됩니다.
시장을 독점하는 브라질
최근 브라질의 천연가스 수요가 대폭 증가하고 있는 것으로 확인되고 있습니다. 2019년 대비 약 13% 증가 수요 증가는 최종 용도에서 연료로서의 천연가스 소비 증가의 결과이며, 도시가스배급망은 도시에서 천연가스의 효율적인 수송에 필수적이기 때문에 향후 수년간 도시가스배급 수요가 증가할 것으로 예상됩니다.
ABEGAS(브라질 도관가스 판매업체 협회)에 따르면 브라질의 천연가스 소비량은 2021년 28.82% 증가하여 유행 전 수준을 웃돌았습니다. 연 가스 소비량은 열전 부문이 44.7%, 이어 공업 부문(38.66%), 자동차 부문(7.80%), 주택 부문(1.88%), 상업 부문(1.03%), 기타 부문이 되고 있습니다.
게다가 이 나라에서는 천연가스를 기반으로 한 열전 프로젝트에 상당한 투자가 이루어지고 있어 가스배급망의 비즈니스 기회로 이어질 것으로 기대되고 있습니다. 2022년 2월, 브라질 정부는 가스 플랜트 GNA II의 건설과 리오데자네이루의 새로운 천연 가스 처리 시설을 포함한 공공 투자와 민간 투자로 11억 4,000만 달러의 포장을 발표했습니다., SPIC Brasil의 합작 투자인 Gas Natural Acu(GNA) 프로젝트의 일부이며 설비 용량은 1,673MW입니다. II 플랜트는 2025년의 가동과 동시에, 브라질 최대이고 가장 효율적인 천연 가스 플랜트가 될 전망입니다.
2021년 11월, Wartsila는 브라질 광산 에너지부와 브라질에서 총 출력 150MW의 가스 엔진 발전소 3기를 공급하는 계약을 체결했습니다. UTE Luiz Oscar Rodrigues de Melo와 UTE Viana 1, 새로운 발전소 UTE Povoacao1에 EPC(설계·조달·건설) 베이스로 납입됩니다.
브라질국가교통사무국(Senatran)에 따르면 2022년 1분기 천연가스자동차(NGV)로의 개조 대수는 2020년 동기 대비 74% 증가했습니다. 연료가격이 상승한 최초의 해인 2021년에는 86.65% 증가였습니다.
이러한 요인으로부터 천연가스를 베이스로 한 발전소의 개발이 진행되어 천연가스자동차가 증가하고 있기 때문에 예측기간 중에 시장이 확대될 것으로 예상됩니다.
남미의 도시가스 공급산업 개요
남미의 도시가스 공급시장은 부분적으로 통합되어 있습니다. 주요 진입기업(순부동)은 Petroleo Brasileiro SA, Companhia de Gas de Sao Paulo(Comgas), Ipiranga, Naturgy Energy Group SA, Tecpetrol 등이 있습니다.
기타 혜택
엑셀 형식 시장 예측(ME) 시트
3개월간의 애널리스트 서포트
목차
제1장 서론
조사 범위
시장의 정의
조사의 전제
제2장 주요 요약
제3장 조사 방법
제4장 시장 개요
소개
2027년까지 시장 규모와 수요 예측(단위: 10억 달러)
최근 동향과 개발
정부의 규제와 시책
시장 역학
성장 촉진요인
억제요인
공급망 분석
Porter's Five Forces 분석
공급기업의 협상력
소비자의 협상력
신규 참가업체의 위협
대체품의 위협
경쟁 기업간 경쟁 관계
제5장 시장 세분화
유형
압축천연가스(CNG)
파이프라인 천연가스(PNG)
최종 사용자
산업용
전력 섹터
주택 및 상업
운수
지역
브라질
아르헨티나
칠레
기타 남미
제6장 경쟁 구도
M&A, 합작사업, 제휴, 협정
주요 기업의 전략
기업 프로파일
Petroleo Brasileiro SA
Companhia de Gas de Sao Paulo(Comgas)
Ipiranga
Naturgy Energy Group SA
Tecpetrol
GNL Quintero SA
Metrogas SA
Enel SpA
Empresas Gasco SA
Potiguar Gas Company(Potigas)
제7장 시장 기회와 앞으로의 동향
JHS
영문 목차
영문목차
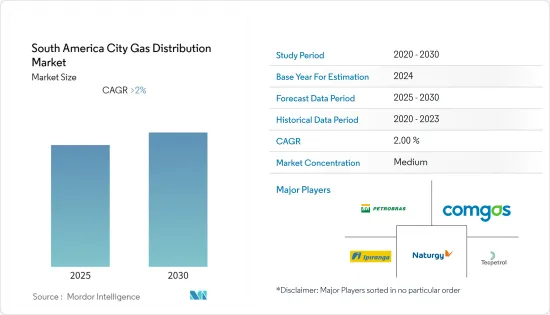
The South America City Gas Distribution Market is expected to register a CAGR of greater than 2% during the forecast period.
Over the medium term, the growing demand for natural gas as an alternative fuel and the ability of city gas to emit low carbon particles compared to coal and oil are factors expected to drive the growth of the market studied. On the other hand, the increasing adoption of renewable fuels in the transportation sector is expected to restrain the growth of the market studied during the forecast period.
Nevertheless, projects using CNG to power will likely provide a vast market for the city gas distribution players. Additionally, the rapid urbanization in the region is expected to create considerable opportunities for the South American city gas distribution market in the coming years.
Brazil dominates the market and is also predicted to witness the highest CAGR during the forecast period. The growth is mainly driven by the increased demand for natural gas from the various sectors in the country.
South America City Gas Distribution Market Trends
Power Sector to Dominate the Market
A gas-fired power plant also called a gas-fired power station or natural gas power station, is a thermal power plant that generates electricity by burning natural gas. Natural gas power plants are low-cost and quick to build and have very high thermodynamic efficiencies compared to other power plants. The burning of natural gas churns out fewer pollutants, such as NOx, SOx, and particulate matter than coal and oil.
Combined cycle plants are more efficient because they utilize hot exhaust gases that would otherwise be discarded from the system. These are then used to boil water into steam, which can then spin another turbine and generate more electricity, resulting in up to 60% thermal efficiency.
In 2021, about 1,364.8 TWh of electricity was generated at various electricity generation facilities in South America. About 20.6% of this electricity generation was from natural gas. In 2021, electricity generated from natural gas was 281.1 TWh, with an increase of 21.2% from 2020. The demand for gas-fired power plants is expected to increase during the forecast period.
According to the International Energy Agency (IEA), in Argentina, natural gas (55%) and oil (33%) constitute the majority of the country's primary energy mix, while bioenergy contributes 5% and nuclear and hydropower each contribute 3%. The upcoming gas-fired power projects in Argentina are expected to drive the growth of the market studied.
In October 2022, Invenergy commissioned operations at the Energia del Pacifico (EDP) LNG-to-power project located at the Port of Acajutla in El Salvador. A natural gas-fired power plant of 380 megawatts (MW) is included in the project, along with a floating storage regasification unit (FSRU), a 1.8-kilometer subsea pipelines connecting the power plant with the floating storage regasification unit, and two 230-kV transmission lines, one of which connects to the Central American Electrical Interconnection System.
Due to these factors, the ongoing developments in power plants based on natural gas in various South American countries are expected to dominate the market during the forecast period.
Brazil to Dominate the Market
Recently, It has been observed that the demand for natural gas in Brazil has increased significantly in recent years. In 2021, the country's total natural gas consumption reached 40.4 billion cubic meters (BCM), representing an increase of about 29% over 2020 and 13% over 2019. The increase in demand is the result of an increase in the consumption of natural gas as a fuel in end-use applications, which, in turn, is expected to increase the demand for city gas distribution in the coming years, since city gas distribution networks are critical for the efficient transportation of natural gas in cities.
According to ABEGAS (Brazilian Association of Piped Gas Distributors), Brazil's Natural Gas consumption grew by 28.82% in 2021, exceeding the pre-pandemic level. The thermoelectric sector consumed 44.7% of Brazil's natural gas in 2021, followed by the industrial sector (38.66%), vehicular (7.80%), residential (1.88%), commercial (1.03%), and other sectors.
Further, the country is witnessing considerable investment in natural gas-based thermoelectric projects, which are expected to create opportunities for gas distribution networks. For instance, in February 2022, The government of Brazil announced a package of USD 1.14 billion in public and private investments, which include the construction of the country's largest gas plant, GNA II, and a new natural gas processing facility in Rio de Janeiro state. Acoording to the mines and energy ministry, the GNA II plant is part of the Gas Natural Acu (GNA) project, a joint venture between Prumo Logistica, BP, Siemens and SPIC Brasil, with a 1,673 MW in installed capacity. The GNA II plant is expected to become Brazil's largest and most efficient natural gas plant upon its inauguration in 2025.
In November 2021, Wartsila signed a contract with the Brazilian Ministry of Mines and Energy to supply three gas engine power plants with a combined output of 150 MW in Brazil. The projects are going to be delivered on Engineering, Procurement, and Construction (EPC) basis to existing power plant sites UTE Luiz Oscar Rodrigues de Melo and UTE Viana 1, as well as a new power plant UTE Povoacao1, all located in EspiritoSanto, a state in Southeast Region of Brazil.
According to the National Traffic Secretariat (Senatran) of Brazil, the number of conversions of cars into natural gas vehicles (NGVs) increased by 74% in the first semester of 2022 as compared to the same period in 2020. In absolute numbers, 67,487 vehicles were modified in 2022, as opposed to 38,747 in 2020. In 2021, the first year of high fuel prices, the increase had been 86.65%. According to Senatran data for June 2022, more than 2.6 million units in Brazil are equipped with NGV equipment.
Because of these factors, the ongoing developments in power plants based on natural gas and increasing natural gas vehicles are expected to propel the market during the forecast period.
South America City Gas Distribution Industry Overview
The South American city gas distribution market is partially consolidated. Some of the major players (in no particular order) are Petroleo Brasileiro SA, Companhia de Gas de Sao Paulo (Comgas), Ipiranga, Naturgy Energy Group SA, and Tecpetrol.
Additional Benefits:
The market estimate (ME) sheet in Excel format
3 months of analyst support
TABLE OF CONTENTS
1 INTRODUCTION
1.1 Scope of the Study
1.2 Market Definition
1.3 Study Assumptions
2 EXECUTIVE SUMMARY
3 RESEARCH METHODOLOGY
4 MARKET OVERVIEW
4.1 Introduction
4.2 Market Size and Demand Forecast in USD billion, till 2027
4.3 Recent Trends and Developments
4.4 Government Policies and Regulations
4.5 Market Dynamics
4.5.1 Drivers
4.5.2 Restraints
4.6 Supply Chain Analysis
4.7 Porter's Five Forces Analysis
4.7.1 Bargaining Power of Suppliers
4.7.2 Bargaining Power of Consumers
4.7.3 Threat of New Entrants
4.7.4 Threat of Substitutes Products and Services
4.7.5 Intensity of Competitive Rivalry
5 MARKET SEGMENTATION
5.1 Type
5.1.1 Compressed Natural Gas (CNG)
5.1.2 Pipeline Natural Gas (PNG)
5.2 End-user
5.2.1 Industrial
5.2.2 Power Sector
5.2.3 Residential and Commercial
5.2.4 Transportation
5.3 Geography
5.3.1 Brazil
5.3.2 Argentina
5.3.3 Chile
5.3.4 Rest of South America
6 COMPETITIVE LANDSCAPE
6.1 Mergers and Acquisitions, Joint Ventures, Collaborations, and Agreements