ㅁ Add-on 가능: 고객의 요청에 따라 일정한 범위 내에서 Customization이 가능합니다. 자세한 사항은 문의해 주시기 바랍니다.
ㅁ 보고서에 따라 최신 정보로 업데이트하여 보내드립니다. 배송기일은 문의해 주시기 바랍니다.
한글목차
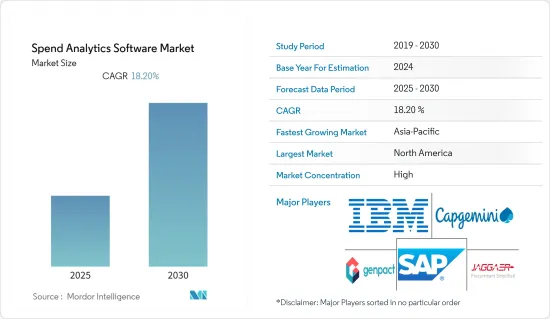
지출 분석 소프트웨어 시장은 예측 기간 동안 18.2%의 연평균 복합 성장률(CAGR)을 나타낼 것으로 예상됩니다.
주요 하이라이트
지출 분석은 데이터 분석 프로세스를 확장하고 데이터에 대한 접근성을 향상시킴으로써 인간과 기계가 지출 데이터와 상호 작용하고 활용하는 방식을 진화시켜왔습니다. 공급망 및 물류, 시장 역학, 제조 및 소매업의 다양한 용도는 시장 역학을 변화시키고 있습니다. 기업이 경쟁 우위를 확보하고 지출 데이터를 보다 효과적으로 활용하고 소비할 수 있도록 돕습니다.
지출 분석의 장점은 데이터 시각화를 통해 더 깊은 통찰력을 제공하고, 비용 절감 프로세스 배포를 지원하며, 대용량 파일에 쉽게 접근할 수 있고, 데이터를 실시간으로 업데이트하고 배치하여 시스템의 확장성을 높일 수 있다는 점입니다. 활용률과 소비율을 향상시켜 조직의 투자 비용을 절감할 수 있습니다.
예를 들어, 지난 3월 AI 기반 지출 관리 및 조달 소프트웨어 회사로 전 세계 수백 개의 지점과 조직에 서비스를 제공하는 Xeeva는 지능형 기회와 함께 지출 분석의 도입과 새로운 모습을 발표했습니다. 사용자 인터페이스가 강화된 새로운 버전을 통해 Xeeva 고객은 용도에서 생성된 절감 및 조달 기회를 조사하고 행동에 옮길 수 있습니다.
또한, 레거시 시스템으로부터의 마이그레이션의 복잡성으로 인해 시장 확대에 걸림돌이 될 수 있습니다. 정의된 프로세스의 부족, 다양한 데이터 소스의 부족, 레거시 시스템으로부터의 마이그레이션의 어려움은 모두 지출 분석 비즈니스의 미래 성장을 저해할 수 있습니다. 또한, 점점 더 엄격해지는 규제 규정은 데이터 보안 및 침해 관련 분석에 대한 지출 시장의 성장을 저해할 수 있습니다.
코로나19가 발생하자 데이터 사이언스 팀은 가용한 방대한 데이터를 분석하여 의사결정자들이 신속하게 비상 대응책을 마련할 수 있도록 신뢰할 수 있는 데이터를 기반으로 최적의 비즈니스 지출 모델을 구축하기 위한 조치를 취하기 시작했습니다. 이를 위해 기업들은 AI, ML, 자연어 처리를 통해 방대한 데이터를 마이닝하고 예측 모델과 처방 모델을 구축했습니다.
코로나19 팬데믹 기간 동안 많은 조직이 예상치 못한 다양한 공급망 혼란을 경험했습니다. 지출 분석을 통해 기업은 더 많은 현금을 보유할 수 있는 분야를 파악할 수 있게 되었습니다. 디지털 솔루션을 기반으로 한 지능적이고 구조화된 지출 분석, 소싱 및 eProcurement 전략은 다양한 어려운 상황에 직면할 수 있는 비상 계획을 활성화하고 배포할 수 있는 통찰력을 적극적으로 제공할 수 있었습니다.
지출 분석 소프트웨어 시장 동향
소매업 및 전자상거래가 큰 성장을 이룰 것으로 예상
소매업 및 전자상거래는 데이터 분석과 함께 조달 및 공급망 관리 시스템에 의존하는 분야입니다. 이 분야의 기업들은 제품 투자에 대한 높은 수익률을 달성하고 비즈니스를 위해 데이터를 빠르고 정확하게 분석하여 조달 및 구매 팀이 적시에 적절한 의사 결정을 내릴 수 있는 솔루션을 채택하고 있습니다. 소매업과 이커머스 부문은 공급망이 최대한의 수익을 창출할 수 있도록 의사결정이 매우 빠른 속도로 이뤄지는 환경입니다.
소매업이 지출 분석을 도입한 최고의 기업 중 하나인 이유 중 하나는 바로 여기에 있습니다. 이러한 도구와 플랫폼은 조달 및 구매 팀이 공급망 내 잠재적인 문제를 식별하는 데 도움이 될 수 있습니다. 소매업체의 이익률은 일반적으로 낮기 때문에 불필요한 지출을 줄이는 것이 필수적입니다. 올바른 지출 결정을 내리기 위해 가장 중요한 것은 지출 데이터가 모든 데이터 소스에서 정확하게 분류되고 최신 상태인지 확인하는 것입니다. 가시성을 확보한 조달팀은 이 데이터를 통해 정보에 입각한 반복 가능한 비용 절감 의사결정을 내릴 수 있습니다.
모든 가전제품과 기기에 블루투스와 와이파이가 통합되면서 데이터 생성 속도와 양이 비약적으로 증가했을 뿐만 아니라 생성되는 데이터의 질도 향상되었습니다. 최근 몇 년동안 기업 간(B2B) 온라인 거래가 크게 증가하면서 대기업의 구매를 위한 전자상거래 조달이 확대되고 있습니다. 이러한 기업들은 새로운 시대의 전자 조달 시스템과 통합할 수 있는 공급망 관리 솔루션의 재구축에 관심을 보이고 있습니다.
클라우드 기반 지출 관리 소프트웨어 회사인 쿠파(Coupa)는 아마존 알렉사(Amazon Alexa)를 통해 음성으로 재고 관리, 상품 검색, 재고 재주문 등 비즈니스 지출 관리(BSM) 솔루션의 기능을 강화했습니다. 잠재력 증가로 인해 기업들이 지출 분석 툴을 신흥 경제 국가로 확대 도입하는 추세입니다.
아시아태평양이 괄목할 만한 성장을 이룰 것으로 예상
아태지역은 기업뿐만 아니라 소비자들 사이에서도 분석 도구의 사용이 증가함에 따라 지출 분석 소프트웨어의 가장 빠르게 성장하는 시장이 될 것으로 예상됩니다. 빅데이터 및 분석 분야의 지출과 수익이 증가하면서 이 지역의 지출 분석 시장을 주도하고 있습니다. 아시아태평양에서 빅데이터 및 분석 솔루션에 가장 큰 투자를 할 가능성이 높은 주요 산업은 은행, 통신, 개별 제조, 중앙 정부, 전문 서비스 등 5개 분야입니다.
이 지역의 분석 시장은 주로 중국, 일본, 인도에서 산업 전반의 디지털화가 주도하고 있습니다. 중국 내 분석의 주요 촉진요인은 인터넷 요금 상승, 모바일 및 스마트폰 보급, 도시화, 머신러닝 개발, 알고리즘 개발, 고객 분석 및 행동 분석의 필요성에 따른 데이터의 폭발적인 증가입니다.
인도 중소기업부의 최근 데이터에 따르면, 인도에는 5,000만 개의 MSME가 있으며, 이는 세계 최대 규모입니다. 정부와 중소기업이 확장 가능한 IT 시스템과 솔루션에 의존하고 있다는 점을 고려하면, 기밀 정보를 다루는 프로세스를 클라우드로 이전하는 것은 이해할 수 있습니다. 아시아태평양에서는 중소기업의 지출 분석에 대한 인식이 높아지면서 경제 성장에 크게 기여하고 있으며, 대부분의 APEC 경제권에서 GDP의 20%에서 50%에 달할 전망입니다. 이 지역에서는 데이터 분석 솔루션에 대한 수요가 증가하고 있습니다.
각국 정부는 클라우드에 대한 기업의 신뢰를 높이기 위해 다양한 이니셔티브를 시행함으로써 아시아태평양의 지출 분석 시장의 향후 성장에 중요한 역할을 하고 있습니다. 홍콩, 싱가포르 등 아시아 국가들은 데이터 프라이버시 규제가 잘 정비되어 있고, 클라우드에 대한 정부의 지원도 확고하며, 클라우드에 대한 대응을 주도하고 있습니다. 많은 외국계 기업들이 아시아태평양의 새로운 비즈니스 기회를 활용하기 위해 현지 기업들과 제휴하고 있습니다. 히타치 밴타라(Hitachi Vantara)는 기술 제품, 서비스 및 솔루션의 엔드투엔드 유통업체로 세계 최고의 기술 데이터(Tech Data)와의 파트너십을 확대했습니다.
지출 분석 소프트웨어 산업 개요
지출 분석 소프트웨어 산업 개요
지출 분석 소프트웨어 시장의 경쟁은 중간 정도이며, 현재 데이터 분석에 대한 기술적 전문성을 가진 소수의 기업이 지배하고 있습니다. 세계 시장은 통합된 성격을 띨 것으로 예상됩니다. 시장 점유율이 큰 대기업들은 시장 점유율과 수익성을 높이기 위해 제품 혁신과 전략적 협업 이니셔티브를 활용하여 다양한 국가에서 고객 기반을 확대하는 데 주력하고 있으며, Genpact Ltd, Capgemini SE, WNS Global Services Pvt. IBM Corporation, SAP SE, Jaggaer Inc., Zycus Inc., Coupa Software Inc. 는 현재 시장에 존재하는 중요한 기업 중 일부입니다.
지난 8월, 조달이 더 나은 조달 결정을 더 빨리 내릴 수 있도록 돕는 소프트웨어 회사인 Archlet과 Sievo는 두 개의 주요 플랫폼을 결합하여 지출 분석부터 소싱 실행, 비용 절감 모니터링에 이르기까지 비즈니스 지출을 전략적으로 관리할 수 있도록 지원하는 새로운 협업을 발표했습니다. 지출 분석부터 소싱 실행, 비용 절감 모니터링까지 전략적으로 관리할 수 있는 새로운 협업을 발표했습니다.
기타 혜택 :
엑셀 형식 시장 예측(ME) 시트
3개월간의 애널리스트 지원
목차
제1장 서론
조사의 전제조건과 시장 정의
조사 범위
제2장 조사 방법
제3장 주요 요약
제4장 시장 인사이트
시장 개요
시장에 대한 COVID-19의 영향에 관한 평가
업계의 매력 - Porter의 Five Forces 분석
신규 진출업체의 위협
구매자/소비자의 교섭력
공급 기업의 교섭력
대체품의 위협
경쟁 기업간 경쟁 관계
제5장 시장 역학
시장 성장 촉진요인
시장 성장 억제요인
제6장 기술 현황
분석 별
기술식
규칙적
예측적
용도별
재무 관리
수요 및 공급 예측
리스크 관리
공급업체 쏘싱 및 퍼포먼스 관리
기타 용도
제7장 시장 세분화
전개 형태별
온프레미스
온클라우드
최종사용자별
헬스케어 및 생명과학
에너지 및 유틸리티
소매 및 E-Commerce
은행/금융서비스/보험(B
제조업
IT 및 통신
기타 최종사용자
지역별
북미
유럽
아시아태평양
라틴아메리카
중동 및 아프리카
제8장 경쟁 구도
기업 개요
Genpact Ltd.
Capgemini SE
WNS Global Services Pvt. Ltd.
IBM Corporation
SAP SE
Jaggaer Inc.
Zycus Inc.
Coupa Software Inc.
Ivalua Inc.
Proactis Inc
GEP Solutions Pvt. Ltd.
Empronc Solutions Pvt. Ltd.
제9장 투자 분석
제10장 투자 분석 시장의 미래
LSH
영문 목차
영문목차
The Spend Analytics Software Market is expected to register a CAGR of 18.2% during the forecast period.
Key Highlights
Spend analytics has evolved how humans and machines interact with and use spend data by broadening the data analysis processes and increasing the accessibility of the data. Its various applications in supply chain and logistics, BFSI, manufacturing, and retail are changing market dynamics. It helps companies to have a competitive advantage and give them better utilization and consumption of spending data.
The benefits of spend analytics include providing more in-depth insight through data visualization, helping deploy cost-saving processes, making large files easy to access, and having data updated and located in real-time, increasing the system's scalability. It reduces the organization's investment by improving utilization and consumption.
For instance, in March last year, Xeeva, the AI-powered spend management and procurement software company that serves hundreds of locations and organizations globally, announced the introduction of Spend Analytics with Intelligent Opportunities and a new look. With an enhanced user interface, this new edition enables Xeeva clients to examine and act on application-generated savings and sourcing opportunities.
Furthermore, market expansion may be hindered by the complexity of migrating from legacy systems. The lack of a defined process, the number of data sources, and the difficulties in transferring from legacy systems can all hamper the future growth of the spend analytics business. Increasingly stringent regulatory rules can also hinder the market for spending on analytics pertaining to data security and breaches.
With the outbreak of COVID-19, the data science teams were called into action to crunch the massive data available and build the best business spending models on trusted data for decision-makers to prepare contingency plans quickly. This is where enterprises used AI, ML, and natural language processing to mine massive data and build predictive or prescriptive models.
Many organizations were experiencing various unexpected and unplanned supply chain disruptions during the COVID-19 pandemic. With spend analytics, companies were better able to identify areas where they could retain more cash. Based on digital solutions, intelligent and structured spend analysis, sourcing, and eProcurement strategies could proactively provide insight to activate and deploy emergency plans to face a range of difficult circumstances.
Spend Analytics Software Market Trends
Retail and E-commerce is Expected to Witness Significant Growth
Retail and e-commerce are sectors dependent on procurement and supply chain management systems, along with data analytics. The companies in this sector attain the highest possible return on investment in their products and, for the business, adopt solutions such that the data is analyzed quickly and accurately so that procurement and buying teams make the right timely decisions. The retail and e-commerce sectors are fast-paced environments to ensure the supply chain is as profitable as possible; decisions are time-critical.
That's one of the reasons why the retail sector is one of the top implementers of spending analytics; these tools and platforms help procurement and buying teams identify potential challenges within their supply chain. The profit margins by which retail-based companies work are usually thin, so it's essential that they reduce, if not eliminate, excess and unnecessary spending. The most critical part of making the right spending decisions is ensuring that spending data is accurately classified and up-to-date from all data sources. Visualized procurement teams can make well-informed and repeatable cost-saving decisions with this data.
The integration of Bluetooth and Wi-Fi in every consumer electronic product and piece of equipment has not only increased the data generation speed and quantity exponentially, Still, it has also improved the quality of the data generated, which is also anticipated to propel the demand for spend analytics, especially in the retail sector. Over the years, business-to-business (B2B) online transactions have seen a significant increase, with growing e-commerce procurement by large organizations for purchasing; these companies are showing interest in reengineering supply chain management solutions to integrate with new-age e-procurement systems.
Coupa, a cloud-based spend management software company, has rolled out enhancements to its business spend management (BSM) solution through voice activation using Amazon Alexa to manage inventory, locate items, and reorder stock. The advancement in IoT technologies and increasing potential among growing economies are also encouraging organizations to expand the adoption of spend analytics tools to developing countries.
Asia-Pacific is Expected to Witness Significant Growth
Asia-Pacific is expected to be the fastest-growing market for spend analytics software, owing to increased take-up of analytics tools among consumers as well as businesses. Spending and revenues are growing in the big data and analytics sectors, driving the spending analytics market in the region. The five potential and leading industries that will make the most significant investments in Asia Pacific's big data and analytics solutions are banking, telecommunications, discrete manufacturing, central government, and professional services.
The analytics markets in the region are primarily driven by full digital deployment across industries, mainly in China, Japan, and India. The primary drivers of analytics in China are the explosion of data due to increasing internet rates, mobile and smartphone penetration, growing urbanization, machine learning development, algorithm development, and the need for customer and behavioral analytics.
According to recent data from the Indian Ministry of Micro, Small, and Medium Enterprises, India has 50 million MSMEs, making it among the world's largest. Given that the government and MSMEs rely on scalable IT systems and solutions, it is understandable that they shift their processes to the cloud with sensitive information. In Asia-Pacific, the increasing awareness of spend analytics among small and medium enterprises contributes significantly to economic growth, with their GDP ranging from 20% to 50% in most APEC economies. The need for data analytics solutions is thriving in the region.
National governments are playing a critical role in the future growth of the Asia-Pacific spend analytics market by implementing various initiatives to increase business confidence in the cloud. Leading the way in cloud readiness are Asian countries such as Hong Kong and Singapore, which have defined data privacy regulations and solid governmental support for the cloud. Many foreign players are teaming up with local players to capitalize on emerging opportunities in Asia-Pacific. Hitachi Vantara, a wholly-owned subsidiary of Hitachi Ltd., expanded its partnership with Tech Data, the leading global end-to-end distributor of technology products, services, and solutions.
Spend Analytics Software Industry Overview
The spending analytics software market is moderately competitive and is currently dominated by a few players with technological expertise in data analytics. The global market is expected to be consolidated in nature. The major players with a significant market share are focusing on expanding their customer base across various countries by leveraging product innovation and strategic collaborative initiatives to increase their market share and profitability. Genpact Ltd., Capgemini SE, WNS Global Services Pvt. Ltd., IBM Corporation, SAP SE, Jaggaer Inc., Zycus Inc., Coupa Software Inc., Ivalua Inc., Proactis Inc., GEP Solutions Pvt. Ltd., and Empronc Solutions Pvt. Ltd. are some of the significant players present in the current market.
In August 2022, Archlet, a software company that helps procurement make better sourcing decisions faster, launched. Sievo announced a new collaboration that would enable procurement to strategically manage business spending from spend analysis through sourcing execution and savings monitoring by combining the two major platforms.
Additional Benefits:
The market estimate (ME) sheet in Excel format
3 months of analyst support
TABLE OF CONTENTS
1 INTRODUCTION
1.1 Study Assumptions and Market Definition
1.2 Scope of the Study
2 RESEARCH METHODOLOGY
3 EXECUTIVE SUMMARY
4 MARKET INSIGHTS
4.1 Market Overview
4.2 Assessment on the Impact of COVID-19 on the Market
4.3 Industry Attractiveness - Porter's Five Forces Analysis