분산형 에너지 자원 관리 시스템 시장 : 점유율 분석, 산업 동향 및 통계, 성장 예측(2025-2030년)
Distributed Energy Resource Management System - Market Share Analysis, Industry Trends & Statistics, Growth Forecasts (2025 - 2030)
상품코드:1690711
리서치사:Mordor Intelligence
발행일:2025년 03월
페이지 정보:영문
라이선스 & 가격 (부가세 별도)
ㅁ Add-on 가능: 고객의 요청에 따라 일정한 범위 내에서 Customization이 가능합니다. 자세한 사항은 문의해 주시기 바랍니다.
ㅁ 보고서에 따라 최신 정보로 업데이트하여 보내드립니다. 배송기일은 문의해 주시기 바랍니다.
한글목차
세계의 분산형 에너지 자원 관리 시스템 시장 규모는 2025년 14억 2,000만 달러로 추정되며, 예측 기간 중(2025-2030년) CAGR 18.31%로 확대되어, 2030년에는 32억 9,000만 달러에 달할 것으로 예측됩니다.
주요 하이라이트
중기적으로는 신재생에너지 기반의 분산형 발전으로의 이동 증가와 스마트 그리드에 대한 투자 증가 등의 요인이 예측기간 동안 분산형 에너지 자원 관리 시스템(DERGMS) 시장의 가장 큰 촉진요인이 될 것으로 예상됩니다.
한편, DERMS 설치에는 높은 초기 비용이 듭니다. 이는 예측 기간 동안 분산 에너지 자원 관리 시스템(DERMS) 시장에 위협을 줄 수 있습니다.
그럼에도 불구하고 아시아태평양과 아프리카의 저전화 지역에서의 분산 발전을 채택하고 서비스로서 마이크로그리드를 개발하는 것은 시장 기회로 작용할 것으로 예상됩니다.
북미는 분산형 발전기술에 대한 정부의 지원정책과 에너지믹스에서의 재생가능에너지 비율 증가로 예측기간 중 최대 시장이 될 것으로 예상됩니다.
분산형 에너지 자원 관리 시스템 시장 동향
시장을 독점하는 태양광 발전(PV) 부문
태양광 발전은 옥상과 지상에 설치할 수 있으며 세계 최대의 분산형 전원 중 하나입니다. 이 부문은 평균 설치 비용(달러/킬로와트) 감소로 인한 설치 용량 증가로 인해 분산 에너지 자원 관리 시스템을 이끌 것으로 예상됩니다. 분산형 에너지 자원 관리 시스템은 태양광 발전(PV)의 출력을 실시간으로 제한하여 역조류나 국소적인 고전압을 방지합니다.
분산형 발전은 경제적으로 실행 가능하며, 동등한 기존 설비보다 상당히 적은 자본으로 끝납니다. 태양광 발전소와 분산형 태양광 발전 모두에 대한 세제 우대 조치가 세계적으로 분산형 태양광 발전을 뒷받침하고 있습니다.
국제재생가능에너지기구(International Renewable Energy Agency)에 따르면 세계의 태양광 발전 설비 용량은 2022년에 1046.61GW에 달할 전망입니다. 전년 대비 연간 성장률은 22.4%로, 정부의 태양광 발전 지원 목표도 있어, 태양광 발전 용량은 앞으로도 증가할 것으로 예상되고, 분산형 에너지 자원 관리 시스템 시장을 견인할 가능성이 있습니다.
태양광발전(PV) 기술은 향후 수년간 풍력과 수력을 크게 웃돌아 자연에너지에서 가장 큰 연간 용량 증가를 차지할 것으로 예상됩니다. IEA에 따르면 태양광 발전은 2022년에 26% 증가하여 1300TWh에 달했으며 모든 재생 가능 기술 중에서 가장 큰 절대적인 발전량의 성장을 보여줍니다. 태양광 발전 비용도 시장에 설비가 넘쳐 지난 6년간 극적으로 하락했습니다. 태양전지판의 가격도 지수적으로 감소하여 태양광 발전 시스템의 설치가 세계적으로 증가했습니다.
주택 및 상업 및 산업(C&I) 분야에서 태양광 발전은 종종 최종 사용자가 설치한 지붕상 태양광 발전(PV)에 의해 수행됩니다. 발전용 태양광 발전 시스템은 에너지를 사용하는 주택과 상업용 건물, 산업 플랜트의 옥상에 설치됩니다. 개별 소유자가 생산한 잉여 에너지는 전력 회사에 판매될 수도 있습니다.
세계의 일부 정부는 국가의 에너지 믹스에서 차지하는 태양에너지의 비율을 늘리기 위해 몇 가지 노력과 정책을 도입하고 있습니다. 이러한 정책은 연구 대상 시장에 긍정적인 영향을 미칠 것으로 예상됩니다. 예를 들면 인도에서는 신재생 가능 에너지성이 2019년에 「계통 연계 지붕상 태양광 발전 스킴(페이즈 II)」을 발표했습니다. 이 계획은 주택 지붕에 태양광 발전 패널을 설치하여 태양광 발전을 수행하는 것을 목표로 합니다. 인도 정부는 이전에 2022년까지 40,000MW의 옥상 태양광 발전(RTS)을 설치하겠다는 목표를 내걸고 있었습니다.
그러나 2023년 1월 인도의 옥상 태양광 발전(RTS) 프로그램은 4년간 연장을 받았으며, 2026년 3월까지 40GW의 옥상 태양광 발전(RTS) 용량 추가라는 목표를 달성하는 것을 목표로 했습니다. 이 프로그램을 통해 인도의 태양에너지 총 용량 목표는 크게 달성 될 것으로 예상됩니다.
이로 인해 태양광 발전에 대한 투자가 증가하고 정부의 규제가 변화하고 향후 프로젝트도 함께 예측 기간 동안 태양광 발전 분야가 최대 시장이 될 것으로 예상됩니다.
시장을 독점하는 북미
북미의 DERMS 시장은 100만대 이상의 분산형 발전 유닛을 가진 미국과 캐나다에 지원되며 예측 기간 동안 최대 시장이 될 것으로 예상됩니다.
발전량이 충분하고 변속기와 배전망을 이용할 수 있음에도 불구하고 이 지역에서는 홍수나 폭풍우 등 자연재해로 인해 정전이 발생하는 지역이 있습니다. 분산 에너지 시스템을 조정하기 위해 DERMS와 같은 원격 전력 시스템을 이용하는 것이 이 문제를 완화할 가능성이 높습니다.
미국은 신재생에너지 목표 달성을 위한 로드맵을 설정하고 있습니다. 연방 정부와 많은 주 정부는 태양에너지 도입을 촉진하는 정책과 프로그램을 시행하고 있습니다. 이러한 우대 조치에는 세액 공제, 보조금, 리베이트, 재생 가능 에너지 포트폴리오 기준 등이 있으며, 전력 회사는 에너지의 일정 비율을 태양광 등의 재생 가능 에너지 자원으로부터 조달해야 합니다.
또한, 태양광 발전 프로젝트 증가에 따라 국내에서는 분산형 에너지 자원 관리 시스템 수요가 높아지고 있습니다.
미국 에너지 정보국(EIA)에 따르면 이 나라의 소규모 태양광 발전 용량은 이 추계를 발표하기 시작한 2014년 7.3GW에서 2022년 39.5GW로 증가했습니다. 소규모 태양광 발전은 미국의 모든 태양광 발전 용량의 약 1/3을 차지합니다.
국제에너지기구(IEA)에 따르면 이 나라의 전기자동차 판매량은 2021년부터 2022년까지 최근에 크게 증가하고 있습니다. PHEV와 BEV의 누적 판매 대수는 2만 7,000대 이상 증가해 지난 10년간 판매 대수가 약 60배 증가한 반면, 이 나라에서는 전기자동차의 보급이 진행되고 있음을 보여주고 있습니다.
마찬가지로 Electric Autonomy의 데이터에 따르면 캐나다에서 공개적으로 사용할 수 있는 전기자동차(EV) 충전 인프라는 꾸준히 증가하고 있습니다. 2023년 3월 1일 현재 캐나다 천연 자원부(NRCan) 통계에 따르면 캐나다 EV 사용자는 전국 8,732개 충전소에서 최소 2만 478개의 충전 커넥터를 사용할 수 있습니다. 이는 2022년 초에 비해 30%라는 상당한 성장률에 해당합니다.
따라서 이러한 요인들로부터 예측기간 동안 북미는 분산 에너지 자원 관리 시스템의 최대 시장이 될 가능성이 높습니다.
분산형 에너지 자원 관리 시스템(DERMS) 산업 개요
분산형 에너지 자원 관리 시스템 시장은 세분화되어 있습니다. 이 시장의 주요 기업(특별한 순서 없음)에는 General Electric Company, Siemens AG, ABB Ltd, Schneider Electric SE, Engie SA 등이 있습니다.
기타 혜택:
엑셀 형식 시장 예측(ME) 시트
3개월간의 애널리스트·지원
목차
제1장 서론
조사 범위
시장의 정의
조사의 전제
제2장 주요 요약
제3장 조사 방법
제4장 시장 개요
소개
2029년까지 시장 규모와 수요 예측
최근 동향과 개발
정부의 규제와 정책
시장 역학
성장 촉진요인
신재생에너지 기반의 분산형 발전으로의 전환 증가
스마트 그리드에 대한 투자 증가
억제요인
집중형 송전망 확장 및 업그레이드
공급망 분석
Porter's Five Forces 분석
공급기업의 협상력
소비자의 협상력
신규 참가업체의 위협
대체품의 위협
경쟁 기업간 경쟁 관계의 강도
제5장 시장 세분화
기술별
태양광 발전(PV)
전기자동차
마이크로그리드
기타 기술
최종 사용자별
산업
주택
상업
지역별
북미
미국
캐나다
기타 북미
유럽
독일
이탈리아
프랑스
영국
기타 유럽
아시아태평양
인도
중국
일본
한국
기타 아시아태평양
남미
브라질
아르헨티나
기타 남미
중동 및 아프리카
아랍에미리트(UAE)
사우디아라비아
사우디아라비아
기타 중동 및 아프리카
제6장 경쟁 구도
M&A, 합작사업, 제휴, 협정
주요 기업의 전략
기업 프로파일
General Electric Company
Siemens AG
ABB Ltd
Schneider Electric SE
Oracle Corporation
Uplight Inc.
Doosan Corporation
Open Access Technology International Inc.
Mitsubishi Electric Corporation
Emerson Electric Co.
Engie SA
제7장 시장 기회와 앞으로의 동향
Micro Grid As A Service
JHS
영문 목차
영문목차
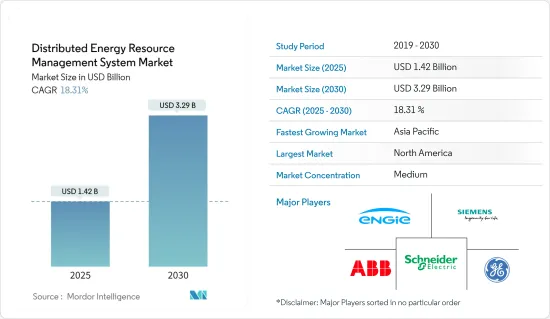
The Distributed Energy Resource Management System Market size is estimated at USD 1.42 billion in 2025, and is expected to reach USD 3.29 billion by 2030, at a CAGR of 18.31% during the forecast period (2025-2030).
Key Highlights
Over the medium term, factors such as an increasing shift toward renewables-based distributed power generation and rising investments in smart grid are expected to be some of the most significant drivers for the distributed energy resource management system (DERMS) market during the forecast period.
On the other hand, there is a high initial cost of setting up DERMS. This may pose a threat to the distributed energy resource management system (DERMS) market during the forecast period.
Nevertheless, the adoption of distributed power generation in the low-electrified areas of Asia-Pacific and Africa and the development of microgrids as a service are expected to act as opportunities in the market.
North America is expected to be the largest market during the forecast period, owing to supportive government policies for distributed power generation technology and the increasing share of renewables in the energy mix.
Distributed Energy Resource Management System Market Trends
Solar Photovoltaic (PV) Segment to Dominate the Market
Solar PV can be located on rooftops or ground-mounted and is one of the largest distributed power sources globally. This segment is expected to drive the distributed energy resources management system with increased installed capacity supported by decreasing average installed cost (USD/kilowatt). Distributed energy resource management systems limit real-time photovoltaic (PV) output to prevent reverse flows and high local voltages.
Distributed generation is economically viable, requiring significantly less capital than an equivalent traditional facility. Tax incentives for both solar stations and distributed solar generation are driving distributed solar PV globally.
According to the International Renewable Energy Agency, the global solar PV installed capacity accounted for 1,046.61 GW in 2022. With an annual growth rate of 22.4% compared to the previous year and supportive solar PV targets of the government, solar PV capacity is expected to increase in the future, which, in turn, may drive the distributed energy resource management system market.
Solar photovoltaic (PV) technology is expected to account for renewables' most considerable annual capacity additions in the coming years, well above wind and hydro as well. According to IEA, solar PV generation increased by 26% in 2022, reaching 1300 TWh, representing the largest absolute generation growth of all renewable technologies. The cost of solar photovoltaics has also reduced dramatically in the past six years as the market was flooded with equipment. The cost of solar panels also dropped exponentially, leading to increased solar PV system installations globally.
In the residential and commercial & industrial (C&I) sector, solar power is often generated by rooftop solar photovoltaics (PV) deployed by end users. Solar PV systems for power generation are installed on rooftops of houses and commercial buildings or industrial plants that use the energy. Excess energy produced by individual owners is sometimes sold to power companies.
Several governments around the world have introduced several initiatives and policies to increase the contribution of solar energy to the country's energy mix. Such policies are expected to have a positive impact on the market studied. For instance, in India, the Ministry of New and Renewable Energy announced the Grid-connected Rooftop Solar Scheme (Phase II) in 2019. The scheme aims to produce solar power by installing solar PV panels on the roofs of houses. The Government of India previously set the goal of installing 40,000 MW of Rooftop Solar (RTS) Power by 2022.
However, in January 2023, India's Rooftop Solar (RTS) program received a four-year extension and aimed to accomplish its target of 40 GW rooftop solar (RTS) capacity addition by March 2026. This program is expected to achieve India's total solar energy capacity target significantly.
Therefore, with increased investment in solar PV and changing government regulations, coupled with upcoming projects, the solar PV segment is expected to be the largest market during the forecast period.
North America to Dominate the Market
The North American DERMS market is further expected to be the largest market during the forecast period, supported by the United States and Canada, which have more than a million distributed generation units.
Despite enough power generation and accessibility of transmission and distribution networks, power outages are caused in some areas of the region due to natural disasters, such as flooding and storms. The use of remote power systems, such as DERMS, to regulate distributed energy systems is likely to mitigate the issue.
The United States has set a road map to achieve renewable energy targets. The federal government and many state governments have implemented policies and programs to promote the adoption of solar energy. These incentives include tax credits, grants, rebates, and renewable portfolio standards that need utilities to receive a certain percentage of their energy from renewable sources like solar.
Moreover, as the number of solar projects increases, the companies increase demand for distributed energy resources management systems in the country.
According to the US Energy Information Administration (EIA), the country's small-scale solar capacity grew from 7.3 GW in 2014, when they began publishing these estimates, to 39.5 GW in 2022. Small-scale solar accounts for approximately one-third of all solar capacity in the United States.
According to the International Energy Agency (IEA), electric vehicle sales in the country have increased significantly in recent years between 2021 and 2022; the cumulative sales of PHEV and BEV increased by more than 27,000 units, whereas in the past decade, sales increased by almost 60 folds signifying the increasing adoption of electric vehicles in the country.
Similarly, Canada's publicly available electric vehicle (EV) charging infrastructure is on a steady rise, as indicated by data compiled by Electric Autonomy. As of March 1, 2023, Natural Resources Canada (NRCan) statistics revealed that Canadian EV users can avail themselves of at least 20,478 charging connectors distributed across 8,732 charging station sites nationwide. This represents a substantial percentage growth rate of 30% since the beginning of 2022.
Therefore, based on these factors, North America is likely to be the largest market for distributed energy resource management systems during the forecast period.
Distributed Energy Resource Management System (DERMS) Industry Overview
The distributed energy resource management system market is semi-fragmented. Some of the major players in the market (in no particular order) include General Electric Company, Siemens AG, ABB Ltd, Schneider Electric SE, and Engie SA.
Additional Benefits:
The market estimate (ME) sheet in Excel format
3 months of analyst support
TABLE OF CONTENTS
1 INTRODUCTION
1.1 Scope of the Study
1.2 Market Definition
1.3 Study Assumptions
2 EXECUTIVE SUMMARY
3 RESEARCH METHODOLOGY
4 MARKET OVERVIEW
4.1 Introduction
4.2 Market Size and Demand Forecast, till 2029
4.3 Recent Trends and Developments
4.4 Government Policies and Regulations
4.5 Market Dynamics
4.5.1 Drivers
4.5.1.1 Increasing Shift Toward Renewables-based Distributed Power Generation
4.5.1.2 Rising Investments in Smart Grid
4.5.2 Restraints
4.5.2.1 Expansion and Upgradation of Centralized Grid
4.6 Supply Chain Analysis
4.7 Porter's Five Forces Analysis
4.7.1 Bargaining Power of Suppliers
4.7.2 Bargaining Power of Consumers
4.7.3 Threat of New Entrants
4.7.4 Threat of Substitute Products and Services
4.7.5 Intensity of Competitive Rivalry
5 MARKET SEGMENTATION
5.1 By Technology
5.1.1 Solar Photovoltaic (PV)
5.1.2 Electric Vehicles
5.1.3 Microgrids
5.1.4 Other Technologies
5.2 By End User
5.2.1 Industrial
5.2.2 Residential
5.2.3 Commercial
5.3 By Geography
5.3.1 North America
5.3.1.1 United States
5.3.1.2 Canada
5.3.1.3 Rest of North America
5.3.2 Europe
5.3.2.1 Germany
5.3.2.2 Italy
5.3.2.3 France
5.3.2.4 United Kingdom
5.3.2.5 Rest of Europe
5.3.3 Asia-Pacific
5.3.3.1 India
5.3.3.2 China
5.3.3.3 Japan
5.3.3.4 South Korea
5.3.3.5 Rest of Asia-Pacific
5.3.4 South America
5.3.4.1 Brazil
5.3.4.2 Argentina
5.3.4.3 Rest of South America
5.3.5 Middle East and Africa
5.3.5.1 United Arab Emirates
5.3.5.2 Saudi Arabia
5.3.5.3 Saudi Arabia
5.3.5.4 Rest of Middle East and Africa
6 COMPETITIVE LANDSCAPE
6.1 Mergers and Acquisitions, Joint Ventures, Collaborations, and Agreements