세계 자가발전소 시장 : 점유율 분석, 산업 동향,통계, 성장 예측(2024년-2029년)
Captive Power Plant - Market Share Analysis, Industry Trends & Statistics, Growth Forecasts (2024 - 2029)
상품코드:1431742
리서치사:Mordor Intelligence
발행일:2024년 02월
페이지 정보:영문
라이선스 & 가격 (부가세 별도)
ㅁ Add-on 가능: 고객의 요청에 따라 일정한 범위 내에서 Customization이 가능합니다. 자세한 사항은 문의해 주시기 바랍니다.
ㅁ 보고서에 따라 최신 정보로 업데이트하여 보내드립니다. 배송기일은 문의해 주시기 바랍니다.
한글목차
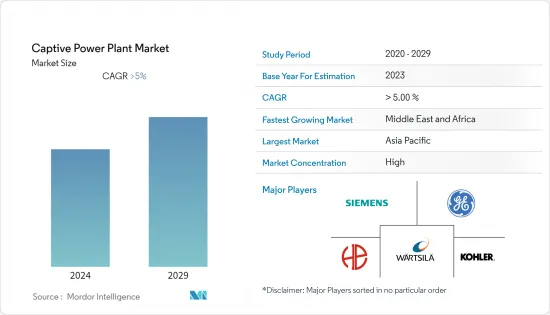
Equal-6.41로 환산한 캡티브발전소 시장 규모는 예측기간 중(2024-2029년) 복합 연간 성장률(CAGR) 6.41%를 나타낼 전망이고 2024년 2,141억 2,000만 달러에서 2029년 2,921억 4,000만 달러로 성장할 것으로 예측됩니다.
주요 하이라이트
중기적으로는 발전산업은 대부분의 국가에서 확립되어 있지만, 전력회사가 24시간 체제로 고품질의 전력을 산업용 유저에게 공급하기에는 한계가 있기 때문에 산업계는 자가발전소를 설립하지 않을 수 없습니다. 또한 이러한 산업 중 일부는 원격지에 있으며, 전력 공급의 신뢰성이 낮다(특히 개발도상국 및 저개발 국가)는 자가발전소의 설치를 촉진하는 요인이 되고 있습니다.
한편, 높은 자본 지출과 운전 경비는 세계 저개발 지역에서 자가발전소의 성장을 제한하고 있습니다.
그럼에도 불구하고, 나이지리아, 앙골라, 가나와 같은 아프리카 국가에서 에너지 집약적 산업의 확대는 가까운 미래에 자가발전소의 설비 제조업체와 개발자에게 큰 기회를 제공할 것으로 기대되고 있습니다.
아시아태평양은 자가발전소 시장을 독점하고 있으며, 수요의 대부분은 중국, 인도, 일본 때문입니다.
자가발전소 시장 동향
시장에서 큰 점유율을 차지하는 철강 산업
대규모 제철소를 운영할 때 신뢰할 수 있는 전원을 확보하는 것이 매우 중요합니다. 철강 플랜트의 배전 시스템은 부하의 특성과 그 크기 때문에 다른 산업 플랜트의 배전 시스템과 다릅니다. 대규모 종합 철강 플랜트는 다양한 가공 플랜트, 비가공 플랜트, 서비스 및 유틸리티로 구성되어 있다는 것은 상식입니다.
철강 플랜트는 고액의 자본 지출을 필요로 하는 연속 공정 플랜트이기 때문에 전력망의 설계는 전력 품질 저하에 의한 계통 정전, 전력 기기의 고장, 전력 계통의 내부 장애 등 모든 사태에 적절하게 대처 가능한 한 중요성의 관점에서 고려해야합니다. 기기나 부속품의 선정이나 사이징에 제약이 있으면, 생산이 손실되는 결과, 경제적 손실에 수반하는 막대한 자본적 손해가 발생하게 되어, 결과적으로 막대한 자본적 손해를 입게 될까 아닙니다.
또한 현대 생활의 대부분은 철강으로 구성되어 있습니다. 인프라, 건물, 기계, 전기 장비, 자동차, 조리 기구에서 가구에 이르기까지 다양한 제품에 많은 양의 철강이 필요합니다. 철강 수요는 2050년까지 5배가 될 것으로 추정됩니다.
세계는 현대화 과정에서 방대한 철강 생산 능력을 구축해 왔습니다. 세계철강협회에 따르면 2022년 철강 생산량은 약 18억 8,500만톤(MT)으로 2012년부터 약 20.6% 증가했습니다.
다양한 정책의 결과, 다자간 협력 프로세스를 통한 제조거점의 확대, 노하우 공유, 제품 개발, 기술 이전으로 국산화가 촉진됩니다.
예를 들어, 2022년 10월, ArcelorMittal 산하의 AMNS India는 인도의 하질라 제철소에 76억 2,000만 달러의 투자를 발표했습니다. 이 투자로 이 공장의 생산 능력은 현재 900만 톤에서 1,500만 톤으로 증가할 전망입니다. 게다가 이 투자에는 새로운 제철 기술의 도입, 새로운 시대의 기계 설치, 제품 제공 확대도 포함됩니다.
2022년 7월 인도네시아 Krakatau Steel과 한국 POSCO Holdings는 인도네시아 철강 생산 능력 확대에 35억 달러를 투자하기로 합의했습니다. 이 합의에 의해 쿠라카타우 포스코의 가와카미, 다운스트림 제품의 생산 능력은 연간 1,000만 톤으로 확대됩니다. 2023년부터의 확장에는 전기 자동차용 자동차용 강철의 제조도 포함됩니다.
이 지역에서의 철강,철강산업의 발전과 투자를 고려하면 용량발전소 수요는 예측기간 중에 대폭적인 성장이 예상됩니다.
아시아태평양이 시장을 독점
아시아태평양은 2022년에 자가발전소 시장을 독점할 것으로 예상되며 앞으로 수년간에도 지배력을 유지할 것으로 예상됩니다. 인구 증가, 급속한 도시화, 산업화 등의 요인이 이 지역의 전력 수요를 견인해 용량 확대의 큰 기회를 창출하고 있습니다.
GDP에서 중국은 세계 2위 경제대국입니다. 2022년 이 나라의 GDP는 약 0.8% 성장하여 17조 9,600억 달러에 달했습니다. 고령화가 진행되면서 제조업에서 서비스업으로, 외수에서 내수로, 투자에서 소비로 경제의 리밸런스가 진행되는 가운데, 이 나라의 성장은 서서히 쇠퇴하고 있습니다.
중국은 화학, 석유 및 가스, 금속 가공 및 기타 분야의 현저한 성장으로 자가발전소의 가장 크고 급성장 시장 중 하나가 될 것으로 예상됩니다. 게다가 자가발전소는 이러한 산업에서 중요한 역할을 하고 있기 때문에 예측기간 동안에도 비슷한 성장이 예상됩니다.
철강 산업은 자가발전소의 중요한 시장입니다. 세계철강협회에 따르면 2022년 중국의 철강 생산량은 약 10억 1,800만 톤으로 세계 철강 생산량의 약 54%를 차지하고 있습니다.
또한 석유화학산업은 중국 경제에 크게 기여하고 있으며 제조업의 고품질 발전을 지원하는 주요 분야이기도 합니다. 최근 중국은 석유화학 부문의 발전을 목격하고 있습니다. 예를 들어, 2023년 3월, 아람코와 합작 파트너인 반금신성실업집단과 NORINCO그룹은 중국 북동부에서 대규모 석유 정제와 석유화학의 통합 콤플렉스 건설을 시작할 계획을 발표했습니다. 이 콤플렉스는 닛산 30만 배럴의 정유소와 연산 165만톤의 에틸렌과 200만톤의 파라크실렌을 생산하는 석유화학 플랜트를 겸비할 예정입니다. 건설은 프로젝트가 행정허가를 확보한 후 2023년 2분기에 시작될 예정입니다. 2026년까지 풀 가동할 예정입니다.
한국도 석유화학 사업에 투자하고 있으며, 자가발전소 수요 증가가 전망되고 있습니다. 2022년 11월, 사우디 아람코는 고가의 석유화학제품을 생산하기 위해 항만도시 울산에 있는 한국 계열사 공장에 약 70억 달러의 투자 계획을 발표했습니다. 이 회사에 따르면, 샤힌 프로젝트는 세계 최대의 석유 정제 통합 석유 화학 증기 크래커를 개발하기 위해 아시아 국가에서 사우디에서 가장 큰 투자입니다.
따라서 철강, 석유화학산업의 이러한 추세로 인해 자가발전소 수요가 예측 기간 동안 크게 증가할 것으로 예상됩니다.
자가발전소 산업 개요
자가발전소 시장은 통합되어 있습니다. 이 시장의 주요 기업(순부동)에는 Kohler Co., General Electric Company, Wartsila Oyj Abp, Bharat Heavy Electricals Limited, Siemens AG 등이 있습니다.
기타 혜택:
엑셀 형식 시장 예측(ME) 시트
3개월간의 애널리스트,지원
목차
제1장 서론
조사 범위
시장의 정의
조사의 전제
제2장 조사 방법
제3장 주요 요약
제4장 시장 개요
소개
2028년까지 시장 규모 및 수요 예측(단위: 달러)
최근의 동향과 전개
정부의 규제와 정책
시장 역학
성장 촉진요인
산업분야에서의 전력 수요 증가
여러 산업의 원격지와 전력 공급의 불안정성
억제요인
높은 설비투자와 운용비
공급망 분석
Porter's Five Forces 분석
공급기업의 협상력
소비자의 협상력
신규 참가업체의 위협
대체품의 위협
경쟁 기업간 경쟁 관계의 강도
제5장 시장 세분화
연료원
석탄
가스
디젤
재생 가능
기타 연료
산업
시멘트
철강
금속 및 광물
석유화학
기타
지역
북미
미국
캐나다
기타 북미
유럽
독일
프랑스
영국
기타 유럽
아시아태평양
중국
인도
일본
한국
기타 아시아태평양
남미
브라질
아르헨티나
기타 남미
중동 및 아프리카
사우디아라비아
아랍에미리트(UAE)
남아프리카
기타 중동 및 아프리카
제6장 경쟁 구도
M&A, 합작사업, 제휴, 협정
주요 기업의 전략
기업 프로파일
Kohler Co.
General Electric Company
Wartsila Oyj Abp
Siemens AG
Bharat Heavy Electricals Limited
Tata Power Renewable Energy
AMP Solar Group Inc.
제7장 시장 기회와 앞으로의 동향
BJH
영문 목차
영문목차
The Captive Power Plant Market size in terms of Equal-6.41 is expected to grow from USD 214.12 billion in 2024 to USD 292.14 billion by 2029, at a CAGR of 6.41% during the forecast period (2024-2029).
Key Highlights
Over the medium term, though the power generation industry is well-established in most countries, the limitations that the utilities have to provide high-quality power round the clock to the industrial users force the industries to establish captive power plants. Moreover, the remote location of some of these industries and the unreliability of the power supply (especially in developing and underdeveloped countries) are the factors promoting the installation of captive power plants.
On the other hand, high capital and operational expenditures are limiting the growth of captive power plants in underdeveloped regions across the world.
Nevertheless, the expansion of energy-intensive industries in African countries such as Nigeria, Angola, and Ghana is expected to provide a significant opportunity for captive power plant equipment manufacturers and developers in the near future.
Asia-Pacific has dominated the captive power plant market, with the majority of the demand coming from China, India, and Japan.
Captive Power Plant Market Trends
Steel Industry to Have Significant Share in the Market
It is very important to have a reliable power source when operating a large-scale steel plant. The distribution system for power in a steel plant is different from that of any other industrial plant because of the nature of the load and its magnitude. It is common knowledge that large-scale integrated steel plants consist of a variety of processing plants, nonprocessing plants, services, and utilities.
Since steel plants are continuous process plants requiring high capital expenditure, power network design should be viewed from a criticality perspective to ensure that any eventuality such as grid power failure, power equipment failure and internal power system disturbances due to poor power quality is adequately addressed. A constraint in selection and sizing of equipment and accessories cannot result in a massive capital damage associated with financial loss as a result of lost production, resulting in huge capital damage.
Further, a large portion of modern life is comprised of steel. Infrastructure, buildings, machinery, electrical equipment, automobiles, and various products, from cookware to furniture, require large amounts of iron and steel. It is estimated that the steel demand will increase by five times by 2050.
The world has built an enormous capacity for iron and steel during its modernization process. According to World Steel Association, in 2022, the steel production was around 1,885 million tons (MT), with an increase of around 20.6% from 2012.
As a result of various policy, indigenous manufacturing will be encouraged by widening the manufacturing base, sharing know-how, product development, and technological transfer through a multilateral collaboration process.
For instance, in October 2022, AMNS India, an arm of ArcelorMittal, announced an investment of USD 7.62 billion in its Hazira steel plant in India. This investment is expected to increase the plant's capacity to 15 million tons, which is currently 9 million tons. Additionally, the investment will include the installation of new steel-making technologies, the setting up of new-age machinery, and the expansion of product offerings.
In July 2022, Indonesia's Krakatau Steel and South Korea's POSCO Holdings agreed to invest USD 3.5 billion in expanding their steel production capacity in Indonesia. KRAKATAU POSCO's production capacity for upstream and downstream products will be increased to 10 million tonnes per year under the agreement. Starting in 2023, the expansion includes manufacturing automotive steel for electric vehicles.
Considering the developments and investments in the steel and iron industry in the region, the demand for capative power plants is expected to witness significant growth during the forecast period.
Asia-Pacific to Dominate the Market
Asia-Pacific is expected to dominat the captive power plant market in 2022, and is expected to continue its dominance in the coming years as well. Factors such as growing population, rapid urbanization, and industrialization are driving the power demand in the region, creating significant opportunities for capacity expansion.
In terms of GDP, China is the second-largest economy in the world. In 2022, the country's GDP grew by about 0.8%, reaching USD 17.96 trillion. The growth in the country is gradually diminishing as the aging population, manufacturing to services, and external to internal demand, and the economy is rebalancing from investment to consumption.
China is expected to be one of the largest and fastest-growing markets for captive power plants, owing to the significant growth in its chemical, oil & gas, metals processing, and other sectors. Further, it is expected to continue to witness similar growth during the forecast period, as captive power plants play a crucial role in these industries.
The iron and Steel industry is a significant market for captive power plants. According to World Steel Association, in 2022, the steel production in China was approximately 1,018 million tons, around 54% of the global steel production.
Further, the petrochemical industry is a significant contributor to China's economy and a key field for supporting the high-quality development of the manufacturing sector. Recently, China is witnessing developments in the petrochemical sector. For instance, in March 2023, Aramco and joint venture partners Panjin Xincheng Industrial Group and NORINCO Group announced plans to start the construction of a significant integrated refinery and petrochemical complex in northeast China. The complex is going to have combination of a 300,000 barrels per day refinery and a petrochemical plant with an annual production capacity of 1.65 million tons of ethylene and 2 million metric tons of paraxylene. Construction is expected to start in the second quarter of 2023 after the project has secured administrative approvals. It is expected to be fully operational by 2026.
South Korea is also investing in its petrochemical business which is anticipated to create a rising demand for captive power plants. In November 2022, Saudi Aramco announced investment plans for about USD 7 billion at a South Korean affiliate's factory in the port city of Ulsan to produce more high-value petrochemical products. According to the company, the Shaheen project is Saudi's biggest investment in the Asian nation to develop one of the world's largest refinery-integrated petrochemical steam crackers.
Hence, with these trends from the steel, and petrochemical industries, the demand for captive power plants is anticipated to increase significantly during the forecast period.
Captive Power Plant Industry Overview
The captive power plant market is consolidated. Some of key players in this market (not in particular order) include Kohler Co., General Electric Company, Wartsila Oyj Abp, Bharat Heavy Electricals Limited, and Siemens AG., among others.
Additional Benefits:
The market estimate (ME) sheet in Excel format
3 months of analyst support
TABLE OF CONTENTS
1 INTRODUCTION
1.1 Scope of the Study
1.2 Market Definition
1.3 Study Assumptions
2 RESEARCH METHODOLOGY
3 EXECUTIVE SUMMARY
4 MARKET OVERVIEW
4.1 Introduction
4.2 Market Size and Demand Forecast in USD, till 2028
4.3 Recent Trends and Developments
4.4 Government Policies and Regulations
4.5 Market Dynamics
4.5.1 Drivers
4.5.1.1 Increasing Power Demand across Industrial Sector
4.5.1.2 Remote Location of Several Industries and the Unreliability of the Power Supply
4.5.2 Restraints
4.5.2.1 High Capital and Operational Expenditures
4.6 Supply Chain Analysis
4.7 Porter's Five Forces Analysis
4.7.1 Bargaining Power of Suppliers
4.7.2 Bargaining Power of Consumers
4.7.3 Threat of New Entrants
4.7.4 Threat of Substitutes Products and Services
4.7.5 Intensity of Competitive Rivalry
5 MARKET SEGMENTATION
5.1 Fuel Source
5.1.1 Coal
5.1.2 Gas
5.1.3 Diesel
5.1.4 Renewable
5.1.5 Other Fuel Sources
5.2 Industry
5.2.1 Cement
5.2.2 Steel
5.2.3 Metal & Minerals
5.2.4 Petrochemicals
5.2.5 Others
5.3 Geography
5.3.1 North America
5.3.1.1 United States
5.3.1.2 Canada
5.3.1.3 Rest of North America
5.3.2 Europe
5.3.2.1 Germany
5.3.2.2 France
5.3.2.3 United Kingdom
5.3.2.4 Rest of Europe
5.3.3 Asia-Pacific
5.3.3.1 China
5.3.3.2 India
5.3.3.3 Japan
5.3.3.4 South Korea
5.3.3.5 Rest of Asia-Pacific
5.3.4 South America
5.3.4.1 Brazil
5.3.4.2 Argentina
5.3.4.3 Rest of South America
5.3.5 Middle-East and Africa
5.3.5.1 Saudi Arabia
5.3.5.2 United Arab Emirates
5.3.5.3 South Africa
5.3.5.4 Rest of Middle-East and Africa
6 COMPETITIVE LANDSCAPE
6.1 Mergers and Acquisitions, Joint Ventures, Collaborations, and Agreements
6.2 Strategies Adopted by Leading Players
6.3 Company Profiles
6.3.1 Kohler Co.
6.3.2 General Electric Company
6.3.3 Wartsila Oyj Abp
6.3.4 Siemens AG
6.3.5 Bharat Heavy Electricals Limited
6.3.6 Tata Power Renewable Energy
6.3.7 AMP Solar Group Inc.
7 MARKET OPPORTUNITIES AND FUTURE TRENDS
7.1 Expansion of Energy Intensive Industries in African Countries such as Nigeria, Angola, And Ghana