Enterprise Asset Management Market by Asset Class, Application - Global Forecast to 2030
상품코드:1812622
리서치사:MarketsandMarkets
발행일:2025년 09월
페이지 정보:영문 261 Pages
라이선스 & 가격 (부가세 별도)
ㅁ Add-on 가능: 고객의 요청에 따라 일정한 범위 내에서 Customization이 가능합니다. 자세한 사항은 문의해 주시기 바랍니다.
한글목차
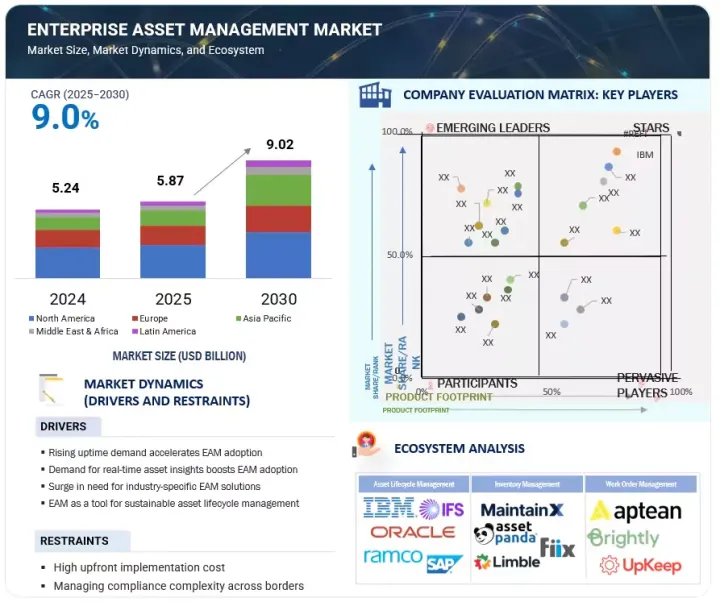
세계의 기업 자산 관리(EAM) 시장은 빠르게 확대하고 있으며, 시장 규모는 2025년 약 58억 7,000만 달러에서 2030년까지 90억 2,000만 달러에 달할 것으로 예측되며, CAGR로 9.0%의 성장이 전망됩니다.
자산 집약적 산업에서 규제 준수 및 안전 관리에 대한 수요가 증가함에 따라 EAM 솔루션의 채택이 증가할 것으로 예상됩니다.
조사 범위
조사 대상 연도
2020-2030년
기준 연도
2024년
예측 기간
2025-2030년
단위
100만 달러/10억 달러
부문
제공, 용도, 전개 방식, 자산 클래스, 조직 규모, 업계
대상 지역
북미, 유럽, 아시아태평양, 중동 및 아프리카, 라틴아메리카
에너지, 의료, 운송 부문은 설비 안전, 환경 기준, 업무 보고에 대한 엄격한 규정 준수 요구사항에 직면해 있습니다. EAM 솔루션은 조직이 정확한 감사 추적을 유지하고, 검사를 추적하고, 자산이 규제 기준을 충족하는지 확인하고, 법적 리스크를 줄이고, 이해관계자의 신뢰를 향상시키는 데 도움이 됩니다.
반면, 다양한 레거시 시스템 및 사일로화된 업무의 데이터 통합이 큰 걸림돌로 작용하고 있습니다. 많은 기업, 특히 노후화된 인프라를 가진 기업들은 여러 플랫폼, 수동 기록, 오래된 장비 모니터링 시스템의 데이터를 통합하는 데 어려움을 겪고 있습니다. 이러한 복잡성으로 인해 EAM의 도입이 늦어지고, 예측 분석, 실시간 모니터링과 같은 고급 기능을 활용할 수 있는 능력이 제한되고 있습니다. 이러한 요인들은 규제적 요구가 채택을 촉진하는 한편, 통합의 장애물이 원활한 도입을 가로막는 장벽이 되고 있음을 강조합니다.
"조직 규모별로는 중소기업 부문이 예측 기간 동안 가장 높은 CAGR로 성장할 것으로 보입니다."
이러한 성장의 원동력은 클라우드 기반 디지털 EAM 솔루션의 채택이 증가하고 있으며, 이러한 솔루션은 중소기업에 확장 가능하고, 비용 효율적이며, 쉽게 배포할 수 있는 옵션을 제공하고 있습니다. 중소기업에서는 설비 이용 최적화, 다운타임 감소, 업무 효율성 향상을 위해 자산 관리에 대한 투자가 증가하고 있지만, 한정된 리소스에 맞는 솔루션이 필요합니다. 구독 기반의 모듈형 EAM이 제공되기 때문에 중소기업은 많은 선투자없이 예지보전, 실시간 모니터링, 분석 등의 고급 기능을 이용할 수 있습니다.
또한, 중소기업의 디지털 전환, 규제 준수 및 지속가능성 이니셔티브의 추진은 EAM 솔루션에 대한 수요를 더욱 촉진하고 있으며, 이 부문은 예측 기간 동안 시장에서 가장 빠르게 성장하는 조직 범주로 부상할 것으로 예상됩니다.
"제조 산업 부문이 예측 기간 동안 가장 큰 시장 점유율을 차지할 것으로 예상됩니다."
제조는 기계, 생산 라인, 산업 설비에 크게 의존하는 자산 집약적인 부문으로, 다운타임과 비효율성이 생산량과 수익성에 직접적인 영향을 미칠 수 있습니다. EAM 솔루션은 제조업체가 자산 활용을 최적화하고, 장비 성능을 모니터링하며, 계획되지 않은 다운타임을 줄이기 위한 예방적 유지보수 전략을 실행할 수 있도록 도와줍니다. 인더스트리 4.0과 스마트 팩토리 개념의 부상으로 제조업체들은 커넥티드 디바이스, 디지털 트윈, 자동화 시스템의 실시간 데이터를 통합하는 IoT 지원 EAM 플랫폼을 점점 더 많이 채택하고 있습니다.
이러한 기능을 통해 예측적 고려, 품질 관리 개선, 생산 주기 전반에 걸친 워크플로우 간소화를 실현할 수 있습니다. 예를 들어, 2024년 6월, Godrej & Boyce는 HxGN EAM을 도입하여 장비 가동률을 60%에서 95%로 향상시키고, 작업자 가동률을 70% 향상시켰으며, 재고 비용을 45% 절감했습니다. 이러한 개선은 업무 효율성 향상, 생산성 향상, 비용 절감, 장기적인 수익성 향상으로 이어지고 있습니다. 또한, 제조 부문의 엄격한 안전 및 환경 규제 준수에 따라 강력한 자산 관리 솔루션에 대한 요구가 더욱 높아지고 있습니다.
세계의 기업 자산 관리(EAM) 시장에 대해 조사 분석했으며, 주요 촉진요인과 억제요인, 경쟁 구도, 향후 동향 등의 정보를 전해드립니다.
목차
제1장 소개
제2장 조사 방법
제3장 주요 요약
제4장 중요한 인사이트
기업 자산 관리(EAM) 시장 기업에서 매력적인 기회
기업 자산 관리(EAM) 시장 : 서비스별(2025년·2030년)
기업 자산 관리(EAM) 시장 : 용도별(2025년·2030년)
기업 자산 관리(EAM) 시장 : 전개 방식별(2025년·2030년)
기업 자산 관리(EAM) 시장 : 조직 규모별(2025년·2030년)
기업 자산 관리(EAM) 시장 : 자산 클래스별(2025년·2030년)
기업 자산 관리(EAM) 시장 : 업계별(2025년·2030년)
기업 자산 관리(EAM) 시장 : 지역 시나리오
제5장 시장 개요와 산업 동향(정량적인 영향을 보유한 전략적 촉진요인)
소개
시장 역학
성장 촉진요인
성장 억제요인
기회
과제
Porter's Five Forces 분석
주요 이해관계자와 구입 기준
생태계 분석
공급망 분석
규제 상황
규제기관, 정부기관, 기타 조직
주요 규제 : 지역별
가격 책정 분석
평균판매가격 : 지역별(2021-2024년)
참고 가격 : 주요 기업별(2024년)
기술 분석
주요 기술
보완 기술
인접 기술
특허 분석
사례 연구 분석
사례 연구 1 : HUNGRANA, 자산 관리에 SAP EAM를 활용
사례 연구 2 : RIYADH AIRPORT COMPANY, IBM MAXIMO로 공항 자산 관리를 변혁
사례 연구 3 : 헥사곤 HXGN EAM에 의한 원활한 MALARTAG 철도망 전환
사례 연구 4 : L'OREAL, CMMS 채용에 의해 실시간 자산 가시화를 실현
사례 연구 5 : APTEAN EAM을 통한 6개월 만에 엔지니어링 팀의 900% 성장 촉진
주요 회의와 이벤트(2025-2026년)
투자와 자금 조달 시나리오
기업 자산 관리(EAM) 시장에서 AI/생성형 AI의 영향
사례 연구 분석
고객 비즈니스에 영향을 미치는 동향/파괴
제6장 기업 자산 관리(EAM) 시장 : 제공별(시장 규모와 예측, -2030년)
소개
솔루션
서비스
제7장 기업 자산 관리(EAM) 시장 : 용도별(시장 규모와 예측, -2030년)
소개
자산 수명주기 관리
경영관리
보수 관리
컴플라이언스·안전성
보고·애널리틱스
기타 용도
제8장 기업 자산 관리(EAM) 시장 : 전개 방식별(시장 규모와 예측, -2030년)
소개
클라우드
온프레미스
제9장 기업 자산 관리(EAM) 시장 : 자산 클래스별(시장 규모와 예측, -2030년)
소개
선형 자산
생산 설비
플릿·동산
고정자산/시설 자산/인프라
기타 자산
제10장 기업 자산 관리(EAM) 시장 : 기업 규모별(시장 규모와 예측, -2030년)
소개
대기업
중소기업
제11장 기업 자산 관리(EAM) 시장 : 업계별(시장 규모와 예측, -2030년)
소개
제조
에너지·유틸리티
석유 및 가스
운송·물류
헬스케어·생명과학
정부·공공 부문
기타 업계
제12장 기업 자산 관리(EAM) 시장 : 지역별
소개
북미
북미의 거시경제 전망
북미의 기업 자산 관리(EAM) 시장 촉진요인
미국
캐나다
유럽
유럽의 기업 자산 관리(EAM) 시장 촉진요인
유럽의 거시경제 전망
영국
독일
프랑스
이탈리아
기타 유럽
아시아태평양
아시아태평양의 기업 자산 관리(EAM) 시장 촉진요인
아시아태평양의 거시경제 전망
중국
일본
호주·뉴질랜드
기타 아시아태평양
중동 및 아프리카
중동 및 아프리카의 기업 자산 관리(EAM) 시장 촉진요인
중동 및 아프리카의 거시경제 전망
GCC 국가
남아프리카공화국
기타 중동 및 아프리카
라틴아메리카
라틴아메리카의 기업 자산 관리(EAM) 시장 촉진요인
라틴아메리카의 거시경제 전망
브라질
멕시코
기타 라틴아메리카
제13장 경쟁 구도
소개
주요 진출 기업의 전략/강점
매출 분석(2020-2024년)
시장 점유율 분석
브랜드/제품의 비교
기업 평가 매트릭스 : 주요 기업(2024년)
기업 평가 매트릭스 : 스타트업/중소기업(2024년)
기업 평가와 재무 지표
경쟁 시나리오
제14장 기업 개요
소개
주요 기업
IBM
SAP
ORACLE
IFS
HEXAGON AB
TRIMBLE
APTEAN
SERVICENOW
HITACHI ENERGY
RAMCO
기타 기업
ACCRUENT
MAINTAINX
EMAINT
LLUMIN
CENTRALSQUARE
ABS GROUP
UPKEEP
ASSETWORKS
ASSET PANDA
ASSET INFINITY
EZMAINTAIN
KLOUDGIN
LIMBLE CMMS
IPS INTELLIGENT PROCESS SOLUTION
EPROMIS SOLUTIONS
제15장 인접 시장/관련 시장
소개
관련 시장
제한사항
인재 관리
인력 관리
제16장 부록
KSM
영문 목차
영문목차
The global enterprise asset management market (EAM) is expanding rapidly, with a projected market size anticipated to rise from about USD 5.87 billion in 2025 to USD 9.02 billion by 2030, featuring a CAGR of 9.0%. Growing demand for regulatory compliance and safety management in asset-intensive industries is expected to drive the adoption of EAM solutions.
North America, Europe, Asia Pacific, the Middle East & Africa, and Latin America
Energy, healthcare, and transportation sectors face strict compliance requirements related to equipment safety, environmental standards, and operational reporting. EAM solutions help organizations maintain accurate audit trails, track inspections, and ensure assets meet regulatory standards, reducing legal risks and improving stakeholder trust.
In contrast, a significant restraint is the data integration from diverse legacy systems and siloed operations. Many enterprises, particularly those with aging infrastructure, struggle to unify data from multiple platforms, manual records, and outdated equipment monitoring systems. This complexity slows EAM adoption and limits the ability to leverage advanced features such as predictive analytics and real-time monitoring. These factors highlight how regulatory needs drive adoption, while integration hurdles remain a barrier to seamless implementation.
"SMEs segment by organization size is expected to grow at the highest CAGR during the forecast period"
The small and medium-sized enterprises (SMEs) segment is expected to register the highest compound annual growth rate (CAGR) during the forecast period. This growth is driven by the increasing adoption of digital and cloud-based EAM solutions, which offer scalable, cost-effective, and easily deployable options for smaller organizations. SMEs increasingly invest in asset management to optimize equipment utilization, reduce downtime, and improve operational efficiency, but with solutions tailored to their limited resources. The availability of subscription-based and modular EAM offerings allows SMEs to access advanced features such as predictive maintenance, real-time monitoring, and analytics without heavy upfront investment.
Additionally, the push for digital transformation, regulatory compliance, and sustainability initiatives among SMEs further fuels the demand for EAM solutions, making this segment the fastest-growing organizational category in the market during the forecast period.
"Manufacturing vertical segment is expected to hold the largest market share during the forecast period"
Manufacturing is an asset-intensive sector that relies heavily on machinery, production lines, and industrial equipment, where downtime or inefficiencies can directly impact output and profitability. EAM solutions help manufacturers optimize asset utilization, monitor equipment performance, and implement proactive maintenance strategies to reduce unplanned downtime. With the rise of Industry 4.0 and smart factory initiatives, manufacturers are increasingly adopting IoT-enabled EAM platforms to integrate real-time data from connected devices, digital twins, and automation systems.
These capabilities allow for predictive insights, improved quality control, and streamlined workflows across the production cycle. For instance, in June 2024, Godrej & Boyce implemented HxGN EAM, and the company increased equipment uptime from 60% to 95%, improved labor utilization by 70%, and reduced inventory costs by 45%. These improvements enhanced operational efficiency and translated into higher productivity, cost savings, and long-term profitability for the business. Additionally, compliance with strict safety and environmental regulations in the manufacturing sector further drives the need for robust asset management solutions.
"Asia Pacific is expected to record the fastest growth, while North America is projected to hold the largest market share during the forecast period"
The Asia Pacific (APAC) region is driven by rapid industrialization, urbanization, and digital transformation across China, Japan, and Australia & New Zealand. Increasing adoption of smart manufacturing, IoT-enabled equipment, and predictive maintenance solutions is enhancing demand for EAM systems to improve asset performance and reduce operational costs. Significant government investments in infrastructure, energy, and transportation projects further support the need for efficient asset management.
Additionally, the rise of multinational corporations and SMEs seeking cloud-based and AI-powered EAM solutions is expanding the market. Growing focus on regulatory compliance and sustainable, cost-efficient operations positions Asia Pacific as the fastest-growing regional market, presenting substantial opportunities for technology providers and service vendors.
The North American EAM market is growing as organizations aim to optimize asset performance, reduce downtime, and enhance the lifespan of critical infrastructure. Growth is driven by IoT, AI, and cloud technologies that improve operational visibility and decision-making. Key sectors, such as manufacturing, energy, utilities, transportation, healthcare, and government, play significant roles, with a shift toward cloud-based platforms for scalability and cost-effectiveness. EAM solution providers should focus on cloud-based, AI-enhanced offerings to capitalize on this market trend.
Breakdown of primaries
We interviewed Chief Executive Officers (CEOs), directors of innovation and technology, system integrators, and executives from several significant enterprise asset management market companies.
By Company: Tier I: 40%, Tier II: 35%, and Tier III: 25%
By Designation: C-Level Executives: 45%, Director Level: 30%, and Others: 25%
By Region: North America: 30%, Europe: 20%, Asia Pacific: 35%, Rest of World: 15%
Some of the significant enterprise asset management market vendors are IBM (US), Oracle (US), SAP (Germany), Hexagon (Sweden), IFS (Sweden), Aptean (US), Trimble (US), ServiceNow (US), Hitachi Energy (Switzerland), and Ramco (India).
Research Coverage
The market report covered the enterprise asset management market across segments. We estimated the market size and growth potential for many segments based on offerings, applications, deployment type, organization size, verticals, and region. It contains a thorough competition analysis of the major market participants, information about their businesses, essential observations about their product and service offerings, current trends, and critical market strategies.
Reasons to Buy This Report
With the most accurate revenue estimates for the entire enterprise asset management (EAM) market and its subsegments, this research will benefit established market leaders and recent entrants. Stakeholders will gain deeper insights into the competitive landscape, enabling them to position their offerings better and develop effective go-to-market strategies. The report highlights key market drivers, restraints, opportunities, and challenges, helping industry players understand the dynamics of the EAM ecosystem and align their strategy with evolving market demands.
The report provides insights into the following pointers:
Analysis of key drivers (Rising uptime demand accelerates EAM adoption, Demand for real-time asset insights boosting EAM adoption, Demand for industry-specific EAM solutions, EAM as a tool for sustainable asset lifecycle management), restraints (High upfront implementation cost, Managing compliance complexity across borders), opportunities (Transforming EAM with Edge-to-Cloud innovation, Enable predictive maintenance with IIoT sensors), and challenges (Risk of cyberattacks and data privacy, Skilled workforce challenges in asset management), influencing the growth of the enterprise asset management market
Product Development/Innovation: Comprehensive analysis of emerging technologies, R&D initiatives, and new service and product introductions in the enterprise asset management market
Market Development: In-depth details regarding profitable markets - analyzing the global enterprise asset management market
Market Diversification: Comprehensive details regarding recent advancements, investments, unexplored regions, new software and services, and enterprise asset management market
Competitive Assessment: Thorough analysis of the market shares, expansion plans, and service portfolios of the top competitors in the enterprise asset management industry, such as IBM (US), Oracle (US), SAP (Germany), Hexagon (Sweden), IFS (Sweden), Aptean (US), Trimble (US), ServiceNow (US), Hitachi Energy (Switzerland), Ramco (India), Accruent (US), MaintainX (US), ABS Group (US), Central Square (US), KloudGin (US), Assetworks (US), Limble CMMS (US), Upkeep (US), Asset Panda (US), emaint (US), Asset Infinity (India), EZmaintain (India), Llumin (US), IPS Intelligent Process Solutions (Germany), and ePROMIS (US).
TABLE OF CONTENTS
1 INTRODUCTION
1.1 STUDY OBJECTIVES
1.2 MARKET DEFINITION
1.3 STUDY SCOPE
1.3.1 MARKET SEGMENTATION
1.3.2 INCLUSIONS AND EXCLUSIONS
1.3.3 YEARS CONSIDERED
1.3.4 CURRENCY CONSIDERED
1.4 STAKEHOLDERS
1.5 SUMMARY OF CHANGES
2 RESEARCH METHODOLOGY
2.1 RESEARCH APPROACH
2.1.1 SECONDARY DATA
2.1.2 PRIMARY DATA
2.1.2.1 Breakup of primary profiles
2.1.2.2 Key industry insights
2.2 MARKET BREAKUP AND DATA TRIANGULATION
2.3 MARKET SIZE ESTIMATION
2.3.1 TOP-DOWN APPROACH
2.3.2 BOTTOM-UP APPROACH
2.3.3 MARKET ESTIMATION APPROACHES
2.4 MARKET FORECAST
2.5 RESEARCH ASSUMPTIONS
2.6 RESEARCH LIMITATIONS
3 EXECUTIVE SUMMARY
4 PREMIUM INSIGHTS
4.1 ATTRACTIVE OPPORTUNITIES FOR PLAYERS IN ENTERPRISE ASSET MANAGEMENT MARKET
4.2 ENTERPRISE ASSET MANAGEMENT MARKET, BY OFFERING, 2025 VS 2030
4.3 ENTERPRISE ASSET MANAGEMENT MARKET, BY APPLICATION, 2025 VS 2030
4.4 ENTERPRISE ASSET MANAGEMENT MARKET, BY DEPLOYMENT TYPE, 2025 VS 2030
4.5 ENTERPRISE ASSET MANAGEMENT MARKET, BY ORGANIZATION SIZE, 2025 VS 2030
4.6 ENTERPRISE ASSET MANAGEMENT MARKET, BY ASSET CLASS, 2025 VS 2030
4.7 ENTERPRISE ASSET MANAGEMENT MARKET, BY VERTICAL, 2025 VS 2030