Membranes Market by Material (Polymeric, Ceramic), Technology (Reverse Osmosis, Ultrafiltration, Microfiltration, Nanofiltration), Application (Water & Wastewater Treatment, Industrial Processing), and Region - Global Forecast to 2030
상품코드:1822297
리서치사:MarketsandMarkets
발행일:2025년 09월
페이지 정보:영문 257 Pages
라이선스 & 가격 (부가세 별도)
ㅁ Add-on 가능: 고객의 요청에 따라 일정한 범위 내에서 Customization이 가능합니다. 자세한 사항은 문의해 주시기 바랍니다.
한글목차
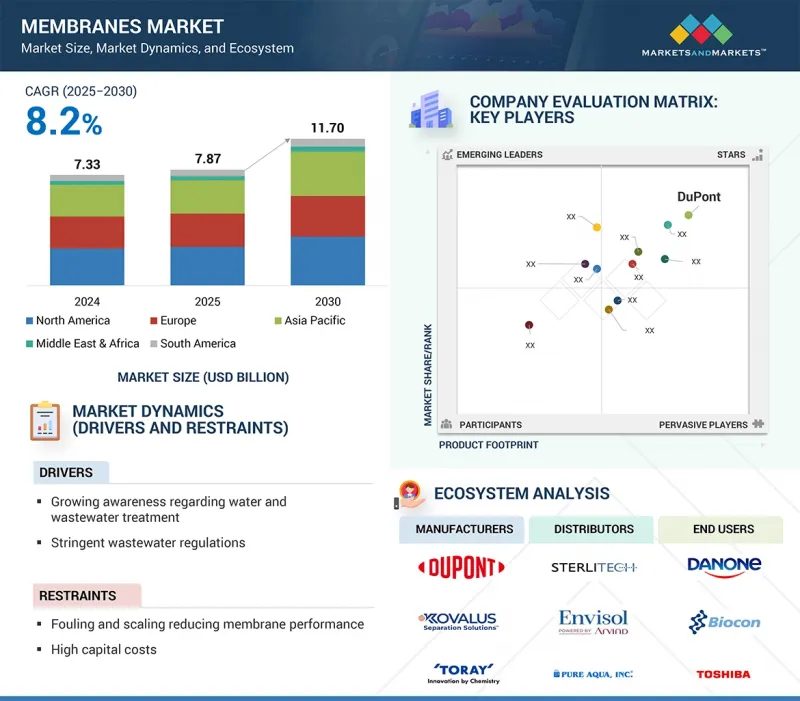
막 시장 규모는 2025년 78억 7,000만 달러에서 2030년에는 117억 달러에 달할 것으로 예상되어 CAGR은 8.2%에 달할 것으로 전망되고 있습니다.
폐수 처리에 대한 수요 증가는 멤브레인이 오염 물질을 효과적으로 제거하고 엄격한 폐기 기준을 충족하며 폐수 및 처리수 재사용에 따른 위험을 줄이는 데 도움이 되므로 멤브레인 사용에 박차를 가하고 있습니다. 급속한 산업화와 도시화는 폐수 생산량 증가와 오염도 증가로 이어져 지속가능한 물 관리와 자원 회수를 위한 막여과와 같은 첨단 처리 기술의 채택과 지속을 촉진하고 있습니다.
조사 범위
조사 대상 연도
2022-2030년
기준연도
2024년
예측 기간
2025-2030년
검토 단위
1,000평방미터, 금액(100만 달러)
부문
재료별, 기술별, 용도별, 지역별
대상 지역
아시아태평양, 북미, 유럽, 중동 및 아프리카, 남미
또한 재활용과 재사용을 통한 물 부족 해소에 집중하면서 전 세계 지자체와 산업 부문 모두에서 멤브레인에 대한 수요가 증가할 것으로 예측됩니다.
금액 기준으로 정밀여과는 물 및 폐수처리 시스템, 의약품 및 의료품, 식품 및 음료 등에 광범위하게 사용되어 멤브레인 시장에서 두 번째 점유율을 차지하고 있습니다. 정밀여과는 적은 에너지 소비로 부유물질, 박테리아, 고분자를 효과적이고 효율적으로 제거할 수 있는 고유한 특성이 있으며, 그 용도에 유용합니다. 필요한 에너지가 적기 때문에 정밀 여과는 다른 많은 치료 방법에 비해 상대적으로 저렴합니다. 수질에 대한 규제 기준의 강화와 정제된 폐수에 대한 산업 전반 수요 증가는 전 세계에서 정밀 여과 채택이 증가하는 주요 이유 중 하나입니다.
고분자 멤브레인은 멤브레인 시장에서 두 번째로 빠르게 성장하고 있는 분야로, 비용 효율성이 높고 내화학성이 뛰어나며, 맞춤형 제작과 유연한 생산 옵션을 제공합니다. 이 멤브레인은 우수한 선택성과 내구성을 제공하는 다양한 폴리머를 사용하며, 수처리, 제약, 식품 개발 분야에서 널리 사용되고 있습니다. 고분자 화학의 발전으로 내오염성이 향상되고, 투과성이 높아져 엄격한 환경 규제를 통과할 수 있게 되었습니다. 또한 지속가능한 액체 여과 솔루션에 대한 관심과 수요가 증가하고 있습니다. 이러한 추세는 예측 기간 중 고분자 멤브레인 필터의 사용 증가 기회를 창출할 것으로 예측됩니다.
아시아태평양은 중국, 인도, 동남아시아의 급속한 산업화, 도시화, 중국, 인도, 동남아시아의 깨끗한 물 및 폐수 처리 솔루션에 대한 수요 증가로 인해 멤브레인 시장 점유율이 가장 빠르게 성장하고 있는 지역입니다. 또한 정부의 강력한 구상, 인프라에 대한 자본 투자, 지속적인 기술 발전으로 아시아태평양은 시장 성장을 증폭시키고 멤브레인 기술을 채택하고 혁신할 수 있는 기회를 제공합니다.
세계의 막 시장에 대해 조사했으며, 재료별, 기술별, 용도별, 지역별 동향 및 시장에 참여하는 기업의 개요 등을 정리하여 전해드립니다.
목차
제1장 서론
제2장 조사 방법
제3장 개요
제4장 주요 인사이트
제5장 시장 개요
서론
시장 역학
Porter's Five Forces 분석
거시경제 지표
제6장 업계 동향
서론
주요 이해관계자와 구입 기준
밸류체인 분석
에코시스템/시장 맵
무역 분석
가격 분석
규제 상황
AI/GEN AI의 영향
고객 비즈니스에 영향을 미치는 동향/혼란
기술 분석
사례 연구 분석
2025-2026년의 주요 컨퍼런스와 이벤트
투자와 자금조달 시나리오
특허 분석
2025년 미국 관세의 영향 - 개요
제7장 막 시장(재료별)
서론
폴리머
세라믹
기타
제8장 막 시장(기술별)
서론
역침투
한외여과
마이크로여과
나노여과
기타
제9장 막 시장(용도별)
서론
수처리·폐수 처리
산업 처리
제10장 막 시장(지역별)
서론
아시아태평양
중국
일본
인도
한국
호주
기타
북미
미국
캐나다
멕시코
유럽
스페인
독일
프랑스
영국
이탈리아
기타
중동 및 아프리카
GCC 국가
남아프리카공화국
기타
남미
브라질
아르헨티나
기타
제11장 경쟁 구도
개요
주요 참여 기업의 전략/강점
매출 분석, 2022-2024년
시장 점유율 분석, 2024년
기업 평가와 재무 지표
브랜드/제품 비교 분석
기업 평가 매트릭스 : 주요 참여 기업, 2024년
기업 평가 매트릭스 : 스타트업/중소기업, 2023년
경쟁 시나리오와 동향
제12장 기업 개요
주요 참여 기업
DUPONT
TORAY INDUSTRIES, INC.
HYDRANAUTICS(A NITTO DENKO GROUP COMPANY)
KOVALUS SEPARATION SOLUTIONS
PALL CORPORATION
VEOLIA
PENTAIR
ASAHI KASEI CORPORATION
LG CHEM
MANN+HUMMEL
SOLVENTUN
BEIJING ORIGINWATER TECHNOLOGY CO., LTD.
기타 기업
ALSYS
APPLIED MEMBRANES, INC.
AQUAPORIN
AXEON WATER TECHNOLOGIES
GEA GROUP AKTIENGESELLSCHAFT
LANXESS
LENNTECH B.V.
MEMBRANE SOLUTIONS(NANTONG)
MEMBRANIUM
MERCK KGAA
PARKER-HANNIFIN CORP
PERMIONICS
SYNDER FILTRATION, INC.
SCINOR WATER AMERICA, LLC
TOYOBO CO., LTD.
제13장 부록
KSA
영문 목차
영문목차
The membranes market is expected to reach USD 11.70 billion by 2030, up from USD 7.87 billion in 2025, with a CAGR of 8.2%. The rising demand for wastewater treatment is fueling membrane use because they effectively remove contaminants, helping meet strict disposal standards and reducing risks associated with discharges or reusing treated water. Rapid industrialization and urbanization have led to increased wastewater production and higher pollution levels, prompting the adoption or continuation of advanced treatment technologies like membrane filtration for sustainable water management and resource recovery.
Scope of the Report
Years Considered for the Study
2022-2030
Base Year
2024
Forecast Period
2025-2030
Units Considered
Thousand Square Meters; Value (USD Million)
Segments
Material, Technology, and Application
Regions covered
Asia Pacific, North America, Europe, the Middle East & Africa, and South America
Additionally, the focus on reducing water shortages through recycling and reuse is expected to boost demand for membranes in both municipal and industrial sectors worldwide.
"Based on technology, microfiltration segment to account for second-largest share of membranes market during forecast period, in terms of value"
In terms of value, microfiltration holds the second-largest share of the membranes market because of its extensive use in water and wastewater treatment systems, pharmaceuticals and medical products, food and beverage, and more. Microfiltration has a unique feature that benefits its applications: its ability to effectively and efficiently remove suspended solids, bacteria, and large macromolecules with less energy consumption. Its low energy requirement makes microfiltration relatively inexpensive compared to many other treatment methods. The rising regulatory standards for water quality and the growing industry-wide demand for purified effluents are among the key reasons driving the increased adoption of microfiltration applications worldwide.
"Based on material, polymeric segment to be second fastest-growing segment in membranes market during forecast period, in terms of value"
Polymeric membranes are the second fastest-growing segment in the membranes market because they offer significant customization and flexible production options, are the most cost-effective, and have high chemical resistance. These membranes operate with various polymers that provide good selectivity and durability, making them common in water treatment, pharmaceuticals, and food development applications. Advances in polymer chemistry have led to improved fouling resistance, increased permeability, and a better ability to meet strict environmental regulations. There is also a growing focus and demand for sustainable liquid filtration solutions. It is expected that these trends will create opportunities for increased use of polymeric membrane filters throughout the forecast period.
"Based on region, Asia Pacific to account for largest share of membranes market, in terms of value"
Asia Pacific dominates the membranes market share and is the fastest-growing region due to rapid industrialization, urbanization, and the increased demand for clean water and wastewater treatment solutions in China, India, and Southeast Asia. Additionally, with strong government initiatives, capital investments in infrastructure, and ongoing advancements in technology, Asia Pacific has amplified market growth, thereby providing an opportunity to adopt and innovate membrane technologies.
In the process of determining and verifying the market size for several segments and subsegments identified through secondary research, extensive primary interviews were conducted. A breakdown of the profiles of the primary interviewees is as follows:
By Company Type: Tier 1 - 40%, Tier 2 - 30%, and Tier 3 - 30%
By Designation: Directors- 35%, Managers - 25%, and Others - 40%
By Region: North America - 22%, Europe - 22%, Asia Pacific - 45%, Middle East & Africa - 7%, and South America - 4%
Key players in this market are Dupont (US), Toray Industries Inc (Japan), Hydranautics (Nitto Denko Group Company) (US), Kovalus Separation Solutions (US), Pall Corporation (US), Veolia (France), Pentair (US), Asahi Kasei Corporation (Japan), LG Chem (South Korea), and Mann+Hummel (Germany).
Research Coverage
This report segments the membranes market by material, technology, application, and region, and offers estimates of the market's overall value across various regions. A detailed analysis of key industry players has been performed to provide insights into their business overviews, products and services, main strategies, new product launches, expansions, and mergers and acquisitions related to the membranes market.
Key Benefits of Buying this Report
This research report focuses on various levels of analysis, including industry analysis (industry trends), market ranking analysis of top players, and company profiles. Together, these provide an overall view of the competitive landscape, emerging and high-growth segments of the membranes market, high-growth regions, and the market's drivers, restraints, opportunities, and challenges.
The report provides insights into the following pointers:
Analysis of key drivers (Increasing awareness about water & wastewater treatment, Stringent wastewater regulations), restraints (Fouling and scaling in membranes, High capital costs of raw materials), opportunities (Rising demand for water treatment in emerging economies, Pressing need for freshwater supply in industries) and challenges (Issues related to lifespan and efficiency of membranes, Discharge of brine as waste from RO membranes).
Market Penetration: Comprehensive information on the membranes market share is offered regarding the top players in the global membranes market.
Product Development/Innovation: Detailed insights into upcoming technologies, research & development activities, and new product launches in the membranes market.
Market Development: Comprehensive information about lucrative emerging markets - the report analyzes the membranes market across regions.
Market Diversification: Exhaustive information about new products, untapped regions, and recent developments in the global membranes market.
Competitive Assessment: In-depth assessment of market shares, strategies, products, and manufacturing capabilities of leading players in the membranes market.
TABLE OF CONTENTS
1 INTRODUCTION
1.1 STUDY OBJECTIVES
1.2 MARKET DEFINITION
1.3 STUDY SCOPE
1.3.1 MARKETS COVERED AND REGIONAL SCOPE
1.3.2 INCLUSIONS & EXCLUSIONS
1.3.3 YEARS CONSIDERED
1.3.4 CURRENCY CONSIDERED
1.3.5 UNITS CONSIDERED
1.4 STAKEHOLDERS
1.5 SUMMARY OF CHANGES
2 RESEARCH METHODOLOGY
2.1 RESEARCH DATA
2.1.1 SECONDARY DATA
2.1.1.1 Key data from secondary sources
2.1.2 PRIMARY DATA
2.1.2.1 Key data from primary sources
2.1.2.2 Key primary participants
2.1.2.3 Key industry insights
2.1.2.4 Breakdown of primary interviews
2.2 MARKET SIZE ESTIMATION
2.2.1 BOTTOM-UP APPROACH
2.2.2 TOP-DOWN APPROACH
2.3 FORECAST NUMBER CALCULATION
2.4 DATA TRIANGULATION
2.5 FACTOR ANALYSIS
2.6 ASSUMPTIONS
2.7 LIMITATIONS & RISKS
3 EXECUTIVE SUMMARY
4 PREMIUM INSIGHTS
4.1 ATTRACTIVE OPPORTUNITIES FOR PLAYERS IN MEMBRANES MARKET
4.2 MEMBRANES MARKET, BY MATERIAL
4.3 MEMBRANES MARKET, BY TECHNOLOGY
4.4 MEMBRANES MARKET, BY APPLICATION
4.5 MEMBRANES MARKET, BY KEY COUNTRY
5 MARKET OVERVIEW
5.1 INTRODUCTION
5.2 MARKET DYNAMICS
5.2.1 DRIVERS
5.2.1.1 Increasing awareness about water & wastewater treatment
5.2.1.2 Stringent wastewater regulations
5.2.1.3 Shift from chemical to membrane treatment of water
5.2.1.4 Increasing demand for membranes from end-use industries
5.2.2 RESTRAINTS
5.2.2.1 Fouling and scaling in membranes
5.2.2.2 High capital costs of raw materials
5.2.2.3 Limited compatibility and high energy consumption
5.2.3 OPPORTUNITIES
5.2.3.1 Rising demand for water treatment in emerging economies
5.2.3.2 Pressing need for freshwater supply in industries
5.2.3.3 Circular economy initiatives
5.2.4 CHALLENGES
5.2.4.1 Issues related to lifespan and efficiency of membranes
5.2.4.2 Discharge of brine as waste from RO membranes
5.2.4.3 High initial cost of equipment
5.3 PORTER'S FIVE FORCES ANALYSIS
5.3.1 THREAT OF NEW ENTRANTS
5.3.2 THREAT OF SUBSTITUTES
5.3.3 BARGAINING POWER OF SUPPLIERS
5.3.4 BARGAINING POWER OF BUYERS
5.3.5 INTENSITY OF COMPETITIVE RIVALRY
5.4 MACROECONOMIC INDICATORS
5.4.1 GLOBAL GDP TRENDS
6 INDUSTRY TRENDS
6.1 INTRODUCTION
6.2 KEY STAKEHOLDERS & BUYING CRITERIA
6.2.1 KEY STAKEHOLDERS IN BUYING PROCESS
6.2.2 BUYING CRITERIA
6.3 VALUE CHAIN ANALYSIS
6.4 ECOSYSTEM/MARKET MAP
6.5 TRADE ANALYSIS
6.5.1 EXPORT SCENARIO (HS CODE 842129)
6.5.2 IMPORT SCENARIO (HS CODE 842129)
6.6 PRICING ANALYSIS
6.6.1 AVERAGE SELLING PRICE TREND, BY REGION (2022-2024)
6.6.2 AVERAGE SELLING PRICE TREND OF APPLICATION, BY KEY PLAYER (2022-2024)
6.7 REGULATORY LANDSCAPE
6.8 IMPACT OF AI/GEN AI
6.9 TRENDS/DISRUPTIONS IMPACTING CUSTOMER BUSINESS
6.10 TECHNOLOGY ANALYSIS
6.10.1 KEY TECHNOLOGIES
6.10.1.1 Block copolymer membranes
6.10.1.2 Flux enhancement technology
6.10.2 COMPLEMENTARY TECHNOLOGIES
6.10.2.1 Combined crystallization and diffusion
6.10.2.2 Membrane distillation
6.10.3 ADJACENT TECHNOLOGIES
6.10.3.1 Membrane contactor
6.10.3.2 Pervaporation for hydrocarbon separation
6.10.3.3 Forward osmosis, direct contact membrane distillation, and integrated FO-DCMD
6.11 CASE STUDY ANALYSIS
6.11.1 TORAY'S MEMBRANE TECHNOLOGIES ACHIEVED ZERO LIQUID DISCHARGE IN INDIA'S SPECIAL ECONOMIC ZONE
6.11.2 HYDRANAUTICS TREATED INDUSTRIAL WASTEWATER WITH PRO-LF IN A COAL-CHEMICAL ZLD PROJECT
6.11.3 SUEZ CONSTRUCTED WEST WASTEWATER TREATMENT PLANT IN DOHA
6.11.4 PENTAIR OFFERED WATER TREATMENT SOLUTIONS IN SWEDEN
6.11.5 DUPONT OFFERED UPGRADED RO SYSTEM TO INCREASE PERMEATE CAPACITY AND REDUCE CONCENTRATE VOLUME
6.12 KEY CONFERENCES AND EVENTS IN 2025-2026
6.13 INVESTMENT AND FUNDING SCENARIO
6.14 PATENT ANALYSIS
6.14.1 INTRODUCTION
6.14.2 LEGAL STATUS OF PATENTS
6.14.3 JURISDICTION ANALYSIS
6.15 IMPACT OF 2025 US TARIFF - OVERVIEW
6.15.1 INTRODUCTION
6.15.2 KEY TARIFF RATES
6.15.3 PRICE IMPACT ANALYSIS
6.15.4 IMPACT ON COUNTRY/REGION
6.15.4.1 US
6.15.4.2 Europe
6.15.4.3 Asia Pacific
6.15.5 IMPACT ON END-USE INDUSTRIES
7 MEMBRANES MARKET, BY MATERIAL
7.1 INTRODUCTION
7.2 POLYMERIC
7.2.1 POLYAMIDE
7.2.1.1 Primarily used in NF and RO membranes
7.2.2 POLYSULFONE AND POLYETHERSULFONE
7.2.2.1 Offer high thermal and chemical stability
7.2.3 FLUOROPOLYMERS
7.2.3.1 Possess high mechanical strength and chemical resistance
7.2.4 OTHER POLYMERIC MEMBRANES
7.3 CERAMIC
7.3.1 ALUMINA
7.3.1.1 Improves production efficiency of membranes
7.3.2 TITANIA
7.3.2.1 Primarily used in MF and NF membranes
7.3.3 ZIRCONIA
7.3.3.1 High strength and fracture toughness
7.3.4 OTHER CERAMIC MEMBRANES
7.4 OTHER MATERIALS
8 MEMBRANES MARKET, BY TECHNOLOGY
8.1 INTRODUCTION
8.2 REVERSE OSMOSIS
8.2.1 WIDELY USED IN DESALINATION
8.3 ULTRAFILTRATION
8.3.1 HIGHER FLUX RATE THAN REVERSE OSMOSIS
8.4 MICROFILTRATION
8.4.1 USED AS PRETREATMENT TO REVERSE OSMOSIS AND NANOFILTRATION
8.5 NANOFILTRATION
8.5.1 WORKS AT REDUCED OPERATING PRESSURES WITH HIGHER FLOW RATES THAN REVERSE OSMOSIS
8.6 OTHER TECHNOLOGIES
9 MEMBRANES MARKET, BY APPLICATION
9.1 INTRODUCTION
9.2 WATER & WASTEWATER TREATMENT
9.2.1 DESALINATION
9.2.1.1 Used to separate dissolved salts from water
9.2.2 UTILITY WATER TREATMENT
9.2.2.1 Produces high-purity or potable water from contaminated sources
9.2.3 WASTEWATER REUSE
9.2.3.1 Efficient in eliminating contaminants from process streams
9.3 INDUSTRIAL PROCESSING
9.3.1 FOOD & BEVERAGE
9.3.1.1 Removal of pathogenic substances from liquid streams
9.3.2 CHEMICAL & PETROCHEMICAL
9.3.2.1 Reduced operational cost
9.3.3 PHARMACEUTICAL & MEDICAL
9.3.3.1 Superior filtration and temperature resistance
9.3.4 TEXTILE
9.3.4.1 Desalting & purification of dyes
9.3.5 POWER
9.3.5.1 Advanced membrane technology to improve water quality
9.3.6 PULP & PAPER
9.3.6.1 Wastewater treatment for pulp preparation and bleaching
9.3.7 OTHER APPLICATIONS
10 MEMBRANES MARKET, BY REGION
10.1 INTRODUCTION
10.2 ASIA PACIFIC
10.2.1 CHINA
10.2.1.1 Rapid industrialization and urbanization to drive market
10.2.2 JAPAN
10.2.2.1 Development of advanced technologies and boom in industrial sector to boost market
10.2.3 INDIA
10.2.3.1 Growth of end-use industries and increasing awareness of wastewater treatment to drive market
10.2.4 SOUTH KOREA
10.2.4.1 Growth of food & beverage industry to drive market
10.2.5 AUSTRALIA
10.2.5.1 Surge in seawater desalination centers to drive market
10.2.6 REST OF ASIA PACIFIC
10.3 NORTH AMERICA
10.3.1 US
10.3.1.1 Increase in oil production activities and rising demand for potable drinking water to drive market
10.3.2 CANADA
10.3.2.1 Increase in food processing establishments to drive market
10.3.3 MEXICO
10.3.3.1 Growth of manufacturing sector to boost market
10.4 EUROPE
10.4.1 SPAIN
10.4.1.1 Surge in demand for desalinated water to drive market
10.4.2 GERMANY
10.4.2.1 Stringent EU standards for wastewater treatment to boost market
10.4.3 FRANCE
10.4.3.1 Advancements in water treatment infrastructure to drive market
10.4.4 UK
10.4.4.1 Rising oil & gas production fields in offshore and onshore platforms to drive market
10.4.5 ITALY
10.4.5.1 Growth of pharmaceutical and electronics sectors to drive market
10.4.6 REST OF EUROPE
10.5 MIDDLE EAST & AFRICA
10.5.1 GCC COUNTRIES
10.5.1.1 Saudi Arabia
10.5.1.1.1 Presence of tapped aquifers and network of large desalination projects to drive market
10.5.1.2 UAE
10.5.1.2.1 Extensive use of membranes in brackish water treatment to drive market
10.5.1.3 Kuwait
10.5.1.3.1 Strong capacity for brackish water and seawater desalination to boost market
10.5.1.4 Rest of GCC
10.5.2 SOUTH AFRICA
10.5.2.1 Addressing water scarcity through advanced membrane technologies in South Africa
10.5.3 REST OF MIDDLE EAST & AFRICA
10.6 SOUTH AMERICA
10.6.1 BRAZIL
10.6.1.1 Rising need for safe drinking water to drive demand for membranes
10.6.2 ARGENTINA
10.6.2.1 Emphasis on wastewater treatment activities and foreign investments to boost market
10.6.3 REST OF SOUTH AMERICA
11 COMPETITIVE LANDSCAPE
11.1 OVERVIEW
11.2 KEY PLAYER STRATEGIES/RIGHT TO WIN
11.3 REVENUE ANALYSIS, 2022-2024
11.4 MARKET SHARE ANALYSIS, 2024
11.5 COMPANY VALUATION AND FINANCIAL METRICS
11.6 BRAND/PRODUCT COMPARISON ANALYSIS
11.7 COMPANY EVALUATION MATRIX: KEY PLAYERS, 2024
11.7.1 STARS
11.7.2 EMERGING LEADERS
11.7.3 PERVASIVE PLAYERS
11.7.4 PARTICIPANTS
11.7.5 COMPANY FOOTPRINT
11.7.5.1 Material footprint
11.7.5.2 Technology footprint
11.7.5.3 Application footprint
11.7.5.4 Region footprint
11.7.5.5 Overall company footprint
11.8 COMPANY EVALUATION MATRIX: STARTUPS/SMES, 2023