네트워크 API 수익은 2030년 세계에서 80억 달러를 넘어 KYC가 다음 주요 사업 기회로 선정
주요 통계
2025년 네트워크 API를 통한 통신 사업자 수익 :
2억 8,300만 달러
2030년 네트워크 API를 통한 통신 사업자 수익 :
81억 달러
2030년 인증 및 부정 방지 네트워크 API에 의한 통신 사업자 수익 :
49억 달러
예측 기간 :
2025-2030년
설문조사 제품군은 통신 사업자, CPAaS 제공업체 및 기타 GSMA 채널 파트너를 위해 급성장하는 네트워크 API 시장에 대한 광범위한 분석 및 실용적인 통찰력을 제공합니다. 이 연구에는 네트워크 API 시장에서 제품 개발 및 비즈니스 전략에 대한 의사 결정을 지원하는 데이터가 포함되어 있습니다. GSMA의 Open Gateway 및 CAMARA 프로젝트에 대한 네트워크 API의 도입 이후, API는 통신 사업자의 미래 수익 전략에 중요한 역할을 담당하고 있습니다. 이 보고서는 인증, 부정 방지, 통신 품질, 통신 서비스, 컴퓨팅 서비스, 장치 정보, 위치 정보 서비스, 결제 및 과금 등 현재 사용 가능한 안정적인 네트워크 API의 현재 및 미래 영향을 평가합니다.
또한 비안정적인 네트워크 API에 대해서도 분석을 하고 있으며, 본인확인(KYC), 인구밀도 데이터, Network-as-a-Service(NaaS) 관련 API 등의 분야에 있어서의 API에 관한 전략적 제안을 제시하고 있습니다. 또한, 현재와 미래에 통신사업자의 수익을 견인하는 다양한 네트워크 API에 대해서도 평가를 실시했습니다. Aduna의 집계 플랫폼과 Bridge Alliance의 API 교환(BAEx)에 대한 사례 연구도 포함되어 있습니다.
이 보고서는 비안정적인 네트워크 API에 대한 분석 및 전략을 제공하며 KYC(Know Your Customer), 인구 밀도 데이터 및 NaaS(Network-as-a-Service) 관련 API 분야의 네트워크 API에 대해 제안합니다. 이 외에도 현재 및 미래 사업자의 수익을 촉진하는 다양한 네트워크 API 평가도 수행하고 있습니다. 이 연구에는 Aduna의 집계 플랫폼과 Bridge Alliance의 API 교환(BAEx)에 대한 사례 연구도 포함되어 있습니다.
이 보고서는 개발자와 기업이 현재 네트워크 API를 활용하는 방법과 AI 용도, 은행 및 핀테크, 셀룰러 IoT, 전자상거래, 게임 등 어떤 시장 분야가 머니타이즈에서 중요한지에 대한 통찰력과 분석을 제공합니다. 또한, 통신사업자가 비즈니스 시스템, 전략 무결성, 데이터 보호 및 동의의 구조를 어떻게 업데이트할 필요가 있는지도 고찰했습니다.
또한 국가별 성장준비지수를 게재하고 향후 5년간 어느 네트워크 API 시장이 가장 성장할 가능성이 높은지에 대한 통찰과 분석을 제공합니다. 이를 통해 60개가 넘는 네트워크 API 시장의 현재와 미래 상황을 관계자가 효과적으로 파악할 수 있습니다.
이 보고서는 모두 영어로 작성되었습니다.
주요 특징
주요 요점과 전략적 제안 : 네트워크 API 시장에서 주요 개척 기회와 지식을 상세하게 분석. 또한 네트워크 API의 수익 확대를 목표로 하는 사업자 및 기타 이해관계자에 대한 전략적 제안을 제공합니다.
시장 역학 : 주요 API 분석을 포함한 네트워크 API 시장의 주요 동향과 기회에 대한 통찰력, 사업자가 네트워크 API를 수익화하는 데 활용할 수 있는 다양한 비즈니스 모델의 전략적 분석도 포함되어 있습니다.
벤치마크 업계 예측 : 네트워크 API 통화의 총 수와 네트워크 API의 운영자 수익을 포함한 5년간의 예측을 제공합니다. 게다가 인증 및 부정 방지, 위치 서비스, 통신 서비스, 통신 품질, 디바이스 정보, 컴퓨팅 서비스, 결제와 과금의 카테고리별로 분류하고 있습니다.
Juniper Research의 경쟁 리더보드 : 네트워크 API 시장의 주요 공급업체 11개 기업의 능력을 평가하고 시장 규모와 각 공급업체의 제공 서비스에 대한 자세한 분석 결과를 제공합니다.
SAMPLE VIEW
시장 데이터 및 예측 보고서
샘플
시장 동향 및 전략 보고서
시장 데이터 & 예측 보고서
이 보고서에는 23,000개의 데이터 포인트와 50개 이상의 테이블로 구성된 예측 데이터 세트에 대한 액세스가 포함되어 있습니다.
조사 대상에는 다음 측정항목이 포함됩니다.
네트워크 API 호출의 총수
네트워크 API에 의한 통신 사업자 수익
가입자당 평균 네트워크 API 수익
대화형 예측(Excel)에는 다음과 같은 기능이 포함됩니다.
통계 분석 : 데이터 기간 동안 모든 지역 및 국가에 대해 표시되며 특정 측정항목을 검색할 수 있습니다. 그래프는 쉽게 변경할 수 있으며 클립보드로 내보낼 수 있습니다.
국가별 데이터 도구 : 이 도구를 사용하면 예측 기간 동안 모든 지역 및 국가 측정항목을 볼 수 있습니다. 검색창에 표시할 측정항목을 좁힐 수 있습니다.
국가별 비교 도구 : 특정 국가를 선택하고 비교할 수 있습니다. 이 도구에는 그래프를 내보내는 기능이 포함되어 있습니다.
What-if 분석 : 세 가지 대화형 시나리오를 통해 사용자는 예측 전제조건과 비교할 수 있습니다.
BTS
Comviva
Glide Identity
Infobip
Microsoft
Nokia
Sekura.id
Sinch
Symphonica
Syniverse
Vonage
목차
시장 동향과 전략
제1장 중요 포인트와 전략적 제안
중요 포인트
주요 전략적 제안
제2장 시장 상황
소개
GSMA Open Gateway Initiative
CAMARA 프로젝트
TM Forum과 GSMA Partnership
현재 시장 상황
네트워크 API의 주요 유통 채널
통신 사업자
멀티 통신 사업자 플랫폼
하이퍼스케일러
CPaaS 제공업체
시스템 통합자
네트워크 인프라벤더
개발자의 이해
개발자가 구축하고 있는 주요 용도
i. 셀룰러 IoT
ii. 은행과 핀테크
iii.게임
iv.E-Commerce
v. AI 용도
마케팅 및 교육 전략
비즈니스 모델과 수익화 전략
카니발리제이션과 비즈니스 구조의 변화
비즈니스 시스템
통신 사업자는 네트워크 API 전략을 정합시킬 필요가 있다
데이터 보호, 데이터 프라이버시, 동의
전략은 단기보다는 장기로 생각해야
제3장 미래의 기회와 시장 전략
CAMARA의 Scope
Meta-release Spring25
안정 가동중의 API
디바이스 도달 가능성 상태
디바이스 로밍 상태
위치 정보 확인
전화번호 인증
일회용 비밀번호 SMS 전송
서비스 품질 프로파일
온디맨드 품질 제어
SIM 스왑 검출
Simple Edge 검출
미래의 API 기회
KYC(고객 확인) API
인구밀도 데이터
NaaS API
제4장 국가별 준비지수
국가별 준비 지수 : 소개
초점 시장
중국
미국
성장 시장
싱가포르
신흥 시장
경쟁 리더보드
제1장 경쟁 리더보드
제2장 벤더 프로파일
벤더 프로파일
BTS Group
Comviva
Glide Identity
Infobip
Microsoft
Nokia
Sekura.id
Sinch
Symphonica
Syniverse
Vonage
평가 기법
제한과 해석
제3장 데이터&예측 : 목차
지리적 확산
주요 고객과 전략적 파트너십
제공 내용의 개요
Juniper Research의 견해 : 주요 강점과 전략적 개발 기회
Sekura.id
Sinch
Symphonica
Syniverse
Vonage
평가 기법
제한과 해석
데이터 & 예측
제1장 서론 및 조사 방법
제2장 시장 요약과 향후 시장 전망
네트워크 API 호출의 총수
네트워크 API에 의한 통신 사업자의 총 수익
인증 및 부정 방지 API 호출의 총수
인증 및 부정 방지 API에 의한 통신 사업자의 총 수익
위치 정보 서비스 API 호출의 총수
위치 정보 서비스 API에 의한 통신 사업자의 총 수익
통신 서비스 API 호출의 총수
통신 서비스 API에 의한 통신 사업자의 총 수익
통신 품질 API 호출의 총수
통신 품질 API를 통한 통신 사업자의 총 수익
디바이스 정보 API 호출의 총수
디바이스 정보 API에 의한 통신 사업자의 총 수익
컴퓨팅 서비스 API 호출의 총 수
컴퓨팅 서비스 API에 의한 통신 사업자의 총 수익
결제 및 과금 API 호출의 총수
결제 및 과금 API에 의한 통신 사업자의 총 수익
SHW
영문 목차
영문목차
'Network API Revenue to Exceed $8 Billion by 2030 Globally, as KYC Identified as the Next Major Opportunity'
KEY STATISTICS
Total operator revenue from network APIs in 2025:
$283mn
Total operator revenue from network APIs in 2030:
$8.1bn
Total operator revenue from authentication and fraud prevention network APIs in 2030:
$4.9bn
Forecast period:
2025-2030
Overview
Our "Network API" research suite provides operators, CPaaS providers, and other GSMA channel partners with extensive analysis and actionable insights into the rapidly growing network API market. It contains data that allows stakeholders in the market to make informed decisions on their product development and business strategies in the network API market. Since the launch of the GSMA Open Gateway and the CAMARA Project networks, APIs have become a key part of operators' future revenue strategies. The report assesses the present-day and future impact of current stable network APIs including Authentication and Fraud, Communication Quality, Communication Services, Computing Services, Device Information, Location Services, and Payments and Charging.
The report also analyses and provides strategy for non-stable network APIs, with recommendations being provided for network APIs in the areas of Know Your Customer (KYC), Population Density Data, and Network-as-a-Service (NaaS)-related APIs. This is in addition to assessing the different network APIs driving operator revenue both at present and in the future. The study includes case studies on Aduna's aggregation platform and the Bridge Alliance API Exchange (BAEx).
The report also features insights and analysis on how developers and enterprises are currently using network APIs, and which market verticals will be important to monetisation, including AI applications, banks and fintechs, cellular IoT, eCommerce, and gaming. It also looks at how operators need to update business systems, strategy alignment, and data protection and consent.
The report includes a Country Readiness Index; providing insight and analysis into which network API markets will experience the greatest growth over the next five years. This enables stakeholders to effectively understand the current and future status of more than 60 different network API markets.
The market forecast comprises of several different options that can be purchased separately, including access to data mapping and a forecast document, a strategy and trends document detailing critical trends in the market, and strategic recommendations for monetising and innovating services in the network API market.
The research suite includes a Competitor Leaderboard, which can be purchased separately; containing analysis and market sizing for 11 leading network API vendors, who are each working with operators to monetise network APIs.
Collectively, the suite provides a critical tool for understanding the network API market, allowing operators and other stakeholders to optimise their future business strategies and product or service development; providing them with a competitive advantage over their rivals.
All report content is delivered in the English language.
Key Features
Key Takeaways & Strategic Recommendations: In-depth analysis of key development opportunities and findings within the network API market. This is accompanied by strategic recommendations for operators, and other stakeholders in the market seeking to increase their revenue from network APIs.
Market Dynamics: Insights into key trends and opportunities in the network API market, including analysis of key APIs. It also includes a strategic analysis of the different business models that operators can leverage to monetise their network APIs.
Benchmark Industry Forecast: The suite provides five-year forecasts for the global network API market, including for the total number of network API calls and total operator revenue from network APIs. It is further split by the categories of authentication and fraud prevention, location services, communication services, communication quality, device information, computing services, and payments and charging.
Juniper Research Competitor Leaderboard: Key player capability and capacity assessment for 11 key vendors in the network API market, with market sizing and detailed analysis of each vendor's offering.
SAMPLE VIEW
Market Data & Forecasting Report
The numbers tell you what's happening, but our written report details why, alongside the methodologies.
SAMPLE VIEW
Market Trends & Strategies Report
A comprehensive analysis of the current market landscape, alongside strategic recommendations.
Market Data & Forecasting Report
The market-leading research for the "Network API" market includes access to the full set of forecast data; of 23,000 datapoints and over 50 tables.
Metrics in the research suite include:
Total Number of Network API Calls
Total Operator Revenue from Network APIs
Average Operator Network API Revenue Per Mobile Subscriber
Splits are provided for each of these metrics for Authentication and Fraud, Communication Quality, Communication Services, Computing Services, Device Information, Location Services, and Payments and Charging.
Juniper Research's Interactive Forecast Excel contains the following functionality:
Statistics Analysis: Users benefit from the ability to search for specific metrics; displayed for all regions and countries across the data period. Graphs are easily modified and can be exported to the clipboard.
Country Data Tool: This tool enables users to look at metrics for all regions and countries in the forecast period. Users can refine the metrics displayed via a search bar.
Country Comparison Tool: Users can select and compare specific countries. The ability to export graphs is included in this tool.
What-if Analysis: Here, users can compare forecast metrics against their own assumptions, via three interactive scenarios.
Market Trends & Strategies Report
This report thoroughly examines the global Network API market; assessing market trends, challenges to monetisation, and the different business models available to operators. Alongside this analysis, the report provides comprehensive evaluation of the different stable APIs which will drive revenue in the future, and explores how operators can best convert the development of APIs into future revenue streams.
Competitor Leaderboard Report
The Competitor Leaderboard included in this report provides detailed evaluation and market positioning for 11 network API vendors. These companies are positioned as established leaders, leading challengers, or disruptors and challengers; based on a capacity, capability, and product assessment. This includes analysis of their key advantages in the market, future development plans, and key partnerships.
The network API Competitor Leaderboard includes the following key vendors:
BTS
Comviva
Glide Identity
Infobip
Microsoft
Nokia
Sekura.id
Sinch
Symphonica
Syniverse
Vonage
Table of Contents
Market Trends & Strategies
1. Key Takeaways and Strategic Recommendations
1.1. Key Takeaways
1.2. Key Strategic Recommendations
2. Market Landscape
2.1. Introduction
2.1.1. The GSMA Open Gateway Initiative
Figure 2.1: Examples of Operators Who Have Joined the GSMA Open Gateway
2.1.2. The CAMARA Project
Figure 2.2: Select CAMARA Members
2.2. TM Forum and the GSMA Partnership
2.3. Current Market Status
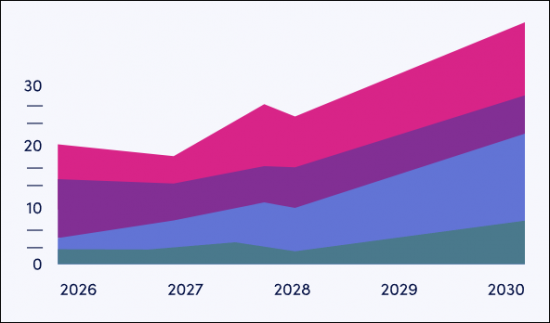
Figure 2.3: Total Operator Revenue from Network APIs ($m), Split by 8 Key Regions, 2025-2030
Table 2.4: Total Operator Revenue from Network APIs ($m), Split by API Category, 2025-2030
2.4. Key Distribution Channels for Network APIs
2.4.1. Operators
i. Multi-operator Platforms
2.4.2. Hyperscalers
2.4.3. CPaaS Providers
2.4.4. System Integrators
2.4.5. Network Infrastructure Vendors
2.5. Understanding Developers
2.5.1. Which Applications Are Developers Building?
i. Cellular IoT
Figure 2.5: Total Number of Cellular IoT Connections in 2030 (%), Split by 8 Key Regions
ii. Banks and Fintechs
Table 2.6: Examples of Moves Away from A2P SMS (June 2025)
iii. Gaming
iv. eCommerce
v. AI Applications
2.5.2. Marketing and Education Strategies
2.6. Business Model and Monetisation Strategies
i. When Is Charging a Premium Effective?
2.7. Cannibalisation Business Structure Changes
2.8. Business Systems
2.9. Operators Must Align Network API Strategies
2.10. Data Protections, Data Privacy, and Consent
2.11. Strategies Need to be Long-term, Not Short-term
Figure 2.7: Total Operator Revenue from Network APIs ($m), Split by 8 Key Regions, 2025-2030
3. Future Opportunities and Market Strategies
3.1. CAMARA's Scope
Figure 3.1: Types of CAMARA API
3.2. Meta-release Spring25
Figure 3.2: Total Operator Revenue from Network APIs ($m), Split by 8 Key Regions, 2025-2030
Figure 3.3: Meta-release Spring25
3.3. Stable APIs
3.3.1. Device Reachability Status
3.3.2. Device Roaming Status
3.3.3. Location Verification
3.3.4. Number Verification
Figure 3.4: Without Number Verification
3.3.5. One-time Password SMS
3.3.6. Quality of Service Profiles
3.3.7. Quality on Demand
Figure 3.5: Overview of Quality on Demand API
3.3.8. SIM Swap
3.3.9. Simple Edge Discovery
3.4. Future API Opportunities
3.4.1. KYC APIs
Figure 3.6: Total Spend on KYC and KYB Systems per annum ($m), Split by 8 Key Regions, 2024-2029
Figure 3.7: Total Spend on KYC/KYB Systems per annum ($m), Split by Select Key Industries, 2024-2029
3.4.2. Population Density Data
3.4.3. NaaS APIs
4. Country Readiness Index
4.1. Introduction to the Country Readiness Index
Figure 4.1: Juniper Research Country Readiness Index: Network API Market - Regional Definitions
Table 4.2: Juniper Research Country Readiness Index: Network API Market - Scoring Criteria
Figure 4.3: Juniper Research Country Readiness Index: Network API Market
Table 4.4: Network API Market Country Readiness Index: Market Segments
4.2. Focus Markets
4.2.2. China
Figure 4.5: Total Operator Revenue from Network APIs in China, 2024-2030
Table 4.6: GSMA-certified Network APIs in China, in June 2025
4.2.3. The US
Figure 4.7: Total Operator Revenue from Network APIs in the US ($m), Split by Network API Type, 2024-2030
Figure 4.8: US Operator Network API Deployments
4.3. Growth Markets
Figure 4.9: Network API High-growth Countries
4.3.1. Singapore
Table 4.10: Total Number of Network APIs in Singapore
Figure 4.11: Total Operator Revenue from Network APIs ($m) in Singapore, Split by Network API Category, 2024-2030
4.4. Developing Markets
Figure 4.12: Total Operator Revenue from Select Developing Markets ($m), 2025-2030
Table 4.13: Juniper Research Country Readiness Index Heatmap: North America
Table 4.14: Juniper Research Country Readiness Index Heatmap: Latin America
Table 4.15: Juniper Research Country Readiness Index Heatmap: West Europe
Table 4.16: Juniper Research Country Readiness Index Heatmap: Central & East Europe
Table 4.17: Juniper Research Country Readiness Index Heatmap: Far East & China
Table 4.18: Juniper Research Country Readiness Index Heatmap: Indian Subcontinent
Table 4.19: Juniper Research Country Readiness Index Heatmap: Rest of Asia Pacific
Table 4.20: Juniper Research Country Readiness Index Heatmap: Africa & Middle East
Competitor Leaderboard
1. Competitor Leaderboard
1.1. Why Read This Report
Table 1.1: Juniper Research Competitor Leaderboard: Network API Market - Vendors and Product Portfolios
Figure 1.2: Juniper Research Competitor Leaderboard: Network API Market - 11 Vendors
Table 1.3: Juniper Research Competitor Leaderboard: Network API Market - 11 Vendors & Positioning
Table 1.4: Juniper Research Competitor Leaderboard Heatmap: Network API Market - 11 Vendors
2. Vendor Profiles
2.1. Vendor Profiles
2.1.1. BTS Group
i. Corporate Information
ii. Geographical Spread
iii. Key Clients & Strategic Partnerships
iv. High-level View of Offerings
Figure 2.1: BTS' S1 Platform
v. Juniper Research's View: Key Strengths & Strategic Development Opportunities
2.1.2. Comviva
i. Corporate Information
ii. Geographical Spread
iii. Key Clients & Strategic Partnerships
iv. High-level View of Offerings
v. Juniper Research's View: Key Strengths & Strategic Development Opportunities
2.1.3. Glide Identity
i. Corporate Information
ii. Geographical Spread
iii. Key Clients & Strategic Partnerships
iv. High-level View of Offerings
v. Juniper Research's View: Key Strengths & Strategic Development Opportunities
2.1.4. Infobip
i. Corporate Information
Table 2.2: Infobip's Acquisitions - April 2021 to Present
ii. Geographical Spread
iii. Key Clients & Strategic Partnerships
iv. High-level View of Offerings
v. Juniper Research's View: Key Strengths & Strategic Development Opportunities
2.1.5. Microsoft
i. Corporate Information
ii. Geographical Spread
iii. Key Clients & Strategic Partnerships
iv. High-level View of Offerings
Figure 2.3: Azure Programmable Connectivity
v. Juniper Research's View: Key Strengths & Strategic Development Opportunities
2.1.6. Nokia
i. Corporate Information
Table 2.4: Nokia's Select Financial Information (Euro), 2021-2024
ii. Geographical Spread
iii. Key Clients & Strategic Partnerships
iv. High-level View of Offerings
v. Juniper Research's View: Key Strengths & Strategic Development Opportunities
2.1.7. Sekura.id
i. Corporate Information
ii. Geographical Spread
iii. Key Clients & Strategic Partnerships
iv. High-level View of Offerings
v. Juniper Research's View: Key Strengths & Strategic Development Opportunities
2.1.8. Sinch
i. Corporate Information
Table 2.5: Sinch's Most Recent Acquisitions, 2020-2021
Table 2.6: Sinch's Select Financial Information (SEKm), 2022-2024
ii. Geographical Spread
iii. Key Clients & Strategic Partnerships
iv. High-level View of Offerings
Figure 2.7: Sinch's Offerings
v. Juniper Research's View: Key Strengths & Strategic Development Opportunities
2.1.9. Symphonica
i. Corporate Information
ii. Geographical Spread
iii. Key Clients & Strategic Partnerships
iv. High-level View of Offerings
Figure 2.8: Symphonica Platform
v. Juniper Research's View: Key Strengths & Strategic Development Opportunities
2.1.10. Syniverse
i. Corporate Information
ii. Geographical Spread
iii. Key Clients & Strategic Partnerships
iv. High-level View of Offerings
v. Juniper Research's View: Key Strengths & Strategic Development Opportunities
2.1.11. Vonage
i. Corporate Information
ii. Geographical Spread
iii. Key Clients & Strategic Partnerships
iv. High-level View of Offerings.
v. Juniper Research's View: Key Strengths & Strategic Development Opportunities
2.2. Juniper Research Leaderboard Assessment Methodology
2.3. Limitations & Interpretations
Table 2.9: Juniper Research Competitor Leaderboard: Network API Market
3. Data & Forecasting Table of Contents
ii. Geographical Spread
iii. Key Clients & Strategic Partnerships
iv. High-level View of Offerings
v. Juniper Research's View: Key Strengths & Strategic Development Opportunities
2.1.7. Sekura.id
i. Corporate Information
ii. Geographical Spread
iii. Key Clients & Strategic Partnerships
iv. High-level View of Offerings
v. Juniper Research's View: Key Strengths & Strategic Development Opportunities
2.1.8. Sinch
i. Corporate Information
Table 2.5: Sinch's Most Recent Acquisitions, 2020-2021
Table 2.6: Sinch's Select Financial Information (SEKm), 2022-2024
ii. Geographical Spread
iii. Key Clients & Strategic Partnerships
iv. High-level View of Offerings
Figure 2.7: Sinch's Offerings
v. Juniper Research's View: Key Strengths & Strategic Development Opportunities
2.1.9. Symphonica
i. Corporate Information
ii. Geographical Spread
iii. Key Clients & Strategic Partnerships
iv. High-level View of Offerings
Figure 2.8: Symphonica Platform
v. Juniper Research's View: Key Strengths & Strategic Development Opportunities
2.1.10. Syniverse
i. Corporate Information
ii. Geographical Spread
iii. Key Clients & Strategic Partnerships
iv. High-level View of Offerings
v. Juniper Research's View: Key Strengths & Strategic Development Opportunities
2.1.11. Vonage
i. Corporate Information
ii. Geographical Spread
iii. Key Clients & Strategic Partnerships
iv. High-level View of Offerings.
v. Juniper Research's View: Key Strengths & Strategic Development Opportunities
2.2. Juniper Research Leaderboard Assessment Methodology
2.3. Limitations & Interpretations
Table 2.9: Juniper Research Competitor Leaderboard: Network API Market
Data & Forecasting
1. Introduction and Methodology
1.1. Introduction To Network APIs
Figure 1.1: Total Operator Revenue from Network APIs ($m), Split by Network API Type, 2025-2030
1.2. Forecast Methodology
Figure 1.2: Juniper Research Network API Market: Methodology Model
2. Market Summary and Future Market Outlook
2.1. Total Number of Network API Calls
Figure & Table 2.1: Total Number of Network API Calls (m), Split by 8 Key Regions, 2025-2030
2.2. Total Operator Revenue from Network APIs
Figure & Table 2.2: Total Operator Revenue from Network APIs ($m), Split By 8 Key Regions, 2025-2030
2.3. Total Number of Authentication and Fraud Prevention API Calls
Figure & Table 2.3: Total Number of Authentication and Fraud Prevention API Calls (m), Split by 8 Key Regions, 2025-2030
2.4. Total Operator Revenue from Authentication and Fraud Prevention APIs
Figure & Table 2.4: Total Operator Revenue ($m) from Authentication and Fraud APIs
2.5. Total Number of Location Services API Calls
Figure & Table 2.5: Total Number of Location Services API Calls (m), Split by 8 Key Regions, 2025-2030
2.6. Total Operator Revenue from Location Services APIs
Figure & Table 2.6: Total Operator Revenue from Location Services APIs ($m), Split by 8 Key Regions, 2025-2030
2.7. Total Number of Communication Services API Calls
Figure & Table 2.7: Total Number of Location Services API Calls (m), Split by 8 Key Regions, 2025-2030
2.8. Total Operator Revenue from Communication Services APIs
Figure & Table 2.8: Total Operator Revenue from Communication Services APIs ($m), Split by 8 Key Regions, 2025-2030
2.9. Total Number of Communication Quality API Calls
Figure & Table 2.9: Total Number of Communication Quality API Calls (m), Split by 8 Key Regions, 2025-2030
2.10. Total Operator Revenue from Communication Quality APIs
Figure & Table 2.10: Total Operator Revenue from Communication Quality APIs ($m), Split by 8 Key Regions, 2025-2030
2.11. Total Number of Device Information API Calls
Figure & Table 2.11: Total Number of Device Information API Calls (m), Split by Key Regions, 2025-2030
2.12. Total Operator Revenue from Device Information APIs
Figure & Table 2.12: Total Operator Revenue from Device Information APIs ($m), Split by 8 Key Regions, 2025-2030
2.13. Total Number of Computing Services API Calls
Figure & Table 2.13: Total Number of Computing Services API Calls (m), Split by Key Regions, 2025-2030
2.14. Total Operator Revenue from Computing Services APIs
Figure & Table 2.14: Total Operator Revenue from Computing Services APIs ($m), Split by 8 Key Regions, 2025-2030
2.15. Total Number of Payments and Charging API Calls
Figure & Table 2.15: Total Number of Payments and Charging API Calls (m), Split by 8 Key Regions, 2025-2030
2.16. Total Operator Revenue from Payments and Charging API Calls
Figure & Table 2.16: Total Operator Revenue from Payments and Charging APIs ($m), Split by 8 Key Regions, 2025-2030