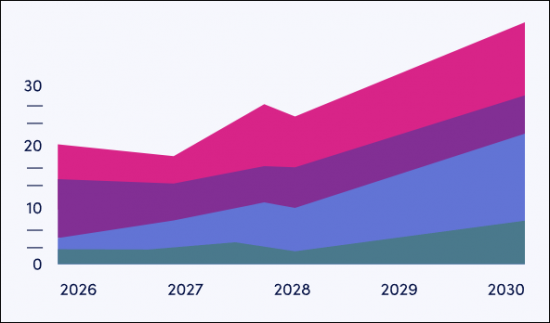
”비접촉 결제 시장 규모는 2030년까지 2배인 18조 1,000억 달러에 도달 - NFC 티켓 발권의 배포가 성장을 가속"
주요 통계
2025년 총거래액 :
8조 7,500억 달러
2030년 총거래액 :
18조 1,000억 달러
2025-2030년 시장 성장률 :
106.9%
예측 기간 :
2025-2030년
비접촉 결제 기술을 탑재한 모바일 지갑의 보급, 비접촉 트랜잭션의 성장과 관련 가치 등 시장 전체를 다룬 데이터를 제공하고 있습니다. 이 데이터 스위트에는 139개의 표와 6만 개 이상의 데이터 포인트로 구성된 예측 데이터의 풀세트에 대한 액세스와 성장 이유를 분석한 부속 리포트가 포함되어 있습니다. 본 조사 스위트에 포함되는 지표는 다음과 같습니다.
비접촉 결제의 이용자 수
비접촉 결제의 총거래액
비접촉 결제의 연간총거래액
리포트 내용은 모두 영어로 제공됩니다.
주요 특징 :
이 지표는 아래의 주요 부문별로 분류되어 있습니다. :
비접촉 카드
모바일 결제
Apple Pay
Google Pay
Samsung Pay
기타 OEM 페이
웨어러블 결제
비접촉 티켓 결제
예측 데이터에는 비접촉 토크나이제이션과 비접촉 대응 ATM의 시장 규모도 포함되어 있습니다.
데이터 & 인터랙티브 예측
인터랙티브 예측(Excel)에는 다음의 기능이 포함되어 있습니다. :
통계 분석 : 데이터 기간 중 전 지역·국가에 대해 표시되는 특정 지표를 검색할 수 있습니다. 그래프는 간단하게 변경할 수 있으며, 클립보드로 내보낼 수 있습니다.
국가별 데이터 툴 : 예측 기간 중 모든 지역과 국가의 지표를 볼 수 있습니다. 검색 바를 통해 표시되는 지표를 세분화할 수 있습니다.
국가별 비교 툴 : 특정 국가를 선택하여 비교할 수 있습니다. 이 툴에는 그래프를 내보내는 기능이 포함되어 있습니다.
What-if 분석 : 5개의 대화형 시나리오에 의해 사용자는 예측의 전제조건과 비교할 수 있습니다.
샘플 뷰
시장 데이터 & 예측 리포트
목차
제1장 서론
비접촉 결제에서 주요 동향과 동향
비접촉 결제가 디폴트 선택
점포에서의 A2A 비접촉 결제의 확대
소프트 POS가 비접촉 결제의 새로운 시장을 개발
국경간 QR코드 결제 스킴이 동남아시아의 비접촉 결제를 촉진
비접촉 결제의 다음 진화로서의 생체인식
QR코드 결제
i.강점
ii.약점
NFC
i.강점
ii.약점
결론
제2장 조사 방법과 전제
제3장 예측 요약
비접촉 결제 이용 예측
비접촉 메커니즘 : 카드, 모바일, 웨어러블
비접촉 결제에 사용되는 모바일 디바이스 수
비접촉 거래 건수 : 소매 결제 및 티켓 발권
비접촉 거래액 : 소매 결제 및 티켓 발권
제4장 비접촉 카드 결제
비접촉 카드 이용 예측
비접촉 결제 카드의 사용 상황
비접촉 카드 거래 예측
총거래 건수
총거래액
제5장 모바일 비접촉 결제
비접촉 모바일 이용 예측
비접촉 결제에 이용되는 NFC 대응 단말기
OEM Pay 비접촉 사용자 수
비접촉 모바일 소매 결제 거래 건수
비접촉 모바일 소매 결제 거래액
제6장 웨어러블 비접촉 결제
스마트 웨어러블 비접촉 결제 이용 예측
비접촉 결제를 실현하는 웨어러블
스마트 웨어러블 비접촉 결제 거래 건수
스마트 웨어러블 비접촉 결제 거래액
제7장 NFC 티켓
NFC 티켓 이용 예측
NFC 티켓 사용자
NFC 티켓 거래 건수
NFC 티켓 거래액
제8장 비접촉 토큰화
비접촉 토큰화 예측
비접촉 토큰화 건수
비접촉 토큰화 매출
제9장 비접촉 ATM
비접촉 ATM 예측
비접촉 ATM 가동 상황
KSA
영문 목차
영문목차
'Contactless Payment Value to Double by 2030, Reaching $18.1 Trillion, Accelerated by NFC Ticketing Roll-outs'
KEY STATISTICS
Total transaction value in 2025:
$8.75tn
Total transaction value in 2030:
$18.1tn
2025 to 2030 market growth:
106.9%
Forecast period:
2025-2030
Overview
Our "Contactless Payments" market analysis provides exhaustive data coverage of the market in its entirety, including the adoption of mobile wallets featuring contactless payment technology, the growth of contactless transactions and its associated values. The data suite includes access to the full set of forecast data of 139 tables and over 60,000 datapoints, as well as an accompanying report analysing the reasons for growth. The metrics comprised in the research suite include:
The number of users of contactless payments
The total transaction value of contactless payments
The total volume of contactless payments made annually.
All report content is delivered in the English language.
Key Features
These metrics are split by the following key segments:
Contactless Cards
Mobile Payments, further split by:
Apple Pay
Google Pay
Samsung Pay
Other Original Equipment Manufacturer (OEM) Pay
Wearable Payments
Contactless Ticketing Payments
The forecast data also includes market sizing for contactless tokenisation and contactless-enabled ATMs.
The data itself is accompanied by a Data & Forecasting report; analysing the main drivers of growth across key forecast metrics, as well as explaining the fundamental methodology and assumptions involved. Taken together, the research is a vital tool for sizing the contactless payments market.
Data & Interactive Forecast
Juniper Research's Interactive Forecast Excel contains the following functionality:
Statistics Analysis: Users benefit from the ability to search for specific metrics, displayed for all regions and countries across the data period. Graphs are easily modified and can be exported to the clipboard.
Country Data Tool: This tool lets users look at metrics for all regions and countries in the forecast period. Users can refine the metrics displayed via a search bar.
Country Comparison Tool: Users can select and compare specific countries. The ability to export graphs is included in this tool.
What-if Analysis: Here, users can compare forecast metrics against their own assumptions, via 5 interactive scenarios.
SAMPLE VIEW
Market Data & Forecasting Report
The numbers tell you what's happening, but our written report details why, alongside the methodologies.
Table of Contents
1. Introduction
1.1. Introduction
1.2. Key Trends & Developments Within Contactless Payments
1.2.1. Contactless Payments Are the Default Choice
1.2.2. Expansion of A2A Contactless Payments In-store
Figure 1.1: Google Pay UPI Tap & Pay Methods
1.2.3. Soft POS Is Opening New Markets for Contactless
Figure 1.2: How to Use Soft POS
Figure 1.3: Tap to Pay on iPhone
1.2.4. Cross-border QR Code Payment Schemes Will Boost Contactless Payments in Southeast Asia
Figure 1.4: Prominent Advances in Cross-border QR Code Schemes in 2025: Southeast Asia
1.2.5. Biometrics as the Next Evolution of Contactless Payments