


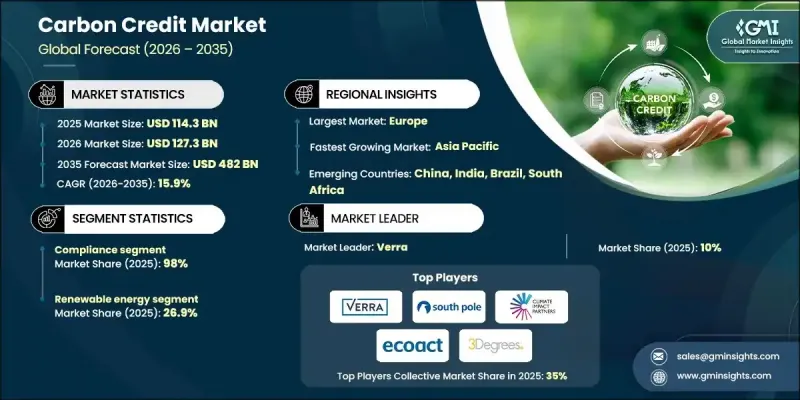
세계의 탄소배출권 시장은 2025년에 1,143억 달러로 평가되었으며, 2035년까지 CAGR 15.9%로 성장하여 4,820억 달러에 달할 것으로 예측됩니다.

시장 성장은 세계 기후 규제 강화, 기업의 넷제로 목표 증가, 온실가스 감축을 위한 시장 기반 메커니즘의 채택 확대에 의해 촉진되고 있습니다. 탄소배출권은 정부와 기업이 배출량을 상쇄하는 동시에 재생에너지, 삼림 재생, 메탄 회수 등 기후변화 완화 프로젝트를 지원하는 중요한 금융 수단으로 부상하고 있습니다. 탄소시장이 각국의 기후정책과 배출권거래제도에 통합되는 움직임이 진행되면서 시장의 투명성과 유동성이 향상되고 있습니다. 또한, 투자자와 소비자의 환경적 책임에 대한 압력이 증가함에 따라 조직은 장기적인 지속가능성 전략의 일환으로 탄소배출권 거래에 적극적으로 참여해야 하는 상황에 직면해 있습니다.
| 시장 범위 | |
|---|---|
| 시작 연도 | 2025년 |
| 예측 연도 | 2026-2035 |
| 개시 금액 | 1,143억 달러 |
| 예측 금액 | 4,820억 달러 |
| CAGR | 15.9% |
유형별로는 규제 대상 배출권 거래제의 의무적 배출량 감축 프레임워크에 따라 규제 준수 탄소배출권 부문이 2025년 98%의 점유율을 차지했습니다. 컴플라이언스 시장은 주로 발전, 제조 및 중공업 부문에 부과된 엄격한 규제 요건에 의해 주도되고 있으며, 이는 탄소 배출량을 제한하는 것을 목표로 하고 있습니다. 이러한 크레딧은 규제 대상 사업체가 배출량 목표를 달성할 수 있는 유연성을 제공함과 동시에 사업 연속성을 유지할 수 있도록 합니다. 표준화된 검증 메커니즘, 정부 감독, 예측 가능한 수요 등의 장점으로 인해 탄소배출권 거래제는 전 세계 탈탄소화 노력의 기반이 되고 있습니다.
재생에너지 부문은 화석연료 의존도를 낮추기 위한 풍력, 태양광, 수력, 바이오 에너지 프로젝트에 대한 대규모 투자로 2025년 26.9%의 점유율을 차지했습니다. 재생에너지 프로젝트는 탄소집약적 발전을 대체하여 탄소배출권을 창출하기 때문에 컴플라이언스 시장과 자발적 시장 모두에서 매우 매력적입니다. 유틸리티 회사, 독립 발전 사업자, 프로젝트 개발자들은 프로젝트의 실행 가능성을 높이고 추가 수익원을 확보하기 위해 이러한 크레딧을 수익화하는 사례가 증가하고 있습니다. 이 분야는 강력한 정책적 지원, 장기 전력 구매 계약, 청정에너지 기반 오프셋에 대한 기업의 수요 확대의 혜택을 누리고 있습니다.
유럽의 탄소배출권 시장은 확립된 EU 배출권거래제(EU ETS)에 힘입어 2026년부터 2035년까지 CAGR 15.9%로 확대될 것으로 예상됩니다. 이 지역은 엄격한 기후 규제, 선진적인 감시 체계, 탄소 중립을 향한 강력한 정치적 의지를 가지고 있습니다. 유럽의 산업계는 배출 상한선을 준수하면서 운영비용을 최적화하기 위해 탄소 거래에 적극적으로 참여하고 있습니다. 국경 간 거래 메커니즘의 확대와 EU 배출권 거래제도에 대한 추가 부문의 통합이 진행됨에 따라 유럽은 세계 탄소배출권 생태계에서 선도적인 위치를 더욱 강화해 나가고 있습니다.
The Global Carbon Credit Market was valued at USD 114.3 billion in 2025 and is estimated to grow at a CAGR of 15.9% to reach USD 482 billion by 2035.
Market growth is driven by tightening global climate regulations, rising corporate net-zero commitments, and increasing adoption of market-based mechanisms to reduce greenhouse gas emissions. Carbon credits have emerged as a critical financial instrument enabling governments and corporations to offset emissions while supporting climate mitigation projects such as renewable energy, reforestation, and methane capture. The growing integration of carbon markets into national climate policies and emissions trading systems is enhancing market transparency and liquidity. Additionally, increasing pressure from investors and consumers for environmental accountability is compelling organizations to actively participate in carbon credit trading as part of long-term sustainability strategies.
| Market Scope | |
|---|---|
| Start Year | 2025 |
| Forecast Year | 2026-2035 |
| Start Value | $114.3 Billion |
| Forecast Value | $482 Billion |
| CAGR | 15.9% |
Based on type, the compliance carbon credits segment held 98% share in 2025, owing to mandatory emission reduction frameworks under regulated emissions trading schemes. Compliance markets are primarily driven by strict regulatory mandates imposed on power generation, manufacturing, and heavy industrial sectors to limit carbon emissions. These credits provide regulated entities with flexibility to meet emission targets while maintaining operational continuity. The segment benefits from standardized verification mechanisms, government oversight, and predictable demand, making compliance carbon credits a cornerstone of global decarbonization efforts.
The renewable energy segment held 26.9% share in 2025, driven by large-scale investments in wind, solar, hydro, and bioenergy projects aimed at reducing dependence on fossil fuels. Renewable energy projects generate carbon credits by displacing carbon-intensive power generation, making them highly attractive for both compliance and voluntary markets. Utilities, independent power producers, and project developers increasingly monetize these credits to improve project viability and secure additional revenue streams. The segment benefits from strong policy support, long-term power purchase agreements, and growing corporate demand for clean energy-backed offsets.
Europe Carbon Credit Market will grow at a CAGR of 15.9% through 2026-2035, supported by the well-established EU Emissions Trading System (EU ETS). The region benefits from stringent climate regulations, advanced monitoring frameworks, and strong political commitment toward carbon neutrality. European industries actively participate in carbon trading to comply with emission caps while optimizing operational costs. The expansion of cross-border trading mechanisms and integration of additional sectors into the EU ETS continue to strengthen Europe's leadership in the global carbon credit ecosystem.
Key players operating in the Global Carbon Credit Market include Verra, Gold Standard Foundation, Climate Impact X, South Pole, Carbon Trust, EcoAct, Shell plc, BP plc, TotalEnergies, and ENGIE, among others. These companies focus on project development, credit certification, digital trading platforms, and corporate decarbonization advisory services to expand their market footprint. Companies in the Carbon Credit Market are strengthening their market position through strategic investments in high-integrity carbon projects, digital trading platforms, and verification technologies. Leading players focus on expanding renewable energy, forestry, and nature-based projects to ensure long-term credit availability and quality. Partnerships with governments, corporates, and financial institutions help scale trading volumes and improve market transparency. Firms are also leveraging blockchain and AI-driven monitoring tools to enhance traceability, prevent double-counting, and build buyer confidence.