Dry Bulk Shipping Market Opportunity, Growth Drivers, Industry Trend Analysis, and Forecast 2026 - 2035
상품코드:1913472
리서치사:Global Market Insights Inc.
발행일:2026년 01월
페이지 정보:영문 225 Pages
라이선스 & 가격 (부가세 별도)
ㅁ Add-on 가능: 고객의 요청에 따라 일정한 범위 내에서 Customization이 가능합니다. 자세한 사항은 문의해 주시기 바랍니다.
한글목차
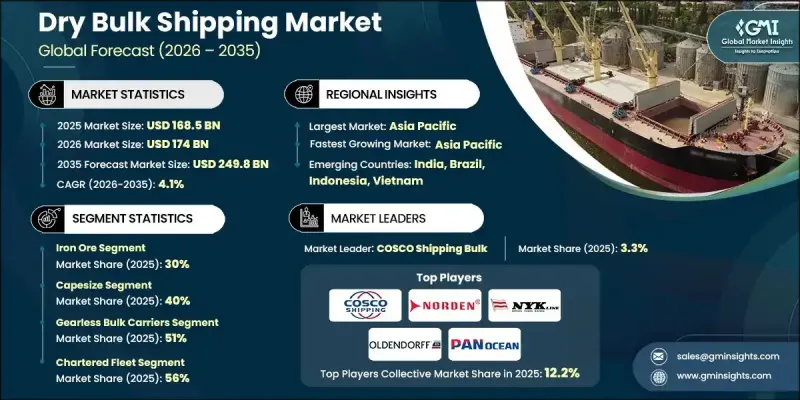
세계의 드라이 벌크 해운 시장은 2025년에 1,685억 달러로 평가되었으며, 2035년까지 연평균 복합 성장률(CAGR) 4.1%로 성장하여 2,498억 달러에 이를 것으로 예측됩니다.
시장의 발전은 세계 무역 활동과 선대의 운영과 선박의 동향을 재구성하는 진화하는 규제 프레임 워크와 밀접하게 관련되어 있습니다. 선박의 효율성과 배출 성능에 대한 컴플라이언스 요건은 배치 결정 및 운영 비용에 점차 영향을 미치고 있습니다. 세계 드라이버 루크 선대의 대부분은 권장 효율성 평가 기준을 밑돌고 있는 것으로 보고되었으며, 선주는 연료 성능 향상과 선대 현대화를 위한 투자를 가속화하고 있습니다. 에너지 효율과 탄소 강도를 대상으로 한 규제 조치로 환경 최적화 선박의 도입이 진행되어 연료 소비량과 배출량의 대폭적인 삭감에 공헌하고 있습니다. 또한, 보다 효율적인 선대 운영을 지원하는 디지털 해운 기술의 통합으로 업계의 성능이 향상되었습니다. 고급 분석 및 관리 플랫폼은 항로 최적화, 보수 계획, 연료 관리 개선에 기여함과 동시에 혼잡 과제와 변동하는 운임 상황에 대한 대응을 지원하고 있습니다. 이러한 복합적 요인에 의해 효율성, 규제 준수, 디지털 능력이 드라이 벌크 해운 시장의 장기적인 진화를 형성하는 핵심 추진력으로 자리매김하고 있습니다.
시장 범위
시작 연도
2025년
예측 연도
2026-2035년
시작 금액
1,685억 달러
예측 금액
2,498억 달러
CAGR
4.1%
대형 드라이버 루크 선박 부문은 2025년에 45%의 점유율을 차지했고, 플릿 관리 및 예측 분석 솔루션을 활용하여 운항되고 있습니다. 이러한 시스템은 해운회사가 항해계획의 개선, 예기치 않은 다운타임의 삭감, 연료 사용의 효율적인 관리, 상항에서의 혼잡이나 변동하는 운임에 의한 혼란의 억제를 가능하게 하는 것으로 설명되고 있습니다.
케이프 사이즈 부문은 2025년에 40%의 점유율을 차지했고 2026년부터 2035년에 걸쳐 CAGR 4.3%로 성장할 것으로 예측됩니다. 케이프 사이즈 선박은 적재 능력에서 드라이버 루크 선대 내에서 가장 큰 카테고리로 위치하고 있습니다. 업계 평가에 따르면, 2024년 기준에서 이러한 선박은 세계의 드라이버 루크 선대 총재화 중량의 약 40%를 차지하고, 주로 주요 국제 무역 회랑에서의 장거리 수송을 지지하고 있습니다.
기어리스 벌크 캐리어 부문은 2025년 51%의 점유율을 차지했습니다. 이 선박은 선상화물 취급 설비를 장비하지 않은 점이 특징이며, 2024년에는 세계의 드라이버 루크화물 총재화 중량의 55%를 차지했습니다. 광범위한 사용은 운영 효율성과 현대 항구 인프라 간의 호환성 때문입니다.
중국의 드라이 벌크 해운 시장은 66%의 점유율을 차지했으며, 2025년에는 538억 달러의 수익을 창출했습니다. 이 나라의 우위는 주요 원재료의 대규모 수입국으로서의 역할에 기인합니다. 공식 무역 데이터에 따르면 2024년에는 12억 톤 이상의 철광석이 수입되었으며, 이는 세계 해상 수송량의 약 70%에 해당합니다.
목차
제1장 조사 방법
제2장 주요 요약
제3장 업계 인사이트
생태계 분석
공급업체 현황
수익률 분석
비용 구조
단계별 부가가치
밸류체인에 영향을 주는 요인
혁신
업계에 미치는 영향요인
성장 촉진요인
증가하는 세계의 해상무역
산업 생산 및 철강 생산 성장
농업무역 확대
선대의 현대화와 효율화
업계의 잠재적 위험 및 과제
항만의 혼잡과 인프라의 병목
용선료의 변동성
시장 기회
선대 교체 및 친환경 고효율 선박
무역 루트의 다양화
디지털 해운 솔루션과의 통합
성장 가능성 분석
규제 상황
북미
미국 연안경비대(USCG) 해사안전규제
환경보호청(EPA) 선박 배출 기준
존스법 준수 및 내항규칙
유럽
유럽해사안전청(EMSA) 가이드라인
EU 황 지침 및 MARPOL Annex VI
EU 선박 안전 인증 규제
EU 형식 승인 및 기국 요구사항
평형수 관리 협약
항만국 검사(PSC)
아시아태평양
중국 선박 배출 기준과 MARPOL 조약 준수
인도 해운 총국의 규제
일본의 선박 안전 및 연료 효율 기준
ASEAN 해사규제 및 지역 가이드라인
대형 선박의 운항 안전 기준
라틴아메리카
브라질 ANTAQ 표준
아르헨티나의 선박 안전 및 환경 규제
멕시코 통신 운수부(SCT) 선박 기준
MERCOSUR 해상 운송 규제 정렬
중동 및 아프리카
아랍에미리트(UAE) 연방 해사법
사우디아라비아 항만청 및 해운 규제
남아프리카 해사안전청(SAMSA)의 규제
동아프리카 공동체(EAC) 해사 및 선박 기준
Porter's Five Forces 분석
PESTEL 분석
기술과 혁신 동향
현재의 기술 동향
신규 기술
가격 동향
지역별
제품별
코스트 내역 분석
선박 취득 비용
승무원 및 인력 배치 비용
운항 및 유지 보수 비용
규제 및 컴플라이언스 비용
연료비 및 벙커 비용
특허 분석
지속가능성과 환경면
지속가능한 실천
폐기물 감축 전략
생산에 있어서의 에너지 효율
친환경 이니셔티브
탄소발자국에 관한 고려 사항
건조 벌크 해운에서의 탈탄소화의 길
국제해사기관(IMO) 2030년/2050년 목표의 영향
연료 옵션 : LNG, 메탄올, 암모니아, 바이오연료
개조와 신조에 있어서의 탈탄소화의 경제성 비교
탄소 가격제 및 ETS(탄소배출권 거래제) 노출 위험
선대 수급 밸런스 및 수주 잔량 분석
가동선대와 수요성장의 균형
선박 클래스별 수주 상황 분석
노후선 해체(Scrapping) 및 폐선 동향
순 선대 증가 전망(2026-2035)
운임 및 용선 계약 분석
시간 용선 vs. 항해 용선 동향
스팟 시장과 계약 시장의 분석
발틱 해운 지수(BDI)의 과거 동향과 예측
운임 변동과 리스크 경감 전략
화주 및 선주 간 협상 역학
신조선 및 조선소 현황
조선소별 및 국가별 수주 상황
신규 조선 가격의 동향
조선소의 생산 능력 제약
인도 지연 및 지연 위험
제4장 경쟁 구도
소개
기업의 시장 점유율 분석
북미
유럽
아시아태평양
라틴아메리카
중동 및 아프리카
주요 시장 기업의 경쟁 분석
경쟁 포지셔닝 매트릭스
전략적 전망 매트릭스
주요 발전
합병 및 인수
제휴 및 협업
신제품 발매
사업 확대 계획과 자금 조달
제5장 시장 추정 및 예측 : 상품별, 2022-2035
철광석
석탄
곡물
보크사이트
니켈
철강
비료
기타
제6장 시장 추정 및 예측 : 선박별, 2022-2035
케이프 사이즈
핸디 사이즈
파나맥스
핸디맥스
기타
제7장 시장 추정 및 예측 : 설계별, 2022-2035
기어리스 벌크선
기존 벌크선
복합 벌크선
자기 배출
벌커 레이크선
기타
제8장 시장 추정 및 예측 : 사업별, 2022-2035
소유 차량
전세선대
제9장 시장 추정 및 예측 : 무역 루트별, 2022-2035
장거리 무역
근해 무역
제10장 시장 추정 및 예측 : 지역별, 2022-2035
북미
미국
캐나다
유럽
독일
영국
프랑스
이탈리아
스페인
러시아
북유럽 국가
네덜란드
스웨덴
아시아태평양
중국
인도
일본
호주
한국
싱가포르
태국
인도네시아
베트남
라틴아메리카
브라질
멕시코
아르헨티나
중동 및 아프리카
남아프리카
사우디아라비아
아랍에미리트(UAE)
튀르키예
제11장 기업 프로파일
세계 기업
COSCO Shipping Bulk
Oldendorff Carriers
Pacific Basin
Star Bulk
Golden Ocean
Diana Shipping
Genco Shipping &Trading
Bahri Dry Bulk
Polsteam
Eastern Bulk
지역 기업
Eagle Bulk Shipping
Navios Maritime Partners
Safe Bulkers
Fednav
Belships
신규기업/디스럽터
Scorpio Bulkers
Ultrabulk
Western Bulk
Wilson Shipping
VARAMAR
SHW
영문 목차
영문목차
The Global Dry Bulk Shipping Market was valued at USD 168.5 billion in 2025 and is estimated to grow at a CAGR of 4.1% to reach USD 249.8 billion by 2035.
Market development is closely tied to global trade activity and evolving regulatory frameworks that are reshaping fleet operations and charter dynamics. Compliance requirements related to vessel efficiency and emissions performance are increasingly influencing deployment decisions and operating costs. A large share of the global dry bulk fleet is reported to fall below preferred efficiency ratings, prompting shipowners to accelerate investments aimed at improving fuel performance and modernizing fleets. Regulatory measures targeting energy efficiency and carbon intensity have driven higher adoption of environmentally optimized vessels, contributing to measurable reductions in fuel consumption and emissions. Industry performance is further being enhanced through the integration of digital shipping technologies that support more efficient fleet utilization. Advanced analytics and management platforms are improving route optimization, maintenance planning, and fuel management, while also helping operators respond to congestion challenges and fluctuating freight conditions. These combined factors are positioning efficiency, compliance, and digital capability as central drivers shaping the long-term evolution of the dry bulk shipping market.
Market Scope
Start Year
2025
Forecast Year
2026-2035
Start Value
$168.5 Billion
Forecast Value
$249.8 Billion
CAGR
4.1%
The large dry bulk vessels segment held 45% share in 2025, operating with fleet management and predictive analytics solutions. These systems are described as enabling shipping companies to enhance voyage planning, reduce unplanned downtime, manage fuel usage more effectively, and limit disruptions caused by congestion at merchant ports and volatile freight rates.
The capesize segment held 40% share in 2025 and is projected to grow at a CAGR of 4.3% from 2026 to 2035. Capesize vessels are identified as the largest category within the dry bulk fleet by carrying capacity. Industry assessments indicate that these vessels represented approximately 40% of global dry bulk fleet deadweight tonnage in 2024, primarily supporting long-haul transportation along major international trade corridors.
The gearless bulk carriers segment held a 51% share in 2025. These vessels are characterized by the absence of onboard cargo-handling equipment and represented 55% of total global dry bulk cargo deadweight tonnage in 2024. Their widespread use is attributed to operational efficiency and compatibility with modern port infrastructure.
China Dry Bulk Shipping Market held 66% share, generating USD 53.8 billion in 2025. The country's dominance is linked to its role as a major importer of key raw materials. Official trade data indicate that more than 1.2 billion tons of iron ore were imported in 2024, representing close to 70% of global seaborne volumes.
Key participants active in the Global Dry Bulk Shipping Market include COSCO Shipping Bulk, Star Bulk, Pacific Basin, Oldendorff Carriers, Golden Ocean, Diana Shipping, Genco Shipping & Trading, Polsteam, Bahri, and Eastern Bulk. Companies operating in the Global Dry Bulk Shipping Market are strengthening their market position by prioritizing fleet efficiency, regulatory compliance, and digital transformation. Many operators are investing in newer vessels and retrofitting existing fleets to improve energy performance and meet evolving environmental standards. Adoption of data-driven fleet management platforms is being used to enhance operational visibility and cost control. Strategic fleet renewal programs and long-term charter agreements are helping stabilize earnings and reduce exposure to market volatility. Geographic diversification of trade routes is also being pursued to balance demand fluctuations.
Table of Contents
Chapter 1 Methodology
1.1 Research approach
1.2 Quality Commitments
1.2.1 GMI AI policy & data integrity commitment
1.2.1.1 Source consistency protocol
1.3 Research Trail & Confidence Scoring
1.3.1 Research Trail Components
1.3.2 Scoring Components
1.4 Data Collection
1.4.1 Partial list of primary sources
1.5 Data mining sources
1.5.1 Paid sources
1.5.1.1 Sources, by region
1.6 Base estimates and calculations
1.6.1 Base year calculation for any one approach
1.7 Forecast model
1.7.1 Quantified market impact analysis
1.7.1.1 Mathematical impact of growth parameters on forecast
1.8 Research transparency addendum
1.8.1 Source attribution framework
1.8.2 Quality assurance metrics
1.8.3 Our commitment to trust
Chapter 2 Executive Summary
2.1 Industry 360° synopsis, 2022 - 2035
2.2 Key market trends
2.2.1 Regional
2.2.2 Commodity
2.2.3 Vessel
2.2.4 Design
2.2.5 Operation
2.2.6 Trade Route
2.3 TAM Analysis, 2026-2035
2.4 CXO perspectives: Strategic imperatives
2.4.1 Executive decision points
2.4.2 Critical success factors
2.5 Future outlook and strategic recommendations
Chapter 3 Industry Insights
3.1 Industry ecosystem analysis
3.1.1 Supplier landscape
3.1.2 Profit margin analysis
3.1.3 Cost structure
3.1.4 Value addition at each stage
3.1.5 Factor affecting the value chain
3.1.6 Disruptions
3.2 Industry impact forces
3.2.1.1 Growth drivers
3.2.1.2 Increasing global seaborne trade
3.2.1.3 Industrial and steel production growth
3.2.1.4 Expanding agricultural trade
3.2.1.5 Fleet modernization and efficiency
3.2.2 Industry pitfalls and challenges
3.2.2.1 Port congestion and infrastructure bottlenecks
3.2.2.2 Volatility in charter rates
3.2.3 Market opportunities
3.2.3.1 Fleet renewal and eco-efficient vessels
3.2.3.2 Trade route diversification
3.2.3.3 Integration with digital shipping solutions
3.3 Growth potential analysis
3.4 Regulatory landscape
3.4.1 North America
3.4.1.1 US Coast Guard (USCG) Maritime Safety Regulations