콘드로이틴 황산 시장 : 기회, 성장 요인, 산업 동향 분석 및 예측(2026-2035년)
Chondroitin Sulphate Market Opportunity, Growth Drivers, Industry Trend Analysis, and Forecast 2026 - 2035
상품코드:1913442
리서치사:Global Market Insights Inc.
발행일:2025년 12월
페이지 정보:영문 210 Pages
라이선스 & 가격 (부가세 별도)
ㅁ Add-on 가능: 고객의 요청에 따라 일정한 범위 내에서 Customization이 가능합니다. 자세한 사항은 문의해 주시기 바랍니다.
한글목차
세계의 콘드로이틴 황산 시장은 2025년 15억 달러로 평가되었으며, 2035년까지 연평균 복합 성장률(CAGR) 5.3%로 성장하여 24억 달러에 이를 것으로 예측됩니다.
고령화가 진행되는 세계 각국이나 건강 지향의 소비자층에 있어서, 관절의 건강에 대한 의식이 계속 증가하는 가운데, 본 시장은 꾸준한 성장을 이루고 있습니다. 관절의 불쾌감과 가동성과 관련된 증상의 발생률 증가가 콘드로이틴 황산을 배합한 영양 보조 식품이나 기능성 제품의 소비 확대를 뒷받침하고 있습니다. 또, 천연 유래이며 책임 있는 조달 방법에 의한 원료로 소비자 기호가 변화한 것이 시장에 돌풍이 되어, 고품질의 제제에 수요를 강화하고 있습니다. 제조방법의 진보에 의해 순도, 균일성 및 생산 규모의 확대를 도모하는 한편, 지속가능성 목표 달성도 지원되고 있습니다. 반려동물과 가축 건강 분야에서의 성장은 반려동물 영양에서 관절 지원 제제의 중요성이 증가함에 따라 응용 범위를 더욱 확대하고 있습니다. 디지털 소매 채널은 시장 액세스를 강화하고 브랜드가 보다 광범위한 소비자층에 도달하는 동시에 제품의 투명성과 편의성을 제공할 수 있습니다. 이러한 동향이 결합되어 인간 영양, 수의학적 용도, 건강 지향 제품 카테고리 전체에서 콘드로이틴 황산의 장기 수요를 강화하고 있습니다.
시장 범위
시작 연도
2025년
예측 연도
2026-2035년
시작 규모
15억 달러
예측 금액
24억 달러
CAGR
5.3%
소 유래 콘드로이틴 황산 부문은 2025년 39.3%의 점유율을 차지했습니다. 이 원료는 관절 건강 보충제의 뛰어난 기능성과 보충제 제조 업계의 확고한 지위로 인해 널리 사용되고 있습니다.
분말 콘드로이틴 황산 분절은 2025년 55.9%의 점유율을 차지했습니다. 이 형태의 이점은 제형의 유연성, 보충제에 대한 쉬운 제형성, 깨끗한 라벨 및 맞춤형 영양 동향과의 호환성에 의해 지원됩니다.
북미의 콘드로이틴 황산 시장은 2025년 38.2%의 점유율을 차지했습니다. 이 지역에서는 관절 건강에 대한 소비자의 높은 의식, 보충제의 보급, 성숙한 영양 보조 식품 산업을 배경으로 계속 강한 수요가 보입니다. 미국은 투명성이 높은 조달과 품질 중심의 배합에 대한 강한 선호에 힘입어 주요 공헌 지역으로 남아 있습니다.
목차
제1장 조사 방법과 범위
제2장 주요 요약
제3장 업계 인사이트
생태계 분석
공급자의 상황
이익률
각 단계에서의 부가가치
밸류체인에 영향을 주는 요인
혁신
업계에 미치는 영향요인
성장 요인
업계의 잠재적 위험 및 과제
시장 기회
성장 가능성 분석
규제 상황
북미
유럽
아시아태평양
라틴아메리카
중동 및 아프리카
Porter's Five Forces 분석
PESTEL 분석
가격 동향
미래 시장 동향
기술과 혁신 동향
현재의 기술 동향
신흥기술
특허 상황
무역 통계(HS코드)(참고 : 무역 통계는 주요 국가에서만 제공됨)
주요 수입국
주요 수출국
제4장 경쟁 구도
소개
기업의 시장 점유율 분석
지역별
북미
유럽
아시아태평양
라틴아메리카
중동 및 아프리카
기업 매트릭스 분석
주요 시장 기업의 경쟁 분석
경쟁 포지셔닝 매트릭스
주요 발전
인수합병
제휴 및 협업
신제품 발매
사업 확대 계획
제5장 시장 추계 및 예측 : 소스별, 2022-2035년
소
돼지
조류
닭
터키
기타
해양
참치
연어
기타
기타
제6장 시장 추계 및 예측 : 형태별, 2022-2035년
분말
캡슐 및 정제
액제
제7장 시장 추계 및 예측 : 용도별, 2022-2035년
영양보조식품
캡슐
태블릿
구미
의약품
골관절염 치료제
관절 건강 제품
화장품 및 퍼스널케어
안티 에이징 크림
피부 보습 제품
식품 및 음료
기타
제8장 시장 추계 및 예측 : 유통 채널별, 2022-2035년
직접 판매
리셀러
온라인 소매
약국
제9장 시장 추계 및 예측 : 지역별, 2022-2035년
북미
미국
캐나다
유럽
독일
영국
프랑스
스페인
이탈리아
기타 유럽
아시아태평양
중국
인도
일본
호주
한국
기타 아시아태평양
라틴아메리카
브라질
멕시코
아르헨티나
기타 라틴아메리카
중동 및 아프리카
사우디아라비아
남아프리카
아랍에미리트(UAE)
기타 중동 및 아프리카
제10장 기업 프로파일
TSI Group Ltd.
Synutra Ingredients(Shandong) Co., Ltd.
Yantai Dongcheng Pharmaceutical Group Co., Ltd.
Jiaxing Hengjie Biopharmaceutical Co., Ltd.
Qufu Liyang Biochem Industrial Co., Ltd.
Pacific Rainbow International, Inc.
Shandong Runxin Biotechnology Co., Ltd.
ZPD A/S
Guangdong Hybribio Biotech Co., Ltd.
Wanbury Limited
Sierra Ingredients Pty Ltd.
BGM Pharmaceuticals Co., Ltd.
YBCC(Qingdao) Co., Ltd.
Anhui Jintung Fine Chemical Corporation Ltd.
JHS
영문 목차
영문목차
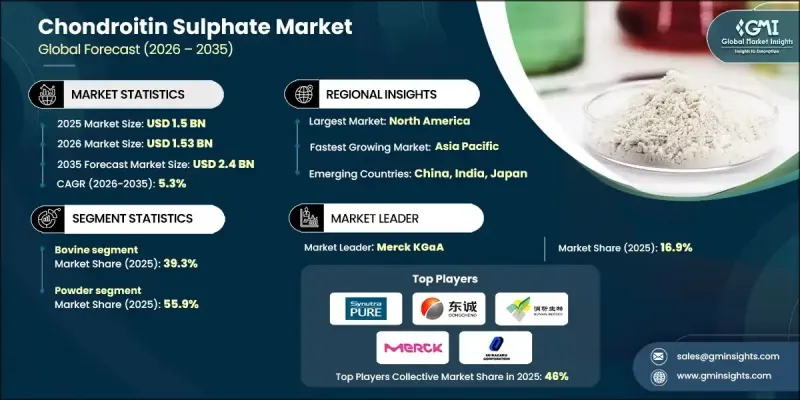
The Global Chondroitin Sulphate Market was valued at USD 1.5 billion in 2025 and is estimated to grow at a CAGR of 5.3% to reach USD 2.4 billion by 2035.
The market is gaining steady momentum as awareness around joint health continues to rise among aging populations and health-focused consumers worldwide. The increasing incidence of joint discomfort and mobility-related conditions is encouraging greater consumption of nutritional supplements and functional products formulated with chondroitin sulphate. The market is also benefiting from shifting consumer preferences toward naturally derived and responsibly sourced ingredients, reinforcing demand for high-quality formulations. Advancements in production methods are improving purity, consistency, and scalability while supporting sustainability goals. Growth in the companion animal and livestock wellness space is further expanding application scope, as joint-support formulations gain importance in pet nutrition. Digital retail channels are strengthening market access, enabling brands to reach a broader consumer base while offering product transparency and convenience. Collectively, these dynamics are reinforcing long-term demand for chondroitin sulphate across human nutrition, veterinary applications, and wellness-focused product categories.
Market Scope
Start Year
2025
Forecast Year
2026-2035
Start Value
$1.5 Billion
Forecast Value
$2.4 Billion
CAGR
5.3%
The bovine-based chondroitin sulphate segment accounted for 39.3% share in 2025. This source continues to see widespread use due to its strong functional performance in joint health formulations and its established presence across supplement manufacturing.
The powdered chondroitin sulphate segment held 55.9% share in 2025. The dominance of this form is supported by its formulation flexibility, ease of incorporation into supplements, and alignment with clean-label and customizable nutrition trends.
North America Chondroitin Sulphate Market held 38.2% share in 2025. The region continues to show strong demand driven by high consumer awareness of joint health, widespread supplement usage, and a mature nutraceutical industry. The United States remains the primary contributor, supported by a strong preference for transparent sourcing and quality-focused formulations.
Key companies active in the Global Chondroitin Sulphate Market include Wanbury Limited, TSI Group Ltd., ZPD A/S, Sierra Ingredients Pty Ltd., Synutra Ingredients (Shandong) Co., Ltd., Pacific Rainbow International, Inc., Guangdong Hybribio Biotech Co., Ltd., Yantai Dongcheng Pharmaceutical Group Co., Ltd., Shandong Runxin Biotechnology Co., Ltd., Jiaxing Hengjie Biopharmaceutical Co., Ltd., BGM Pharmaceuticals Co., Ltd., Qufu Liyang Biochem Industrial Co., Ltd., YBCC (Qingdao) Co., Ltd., and Anhui Jintung Fine Chemical Corporation Ltd. Companies operating in the Global Chondroitin Sulphate Market are focusing on quality enhancement, supply chain transparency, and product differentiation to strengthen their market position. Manufacturers are investing in advanced processing technologies to improve purity, consistency, and sustainability while meeting evolving regulatory standards. Strategic partnerships with supplement brands and distributors are expanding global reach and application diversity. Firms are also prioritizing clean-label positioning and traceability to align with consumer demand for ethically sourced ingredients.
Table of Contents
Chapter 1 Methodology & Scope
1.1 Market scope and definition
1.2 Research design
1.2.1 Research approach
1.2.2 Data collection methods
1.3 Data mining sources
1.3.1 Global
1.3.2 Regional/Country
1.4 Base estimates and calculations
1.4.1 Base year calculation
1.4.2 Key trends for market estimation
1.5 Primary research and validation
1.5.1 Primary sources
1.6 Forecast model
1.7 Research assumptions and limitations
Chapter 2 Executive Summary
2.1 Industry 3600 synopsis
2.2 Key market trends
2.2.1 Regional
2.2.2 Source
2.2.3 Form
2.2.4 Application
2.2.5 Distribution Channel
2.3 TAM Analysis, 2025-2034
2.4 CXO perspectives: Strategic imperatives
2.4.1 Executive decision points
2.4.2 Critical success factors
2.5 Future Outlook and Strategic Recommendations
Chapter 3 Industry Insights
3.1 Industry ecosystem analysis
3.1.1 Supplier landscape
3.1.2 Profit margin
3.1.3 Value addition at each stage
3.1.4 Factor affecting the value chain
3.1.5 Disruptions
3.2 Industry impact forces
3.2.1 Growth drivers
3.2.2 Industry pitfalls and challenges
3.2.3 Market opportunities
3.3 Growth potential analysis
3.4 Regulatory landscape
3.4.1 North America
3.4.2 Europe
3.4.3 Asia Pacific
3.4.4 Latin America
3.4.5 Middle East & Africa
3.5 Porter's analysis
3.6 PESTEL analysis
3.7 Price trends
3.8 Future market trends
3.9 Technology and Innovation landscape
3.9.1 Current technological trends
3.9.2 Emerging technologies
3.10 Patent Landscape
3.11 Trade statistics (HS code) ( Note: the trade statistics will be provided for key countries only)
3.11.1 Major importing countries
3.11.2 Major exporting countries
Chapter 4 Competitive Landscape, 2025
4.1 Introduction
4.2 Company market share analysis
4.2.1 By region
4.2.1.1 North America
4.2.1.2 Europe
4.2.1.3 Asia Pacific
4.2.1.4 LATAM
4.2.1.5 MEA
4.3 Company matrix analysis
4.4 Competitive analysis of major market players
4.5 Competitive positioning matrix
4.6 Key developments
4.6.1 Mergers & acquisitions
4.6.2 Partnerships & collaborations
4.6.3 New Product Launches
4.6.4 Expansion Plans
Chapter 5 Market Estimates and Forecast, By Source, 2022-2035 (USD Million & Tons)
5.1 Key trends
5.2 Bovine
5.3 Porcine
5.4 Avian
5.4.1 Chicken
5.4.2 Turkey
5.4.3 Others
5.5 Marine
5.5.1 Tuna
5.5.2 Salmon
5.5.3 Others
5.6 Others
Chapter 6 Market Estimates and Forecast, By Form, 2022-2035 (USD Million & Tons)
6.1 Key trends
6.2 Powder
6.3 Capsule/Tablets
6.4 Liquid
Chapter 7 Market Estimates and Forecast, By Application, 2022-2035 (USD Million & Tons)
7.1 Key trends
7.2 Dietary Supplements
7.2.1 Capsules
7.2.2 Tablets
7.2.3 Gummies
7.3 Pharmaceuticals
7.3.1 Osteoarthritis treatment drugs
7.3.2 Joint health formulations
7.4 Cosmetic and Personal Care
7.4.1 Anti-aging creams
7.4.2 Skin hydration products
7.5 Food and Beverages
7.6 Others
Chapter 8 Market Estimates and Forecast, By Distribution Channel, 2022-2035 (USD Million & Tons)
8.1 Key trends
8.2 Direct Sales
8.3 Distributors
8.4 Online Retail
8.5 Pharmacies
Chapter 9 Market Estimates and Forecast, By Region, 2022-2035 (USD Million & Tons)
9.1 Key trends
9.2 North America
9.2.1 U.S.
9.2.2 Canada
9.3 Europe
9.3.1 Germany
9.3.2 UK
9.3.3 France
9.3.4 Spain
9.3.5 Italy
9.3.6 Rest of Europe
9.4 Asia Pacific
9.4.1 China
9.4.2 India
9.4.3 Japan
9.4.4 Australia
9.4.5 South Korea
9.4.6 Rest of Asia Pacific
9.5 Latin America
9.5.1 Brazil
9.5.2 Mexico
9.5.3 Argentina
9.5.4 Rest of Latin America
9.6 Middle East and Africa
9.6.1 Saudi Arabia
9.6.2 South Africa
9.6.3 UAE
9.6.4 Rest of Middle East and Africa
Chapter 10 Company Profiles
10.1 TSI Group Ltd.
10.2 Synutra Ingredients (Shandong) Co., Ltd.
10.3 Yantai Dongcheng Pharmaceutical Group Co., Ltd.
10.4 Jiaxing Hengjie Biopharmaceutical Co., Ltd.
10.5 Qufu Liyang Biochem Industrial Co., Ltd.
10.6 Pacific Rainbow International, Inc.
10.7 Shandong Runxin Biotechnology Co., Ltd.
10.8 ZPD A/S
10.9 Guangdong Hybribio Biotech Co., Ltd.
10.10 Wanbury Limited
10.11 Sierra Ingredients Pty Ltd.
10.12 BGM Pharmaceuticals Co., Ltd.
10.13 YBCC (Qingdao) Co., Ltd.
10.14 Anhui Jintung Fine Chemical Corporation Ltd.