수요반응형 교통 시스템 시장 기회, 성장요인, 업계 동향 분석 및 예측(2025-2034년)
Demand-Responsive Transit Systems Market Opportunity, Growth Drivers, Industry Trend Analysis, and Forecast 2025 - 2034
상품코드:1892697
리서치사:Global Market Insights Inc.
발행일:2025년 12월
페이지 정보:영문 240 Pages
라이선스 & 가격 (부가세 별도)
ㅁ Add-on 가능: 고객의 요청에 따라 일정한 범위 내에서 Customization이 가능합니다. 자세한 사항은 문의해 주시기 바랍니다.
한글목차
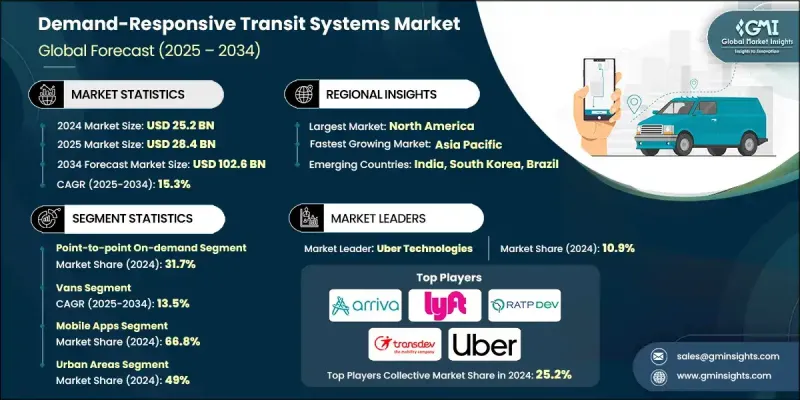
세계의 수요반응형 교통 시스템 시장은 2024년에 252억 달러로 평가되었고, 2034년까지 연평균 복합 성장률(CAGR) 15.3%로 성장하여 1,026억 달러에 이를 것으로 예측됩니다.
수요반응형 교통 시스템은 지역이 변동하는 승객 수에 대응하고 대중교통이 미비한 지역의 공백을 메우는 유연한 모빌리티 서비스를 도입함에 따라 지속적으로 확대되고 있습니다. 정부 기관이 동적 교통 모델의 효율성 향상을 인식함에 따라 정부의 참여가 더욱 강화되고 있습니다. 운영 평가에서 자원 활용과 이동 관리의 개선이 지속적으로 입증되고 있습니다. 실시간 배차 도구, 모바일 예약 플랫폼, 지능형 경로 설정 소프트웨어 등 첨단 기술 도입이 시장 성장의 핵심입니다. 이를 통해 사업자는 카풀 이동을 보다 효과적으로 관리하고 불필요한 주행거리를 줄일 수 있습니다. 이러한 시스템은 차량 증차 없이도 신뢰성을 높이고, 도시와 지방 모두에서 효율적이고 확장 가능한 서비스 모델을 창출할 수 있습니다. 디지털 통합이 교통 생태계를 재구성하는 가운데, 수요반응형 네트워크는 여러 지역에 걸친 현대적 교통 계획의 중요한 구성요소가 되고 있습니다.
시장 범위
개시 연도
2024년
예측 연도
2025-2034년
개시 연도 시장 규모
252억 달러
예측 금액
1,026억 달러
CAGR
15.3%
2024년 기준, 포인트 투 포인트 온디맨드 부문은 31.7%의 점유율을 차지했습니다. 이 부문이 선두를 달리고 있는 배경에는 승객들이 대기 시간을 최소화하고 맞춤형 경로를 제공하는 유연하고 직행적인 이동 솔루션을 점점 더 중요하게 여기고 있기 때문입니다. 서비스 제공업체는 차량 가동률 향상과 운영비 절감을 통해 이익을 얻고 있으며, 이를 통해 보다 지속 가능한 서비스 모델을 구축할 수 있게 되었습니다.
2024년에는 밴 부문이 시장을 장악하고 2025년부터 2034년까지 13.5%의 연평균 복합 성장률(CAGR)을 보일 것으로 예측됩니다. 밴은 적응성, 적절한 승객 수용력, 저렴한 가격으로 인해 여전히 선호되는 차량 유형입니다. 좁은 도로와 중간 정도 수요를 가진 노선을 모두 운행할 수 있는 능력은 노선 수요와 최적화된 비용 구조를 일치시키고자 하는 사업자에게 인기가 있습니다. 더 많은 승객 관리가 필요한 지역에서는 컷어웨이 버스가 밴 기반의 배치를 계속 보완하고 있습니다.
미국 수요반응형 교통 시스템 시장은 2024년 80.7%의 점유율을 차지하며 73억 달러 규모에 달했습니다. 수요반응형 교통은 경제적인 이동수단을 제공하고 교통의 형평성을 높이기 위해 지방이나 인구밀도가 낮은 지역에서 보급이 확산되고 있습니다. 여러 분석에서 고정 노선 서비스를 동적 시스템으로 대체함으로써 1회당 운행 비용이 크게 절감되고 승객 수가 눈에 띄게 증가하여 유연한 모델의 운영상의 이점을 입증했습니다.
목차
제1장 조사 방법
시장 범위와 정의
조사 설계
조사 접근
데이터 수집 방법
데이터 마이닝 소스
세계
지역별/국가별
기본 추정치와 계산
기준연도 계산
시장 추정 주요 동향
1차 조사와 검증
1차 정보
예측
조사의 전제조건과 제한 사항
제2장 주요 요약
제3장 업계 인사이트
생태계 분석
공급업체 상황
이익률 분석
비용 구조
각 단계별 부가가치
밸류체인에 영향을 미치는 요인
파괴적 변화
업계에 대한 영향요인
성장 촉진요인
업계의 잠재적 리스크&과제
시장 기회
성장 가능성 분석
규제 상황
북미
유럽
아시아태평양
라틴아메리카
중동 및 아프리카
Porter's Five Forces 분석
PESTEL 분석
기술과 혁신 동향
현재 기술 동향
신기술
가격 분석
서비스로서의 소프트웨어(SaaS) 가격 결정 모델
승차별 요금 체계
턴키 솔루션 가격 결정
총 소유비용 분석
비용 내역 분석
특허 및 지적재산 분석
동적 경로 탐색 알고리즘 특허
수요 예측 및 매칭 기술에 관한 특허
접근성 기술에 관한 특허
지속가능성과 환경면
지속가능한 실천
폐기물 감축 전략
생산 에너지 효율
친환경 이니셔티브
탄소발자국에 관한 고려사항
이용 사례
최선 시나리오
투자 및 자금조달 분석
벤처캐피털 및 사모펀드 투자
정부 보조금 및 보조금(FTA 제5310조, 제5311조)
민관 제휴 모델
이용자 도입 장벽과 정보격차 평가
기술 리터러시와 인구통계학적 과제
스마트폰 보급률과 단말기 접근성
멀티채널 예약 요건(앱, 웹, IVR, SMS, 콜센터)
언어 및 문화적인 장벽
신뢰성과 프라이버시에 관한 우려 사항
종합적 서비스 설계를 위한 전략
서비스 모델별 운영비용 구조와 경제성
파라트랜짓 운행당 비용 분석
마이크로트랜짓 승객 마일당 비용
고정 노선형과 온디맨드형 비용 비교
인건비 내역(운전기사, 배차 담당, 콜센터)
기술 및 소프트웨어 라이선싱 비용
차량 취득 및 유지관리 비용
연료 및 에너지 비용(내연기관차 vs .전기자동차)
관리비 및 간접비 배분
보조금 요건과 운임 수입 회수율
제4장 경쟁 구도
서론
기업의 시장 점유율 분석
북미
유럽
아시아태평양
라틴아메리카
중동 및 아프리카
주요 시장 기업의 경쟁 분석
경쟁 포지셔닝 매트릭스
전략적 전망 매트릭스
주요 발전
인수합병(M&A)
제휴 및 협업
신제품 발매
사업 확대 계획과 자금조달
제5장 시장 추산 및 예측 : 서비스별, 2021-2034
주요 동향
Paratransit
Microtransit
Dial-a-Ride
Route Deviation Services
Point-to-Point On-Demand
Subscription-Based Services
기타
제6장 시장 추산 및 예측 : 차량별, 2021-2034
주요 동향
밴
컷어웨이 버스
미니 버스
세단 및 승용차
전기자동차(EV)
자율주행차(AV)
제7장 시장 추산 및 예측 : 기술별, 2021-2034
주요 동향
기존 예약 시스템
모바일 앱
기타
제8장 시장 추산 및 예측 : 용도별, 2021-2034
주요 동향
도시
지방
법인
공공 부문
기타
제9장 시장 추산 및 예측 : 지역별, 2021-2034
주요 동향
북미
미국
캐나다
유럽
독일
영국
프랑스
이탈리아
스페인
북유럽 국가
러시아
아시아태평양
중국
인도
일본
호주
한국
싱가포르
말레이시아
태국
라틴아메리카
브라질
멕시코
아르헨티나
중동 및 아프리카
남아프리카공화국
사우디아라비아
아랍에미리트(UAE)
제10장 기업 개요
세계 기업
Ecolane
Lyft
Masabi
Moovit
Optibus
Spare Labs
TransLoc
Trapeze
Uber Technologies
Via Transportation
지역 기업
Arriva
Go-Ahead
Keolis
Padam Mobility
RATP Dev
Transdev
신흥·니치 기업
Clever Devices
Remix
Routematch
TripSpark Technologies
LSH
영문 목차
영문목차
The Global Demand-Responsive Transit Systems Market was valued at USD 25.2 billion in 2024 and is estimated to grow at a CAGR of 15.3% to reach USD 102.6 billion by 2034.
Demand-responsive transit is expanding as regions adopt flexible mobility services capable of adapting to varying passenger volumes and filling gaps where public transportation remains limited. Government involvement continues to strengthen as agencies recognize the efficiency gains of dynamic transportation models, with operational assessments consistently demonstrating improvements in resource use and trip management. The adoption of advanced technology is now central to market growth, as real-time dispatching tools, mobile booking platforms, and intelligent routing software allow operators to manage pooled trips more effectively and reduce unnecessary miles traveled. These systems also increase reliability without requiring fleets to expand, creating a more efficient and scalable service model for both urban and rural applications. As digital integration reshapes the transit ecosystem, demand-responsive networks are becoming a critical component in modern transportation planning across multiple regions.
Market Scope
Start Year
2024
Forecast Year
2025-2034
Start Value
$25.2 Billion
Forecast Value
$102.6 Billion
CAGR
15.3%
The point-to-point on-demand segment held a 31.7% share in 2024. This segment leads because passengers increasingly value flexible, direct travel solutions that minimize wait times and provide tailored routing. Service providers benefit through higher vehicle utilization and lower operating costs, which support more sustainable service models.
The vans segment dominated in 2024 and is forecast to grow at 13.5% CAGR from 2025 to 2034. Vans remain the preferred vehicle type due to their adaptability, suitable passenger capacity, and affordability. Their ability to navigate both narrow roads and moderate-demand corridors makes them popular for operators looking to match route needs with optimized cost structures. In areas requiring greater passenger volume management, cutaway buses continue to complement van-based deployments.
US Demand-Responsive Transit Systems Market accounted for 80.7% share and generated USD 7.3 billion in 2024. Demand-responsive transit has gained traction across rural and lower-density regions, where it provides an economical mobility solution and enhances transportation equity. In multiple analyses, replacing fixed-route services with dynamic systems has demonstrated significant reductions in per-trip costs and notable increases in ridership, reinforcing the operational advantages of flexible models.
Major companies in the Demand-Responsive Transit Systems Market include Arriva, Go-Ahead, Keolis, Lyft, Moovit, Padam Mobility, RATP Dev, Transdev, Uber Technologies, and Via Transportation. Companies in the Demand-Responsive Transit Systems Market are strengthening their market position by expanding digital platforms, enhancing real-time routing algorithms, and investing in integrated mobility solutions that connect multiple transportation modes. Many organizations are partnering with municipalities and transit agencies to deploy turnkey systems that streamline booking, dispatch, and fleet coordination. Strategic emphasis is placed on lowering operational costs through advanced data analytics, which improves load balancing and reduces unnecessary mileage. Firms are also creating modular service models tailored to suburban, urban, and rural environments to broaden their customer base.
Table of Contents
Chapter 1 Methodology
1.1 Market scope and definition
1.2 Research design
1.2.1 Research approach
1.2.2 Data collection methods
1.3 Data mining sources
1.3.1 Global
1.3.2 Regional/Country
1.4 Base estimates and calculations
1.4.1 Base year calculation
1.4.2 Key trends for market estimation
1.5 Primary research and validation
1.5.1 Primary sources
1.6 Forecast
1.7 Research assumptions and limitations
Chapter 2 Executive Summary
2.1 Industry 360° synopsis, 2021 - 2034
2.2 Key market trends
2.2.1 Regional
2.2.2 Service
2.2.3 Vehicle
2.2.4 Technology
2.2.5 Application
2.3 TAM Analysis, 2025-2034
2.4 CXO perspectives: Strategic imperatives
2.4.1 Executive decision points
2.4.2 Critical success factors
2.5 Future outlook and strategic recommendations
Chapter 3 Industry Insights
3.1 Industry ecosystem analysis
3.1.1 Supplier landscape
3.1.2 Profit margin analysis
3.1.3 Cost structure
3.1.4 Value addition at each stage
3.1.5 Factor affecting the value chain
3.1.6 Disruptions
3.2 Industry impact forces
3.2.1 Growth drivers
3.2.1.1 Growing urbanization and micro-mobility demand
3.2.1.2 Advances in real-time routing, dynamic dispatch & mobile apps
3.2.1.3 Policy push towards reducing congestion & emissions
3.2.1.4 Rising demand for paratransit and first/last-mile solutions
3.2.2 Industry pitfalls and challenges
3.2.2.1 Variable regulatory frameworks across cities
3.2.2.2 Public transit incumbents’ resistance & funding limits
3.2.3 Market opportunities
3.2.3.1 Integration with MaaS platforms and transit agencies
3.2.3.2 Electrification and micro-transit (EV shuttles, e-bikes/scooters)
3.3 Growth potential analysis
3.4 Regulatory landscape
3.4.1 North America
3.4.2 Europe
3.4.3 Asia Pacific
3.4.4 Latin America
3.4.5 Middle East & Africa
3.5 Porter's analysis
3.6 Pestel analysis
3.7 Technology and innovation landscape
3.7.1 Current technological trends
3.7.2 Emerging technologies
3.8 Pricing analysis
3.8.1 Software-as-a-service (SaaS) pricing models
3.8.2 Per-trip and per-ride pricing structures
3.8.3 Turnkey solution pricing
3.8.4 Total cost of ownership analysis
3.9 Cost breakdown analysis
3.10 Patent & intellectual property analysis
3.10.1 Dynamic routing algorithm patents
3.10.2 Demand prediction and matching technology patents
3.10.3 Accessibility technology patents
3.11 Sustainability and environmental aspects
3.11.1 Sustainable practices
3.11.2 Waste reduction strategies
3.11.3 Energy efficiency in production
3.11.4 Eco-friendly Initiatives
3.11.5 Carbon footprint considerations
3.12 Use cases
3.13 Best-case scenario
3.14 Investment & funding analysis
3.14.1 Venture capital and private equity investments
3.14.2 Government grants and subsidies (FTA section 5310, 5311)
3.14.3 Public-private partnership models
3.15 User adoption barriers & digital divide assessment
3.15.1 Technology literacy and demographic challenges
3.15.2 Smartphone penetration and device accessibility