


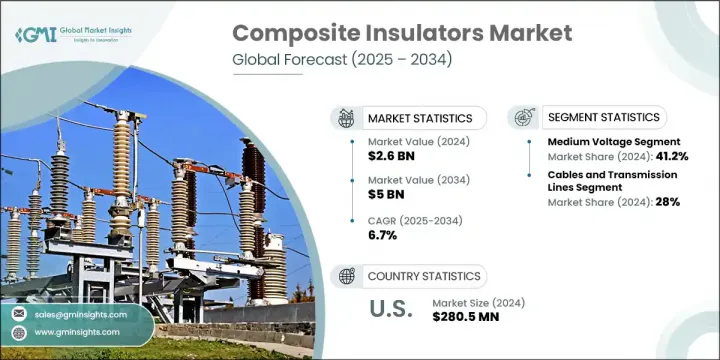
세계의 복합 절연체 시장 규모는 2024년에는 26억 달러로 평가되었고, CAGR 6.7%를 나타내 2034년에는 50억 달러에 이를 것으로 예측됩니다.
고전압 절연 요구의 확대, 재료 기술 혁신의 진보, 송전망의 신뢰성과 에너지 효율에 대한 주목의 고조가 시장 성장의 원동력이 되고 있습니다. 업계 각사는 열안정성 향상, 수명 연장, 극한 환경에 대한 내성을 갖춘 절연체를 개발하기 위해 많은 연구개발 투자를 실시했습니다. 풍력이나 태양광 등의 분산형 에너지 기술의 통합이 가속되고 있는 것에 더해, 스마트 그리드 기반의 고도화가 진행되고 있는 것도, 새로운 시장 기회를 계속 만들어 가고 있습니다. 복합 사다리는 낮은 유지 보수와 장기적인 운영 신뢰성으로 인해 오염 수준이 높고 기계적 부하가 매우 높은 지역에서 점점 더 선호되고 있습니다.
노후화된 송전망을 근대화하고 전력 인프라의 갭을 메우기 위한 정부의 지원책도 이 업계를 전진시키고 있습니다. 특히 신흥경제국에서는 송전망 확대와 장거리 송전 개발이 시장의 잠재력을 강화하고 있습니다. 중동 및 아프리카와 같은 지역에서는 전력 계통 업그레이드, 새로운 플랜트 건설 및 인프라 투자가 높은 수요를 자극하고 있습니다. 이 절연체는 까다로운 날씨에서 효율적인 운영과 고급 및 지속 가능한 에너지 네트워크를 지원하는 능력으로 받아 들여집니다.
| 시장 범위 | |
|---|---|
| 시작 연도 | 2024년 |
| 예측 연도 | 2025-2034년 |
| 시작 금액 | 26억 달러 |
| 예측 금액 | 50억 달러 |
| CAGR | 6.7% |
중전압 부문은 2024년에 41.2%의 최대 시장 점유율을 차지했고, 2034년까지의 CAGR은 6%를 나타낼 것으로 예측됩니다. 이 부문의 성장을 뒷받침하는 것은 지역 상호 연결에서의 역할 증가와 도시와 원격 지역에 신뢰할 수있는 에너지를 공급하는 중요한 요구입니다. 제조업체는 중전압 절연체의 기계적 강도와 전기적 신뢰성을 높이고 다양한 설치 환경에서 내구성과 기능성을 최적화합니다.
케이블 및 송전선 부문은 2024년에 28%의 점유율을 차지했고 2034년까지 연평균 복합 성장률(CAGR) 5.5%를 나타낼 것으로 예측됩니다. 안정적이고 효율적인 에너지 전송 시스템의 개발은 지속적인 송전망의 확장과 함께 이 분야의 복합 절연체 수요를 강화하고 있습니다. 이러한 장치는 누전 전류 감소, 절연 특성 강화, 부하 응력 하에서의 동작 개선 등 기존 옵션보다 우수한 이점을 제공합니다. 또한 원격지로의 접근이나 서비스가 충분하지 않은 지역을 대상으로 하는 전기 이니셔티브도 새로운 송전 경로에서의 채용을 강화하고 있습니다.
2024년 미국의 복합 절연체 시장은 72%의 점유율을 차지해 2억 8,050만 달러를 창출했습니다. 이 지역의 성장은 송전망의 현대화와 신재생에너지 통합에 대한 대규모 투자에 의해 형성됩니다. 관민의 이해관계자는 신재생에너지원에 대응하면서 일관된 에너지공급을 확보하는 것을 목표로 하여 국가의 인프라를 갱신하기 위한 자본배분을 늘리고 있습니다.
세계의 복합 절연체 시장을 견인하는 주요 기업으로는 Siemens Energy, PFISTERER, Habel, Hitachi Energy, TE Connectivity 등이 있습니다. 선도적인 제조업체는 시장에서의 지위를 높이기 위해 다방면 접근법을 시행하고 있습니다. 뛰어난 내후성과 긴 수명을 제공하는 첨단 경량 복합재료를 개발하기 위해 연구 개발에 주력하고 있습니다. 많은 개발 기업들은 전력 회사와 전략적 제휴를 맺고 특정 그리드 과제를 위해 맞춤형 절연체 솔루션을 공동 개발하고 있습니다. 게다가 아프리카나 동남아시아 등 급속히 개발이 진행되고 있는 지역으로의 세계 전개도 고객 기반의 확대에 도움이 되고 있습니다.
The Global Composite Insulators Market was valued at USD 2.6 billion in 2024 and is estimated to grow at a CAGR of 6.7% to reach USD 5 billion by 2034. The expanding need for high-voltage insulation, advances in material innovation, and rising attention to grid reliability and energy efficiency are fueling market growth. Industry players are making significant R&D investments to develop insulators that provide improved thermal stability, longer service life, and resistance to environmental extremes. The accelerating integration of distributed energy technologies, such as wind and solar, alongside the advancement of smart grid infrastructures, continues to generate new market opportunities. Composite insulators are increasingly favored in areas with high pollution levels and extreme mechanical loads due to their low maintenance and operational reliability over long periods.

Government-backed initiatives to modernize aging grids and bridge power infrastructure gaps are also pushing the industry forward. Grid expansion and long-distance transmission development, especially in emerging economies, are reinforcing market potential. In regions like the Middle East and Africa, power system upgrades, new plant constructions, and infrastructure investments are stimulating high demand. These insulators are being embraced for their efficient operation in harsh weather and their ability to support advanced, sustainable energy networks.
| Market Scope | |
|---|---|
| Start Year | 2024 |
| Forecast Year | 2025-2034 |
| Start Value | $2.6 Billion |
| Forecast Value | $5 Billion |
| CAGR | 6.7% |
The medium voltage segment held the largest market share of 41.2% in 2024 and is forecast to grow at a CAGR of 6% through 2034. The segment's growth is supported by its increasing role in regional interconnectivity and the critical need to deliver dependable energy across urban and remote regions. Manufacturers are enhancing the mechanical strength and electrical reliability of medium voltage insulators to optimize their durability and functionality across various installation environments.
The cables and transmission lines segment accounted for a 28% share in 2024 and is projected to grow at a CAGR of 5.5% through 2034. The drive to develop stable and efficient energy transmission systems, paired with continuous grid expansions, is reinforcing the demand for composite insulators in this segment. These units offer superior benefits over traditional options, including lower current leakage, enhanced insulation properties, and better operational outcomes under load stress. Electrification initiatives targeting remote access and underserved areas are also strengthening adoption across new transmission corridors.
United States Composite Insulators Market held a 72% share in 2024, generating USD 280.5 million. Growth in this region is being shaped by significant investments in grid modernization and renewable integration. Public and private stakeholders are increasingly allocating capital to update the nation's infrastructure, aiming to ensure consistent energy delivery while accommodating renewable energy sources.
Major companies driving the Global Composite Insulators Market include Siemens Energy, PFISTERER, Hubbell, Hitachi Energy, and TE Connectivity, among others. Leading manufacturers are implementing a multi-pronged approach to boost their market position. They are focusing heavily on R&D to develop advanced, lightweight composite materials that offer superior weather resistance and long operational life. Many players are entering strategic collaborations with utility companies to co-develop customized insulator solutions for specific grid challenges. Additionally, global expansion into fast-developing regions like Africa and Southeast Asia helps broaden their customer base.