


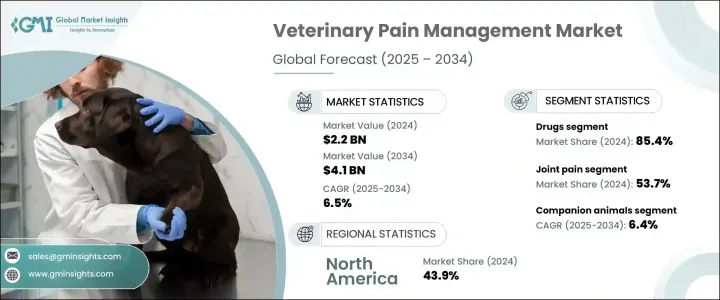
세계의 동물용 통증 관리 시장은 2024년 22억 달러로 평가되었으며, 2025-2034년 연평균 복합 성장률(CAGR) 6.5%로 확대될 것으로 예측됩니다.
시장 성장의 원동력이 되고 있는 것은 반려동물 사육 증가, 동물 헬스케어에 대한 의식 고조, 반려동물 인간화 동향의 고조입니다. 관절염, 암, 관절통 등의 만성 질환의 유행에 의해 효과적인 통증 관리 솔루션 수요가 높아지고 있습니다. 게다가 수의 외과 수술의 건수는 증가 일로를 걷고 있어, 동통 관리약 및 기기의 필요성을 한층 더 높이고 있습니다. 가축의 건강 또한 축산물 소비량의 증가로 인해 중요한 초점이 되고 있습니다. 생산성을 유지하기 위해 가축 생산자는 동물의 건강을 확보하는 통증 관리 솔루션을 채택하고 있습니다. 동물 병원의 확대, 통증 관리약의 온라인 입수 증가, 원격 의료 역할의 증대가 시장 확대에 더욱 공헌하고 있습니다.
동물용 통증 관리에는 동물의 급성 및 만성 통증을 완화하는 데 사용되는 약물과 장비가 포함되어 있습니다. 시장 규모는 2021년 19억 달러, 2022년 20억 달러, 2023년 21억 달러로 평가되었습니다. 제품별로는 약제 부문이 2024년 전체 시장점유율의 85.4%를 차지했습니다. 또한 유형별, 투여 경로별, 유통 채널별로 분류됩니다. 유형별로는 NSAIDs, 오피오이드, 마취제, α2 작동제가 포함됩니다.
| 시장 범위 | |
|---|---|
| 시작 연도 | 2024년 |
| 예측 연도 | 2025-2034년 |
| 시작 금액 | 22억 달러 |
| 예측 금액 | 41억 달러 |
| CAGR | 6.5% |
투여 경로는 경구제, 비경구제, 국소제로 나뉘며 유통 채널에는 동물병원 약국, 소매 약국, 온라인 약국이 포함됩니다. 이 시장에서 약제의 우위성은, 입수가 용이한 것과 동통 및 염증 관리에 유효한 것에 기인합니다. 비스테로이드성 항염증제(NSAIDs)와 오피오이드는 그 유효성이 확립되어 있기 때문에 널리 사용되고 있습니다. 통증 관리제의 수요는 퇴행성관절염, 관절장애, 암 등 만성질환 유병률 증가로 지속적으로 증가하고 있습니다. 약제 제제의 진보로 유효성이 향상되고 투여 횟수가 줄어 기호성이 높아졌기 때문에 보다 널리 받아들여지게 되었습니다.
동물용 통증 관리 시장은 용도별로 세분화되어 있으며, 2024년에는 관절통이 53.7%의 최대 점유율을 차지했습니다. 이 분야는 2024년에 12억 달러로 평가되었으며, 2034년에는 CAGR 6.3%로 21억 달러에 이를 것으로 예측되고 있습니다. 관절통에는 변형성 관절증 및 근골격계 장애 등의 질환이 포함됩니다. 항염증제 및 질환 수식성 변형성 관절증 치료제 등의 선진 치료를 이용할 수 있게 된 것이 이 분야의 확대에 기여하고 있습니다.
동물 유형에 따라 시장은 반려동물 및 축산 동물로 분류됩니다. 반려동물 세분화는 2024년 시장을 선도하였고, 예측 기간 CAGR 6.4%로 성장할 것으로 예측됩니다. 이 카테고리에는 개, 고양이, 말, 기타 도우미 동물이 포함됩니다. 반려동물 사육이 늘고 수명이 늘어나면서 동물용 통증 관리 솔루션의 수요가 높아지고 있습니다. 반려동물은 고령화됨에 따라 만성질환에 걸리기 쉬워져 효과적인 진통대책이 필요합니다. 반려동물 보험의 보급과 수의학적 지출의 증가가 이 분야의 확대를 더욱 뒷받침하고 있습니다.
북미는 2024년 세계의 동물용 통증 관리 시장에서 43.9%의 점유율을 차지했습니다. 잘 정비된 동물 의료 인프라, 높은 반려동물 사육율, 풍부한 가축 마릿수가 이 지역 시장 개척에 공헌하고 있습니다. 2021년 7억 8,550만 달러였던 미국 시장은 2022년 8억 1,750만 달러, 2023년 8억 5,360만 달러로 성장하였으며, 시장 성장의 주요 기여국으로서의 입지를 더욱 굳혔습니다.
The Global Veterinary Pain Management Market was valued at USD 2.2 billion in 2024 and is projected to expand at a 6.5% CAGR from 2025 to 2034. The market growth is driven by increasing pet ownership, rising awareness of animal healthcare, and the growing trend of pet humanization. The prevalence of chronic diseases such as arthritis, cancer, and joint pain has heightened the demand for effective pain management solutions. Additionally, the number of veterinary surgical procedures continues to rise, further boosting the need for pain management drugs and devices. Livestock health has also become a critical focus due to the rising consumption of animal-based products. To maintain productivity, livestock producers are adopting pain management solutions to ensure animal well-being. The expansion of veterinary hospitals, increasing online availability of pain management drugs, and the growing role of telemedicine have further contributed to market expansion.

Veterinary pain management includes drugs and devices used to relieve acute and chronic pain in animals. In 2021, the market was valued at USD 1.9 billion, followed by USD 2 billion in 2022 and USD 2.1 billion in 2023. In terms of products, the drugs segment accounted for 85.4% of the total market share in 2024. It is further categorized by type, route of administration, and distribution channel. By type, the segment includes NSAIDs, opioids, anesthetics, and alpha-2 agonists.
| Market Scope | |
|---|---|
| Start Year | 2024 |
| Forecast Year | 2025-2034 |
| Start Value | $2.2 Billion |
| Forecast Value | $4.1 Billion |
| CAGR | 6.5% |
The route of administration is divided into oral, parenteral, and topical, while the distribution channel includes veterinary hospital pharmacies, retail pharmacies, and online pharmacies. The dominance of drugs in the market is attributed to their easy availability and effectiveness in managing pain and inflammation. NSAIDs and opioids are widely used due to their well-established efficacy. The demand for pain management drugs continues to rise due to the increasing prevalence of chronic diseases such as osteoarthritis, joint disorders, and cancer. Advancements in drug formulations have improved efficacy, reduced dosage frequency, and enhanced palatability, making them more widely accepted.
The veterinary pain management market is also segmented by application, with joint pain holding the largest share of 53.7% in 2024. This segment was valued at USD 1.2 billion in 2024 and is projected to reach USD 2.1 billion by 2034 at a CAGR of 6.3%. Joint pain includes conditions such as osteoarthritis and musculoskeletal disorders. The availability of advanced treatments, including anti-inflammatory drugs and disease-modifying osteoarthritis drugs, has contributed to the expansion of this segment.
By animal type, the market is classified into companion animals and livestock animals. The companion animals segment led the market in 2024 and is expected to grow at a 6.4% CAGR during the forecast period. This category includes dogs, cats, horses, and other companion animals. The increasing adoption of pets and their longer lifespan have heightened the demand for veterinary pain management solutions. As pets age, they become more susceptible to chronic conditions, necessitating effective pain relief measures. The growth of pet insurance and rising veterinary expenditures have further supported the expansion of this segment.
North America dominated the global veterinary pain management market in 2024, holding a 43.9% share. The well-developed veterinary healthcare infrastructure, high pet adoption rates, and substantial livestock population contribute to the region's market strength. The U.S. market, which was valued at USD 785.5 million in 2021, grew to USD 817.5 million in 2022 and USD 853.6 million in 2023, further solidifying its position as the leading contributor to market growth.