


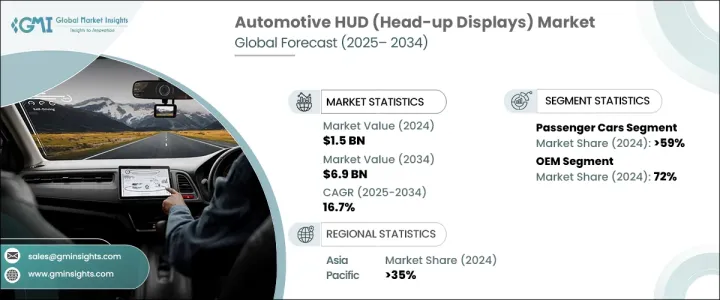
세계의 자동차용 HUD 시장은 2024년에 15억 달러에 이르렀으며, 2025-2034년 연평균 복합 성장률(CAGR) 16.7%로 성장할 것으로 예측됩니다.
전기자동차와 자율주행차에 대한 수요 증가가 이 시장 확대의 주요 요인이 되고 있습니다. 전기차에서는 HUD를 통해 운전자는 배터리 상태, 충전 수준, 추정 주행거리 등 중요한 세부 사항을 모니터할 수 있어 운전 경험을 향상시킬 수 있습니다. 자율 주행차에서 이러한 시스템은 내비게이션, 차량 상태, 자율 주행 수준을 표시하기 위해 필수적이며 승객과 차량 간의 원활한 상호 작용을 만들어냅니다. EV와 자율주행차가 대세로 자리잡으면서 HUD는 옵션 기능에서 안전성과 편의성을 위한 필수 컴포넌트로 옮겨가고 있습니다. 증강현실 및 홀로그래픽 디스플레이와 같은 선진 기술이 업계를 재구축하여 HUD를 보다 인터랙티브하고 사용하기 쉽게 만들고 있습니다. 증강현실 HUD는 내비게이션이나 실시간 도로 상황을 앞유리에 오버레이 표시함으로써 운전자의 주의 산만을 줄여줍니다. ADAS(첨단 운전자 보조 시스템)와의 통합은 디스플레이의 선명도를 높여 정확하고 실시간 정보 중계를 보장합니다.

이 시장은 차량 유형별로 승용차, 상용차, 오프 하이웨이차로 분류됩니다. 2024년 시장 점유율은 승용차가 59%를 차지했으며, 8억 5,000만 달러가 넘었습니다. 프리미엄 및 미드레인지 승용차는 안전성과 운전 편의성을 높이기 위해 HUD를 탑재하도록 되어 있습니다. 이들 시스템은 속도, 내비게이션, 위험 경고에 대한 실시간 데이터를 제공해 운전자의 주의를 도로에서 돌리지 않고 계속 정보를 제공합니다. ADAS 채택이 증가함에 따라 HUD는 차선 유지 지원, 어댑티브 크루즈 컨트롤, 충돌 경고에 필수적인 요소가 되고 있습니다. ADAS 시장 자체는 2034년까지 2,122억 달러에 이를 것으로 예상되고 있으며, 운전자 보조 기술의 중요성이 커지고 있음을 부각시키고 있습니다.
| 시장 범위 | |
|---|---|
| 시작 연도 | 2024년 |
| 예측 연도 | 2025-2034년 |
| 시작 금액 | 15억 달러 |
| 예측 금액 | 69억 달러 |
| CAGR | 16.7% |
시장은 판매 채널별로 OEM과 애프터마켓으로 구분되며, 2024년 시장 점유율은 OEM이 72%로 압도적이었습니다. 자동차 제조사는 가격과 고객 수요에 따라 HUD를 표준 장비 또는 옵션 장비로 모델에 포함하고 있습니다. 많은 소비자들은 차량 내비게이션, 공조 제어, 엔터테인먼트 시스템과의 원활한 통합을 통해 제조사 순정 HUD를 선호합니다. 또한 OEM 장착 HUD는 보증과 장기 지원을 제공하여 구매자의 신뢰를 높이고 있습니다. 이들 시스템은 특정 차종용으로 만들어져 높은 호환성과 신뢰성이 확보돼 있어 애프터마켓 제품보다 선호되는 선택지가 되고 있습니다.
기술별로 보면 시장에는 기존 HUD, 증강현실 HUD, 홀로그래픽 HUD가 있으며, 2024년에는 증강현실 HUD가 이 분야를 선도했습니다. 이들 시스템은 내비게이션이나 경고 등 중요한 데이터를 앞유리에 직접 투영해 운전자가 도로에 집중할 수 있도록 합니다. 제조 비용 저하 및 기술의 진보에 의해, ARHUD는 보다 친숙한 것이 되어, 고급차 이외에의 보급도 진행되고 있습니다.
시장은 또한 디스플레이의 유형에 따라 프런트 글라스 HUD와 콤바이너 HUD로 나뉘어, 2024년에는 프런트 글래스 HUD가 리드했습니다. 이러한 시스템은 프런트 글래스에 직접 정보를 투영하기 위해, 모든 조명 조건하에서 선명한 시야를 확보할 수 있습니다. 레이저 투영이나 OLED 기술과 같은 혁신은 디스플레이의 선명도를 대폭 향상시켜 프런트 HUD를 선호하는 선택지로 만들고 있습니다.
아시아태평양은 35% 이상의 최대 점유율을 차지했으며, 중국은 2024년 1억 2,920만 달러로 지역 시장을 선도했습니다.
The Global Automotive HUD Market reached USD 1.5 billion in 2024 and is projected to grow at a CAGR of 16.7% from 2025 to 2034. Increasing demand for electric and autonomous vehicles is a major driver of this expansion. In electric vehicles, HUDs allow drivers to monitor essential details like battery status, charge levels, and estimated driving range, enhancing the driving experience. In autonomous vehicles, these systems are integral for displaying navigation, vehicle status, and autonomy levels, creating a seamless interaction between passengers and the vehicle. As EVs and autonomous vehicles become mainstream, HUDs are transitioning from optional features to essential components for safety and convenience. Advanced technologies like augmented reality and holographic displays are reshaping the industry, making HUDs more interactive and user-friendly. Augmented reality HUDs reduce driver distractions by overlaying navigation and real-time road conditions onto the windshield. Integration with advanced driver assistance systems (ADAS) enhances display clarity, ensuring accurate and real-time information relay.
The market is categorized based on vehicle type into passenger cars, commercial vehicles, and off-highway vehicles. In 2024, passenger cars held a 59% market share, valued at over USD 850 million. Premium and mid-range passenger vehicles are increasingly integrating HUDs to enhance safety and driving comfort. These systems provide real-time data on speed, navigation, and hazard warnings, keeping drivers informed without diverting their attention from the road. With the rise of ADAS adoption, HUDs are becoming essential for lane-keeping assistance, adaptive cruise control, and collision warnings. The ADAS market itself is expected to reach USD 212.2 billion by 2034, highlighting the growing significance of driver assistance technologies.
| Market Scope | |
|---|---|
| Start Year | 2024 |
| Forecast Year | 2025-2034 |
| Start Value | $1.5 Billion |
| Forecast Value | $6.9 Billion |
| CAGR | 16.7% |
The market is segmented by sales channel into OEM and aftermarket, with OEMs dominating at 72% market share in 2024. Automakers are incorporating HUDs as standard or optional features in their models, depending on price and customer demand. Many consumers prefer factory-installed HUDs due to their seamless integration with onboard navigation, climate control, and entertainment systems. OEM-installed HUDs also offer warranties and long-term support, increasing buyer confidence. These systems are built for specific vehicle models, ensuring high compatibility and reliability, which makes them a preferred choice over aftermarket alternatives.
By technology, the market includes conventional HUDs, augmented reality HUDs, and holographic HUDs, with augmented reality HUDs leading the segment in 2024. These systems project critical data, such as navigation and warnings, directly onto the windshield, allowing drivers to stay focused on the road. Lower manufacturing costs and technological advancements have made AR HUDs more accessible, extending their reach beyond luxury vehicles.
The market is further divided by display type into windshield HUDs and combiner HUDs, with windshield HUDs leading in 2024. These systems directly project information onto the windshield glass, ensuring clear visibility under all lighting conditions. Innovations like laser projection and OLED technology have significantly improved display clarity, making windshield HUDs the preferred option.
Asia Pacific holds the largest share of over 35%, with China leading the regional market at USD 129.2 million in 2024.