


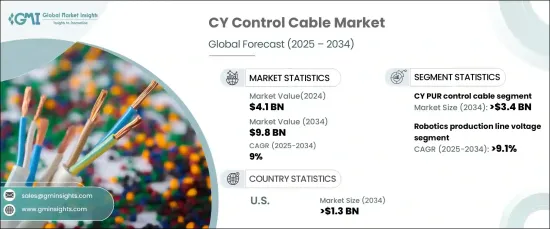
세계의 CY 제어 케이블 시장은 2024년 41억 달러로 평가되었으며, 2025년부터 2034년까지 연평균 성장률(CAGR) 9%로 성장할 것으로 예상됩니다.
이러한 성장은 산업 자동화, 제조 및 인프라 부문에서 이러한 케이블에 대한 수요 증가에 기인합니다. 유연성, 우수한 차폐 기능, 안정적인 신호 전송으로 잘 알려진 CY 제어 케이블은 정밀한 작동과 전자파 간섭(EMI) 감소에 필수적인 요소로 자리 잡았습니다.

스마트 제조 및 인더스트리 4.0을 비롯한 자동화 및 기술 발전에 대한 관심이 높아지면서 채택이 증가하고 있습니다. 이러한 케이블은 기계 간의 원활한 통신을 가능하게 하고 복잡한 시스템에서 효율성을 보장하는 데 매우 중요합니다. 또한, 특히 신흥 지역에서 지속적인 인프라 개발로 인해 HVAC 시스템, 엘리베이터 및 건물 관리 솔루션에 CY 케이블 설치가 가속화되고 있습니다. 안전과 안정적인 신호 전송을 강조하는 규제 프레임워크는 시장 수요를 더욱 촉진하고 있습니다.
| 시장 범위 | |
|---|---|
| 시작 연도 | 2024년 |
| 예측 연도 | 2025-2034년 |
| 시작 금액 | 41억 달러 |
| 예측 금액 | 98억 달러 |
| CAGR | 9% |
CY PUR 제어 케이블 부문은 스마트 팩토리 및 자동화 프로세스에서 중요한 역할을 수행함으로써 2034년까지 34억 달러 이상의 매출을 창출할 것으로 예상됩니다. 이 케이블은 EMI를 방지하는 차폐 특성 덕분에 자동화 기계 및 로봇 시스템에서 일관된 성능을 제공합니다. 장비 간 통신을 중단 없이 유지하는 정밀성과 효율성 덕분에 고성능과 운영 안정성을 중시하는 산업 환경에서 없어서는 안 될 필수품이 되었습니다.
용도별로는 로봇 생산 라인 전압 부문은 2034년까지 9.1% 이상의 연평균 성장률(CAGR)로 성장할 것으로 예상됩니다. 산업 전반에 걸쳐 자동화의 통합이 증가함에 따라 고전압을 지원하면서 EMI를 최소화하는 안정적인 제어 케이블에 대한 필요성이 증폭되었습니다. 이러한 케이블은 다양한 자동화 시스템으로의 제어 신호 전송을 용이하게 하여 최신 생산 라인의 효율성을 보장합니다. 이러한 수요 증가는 자동화의 발전으로 인해 내구성이 뛰어난 고성능 케이블링 솔루션이 필요해지면서 뒷받침되고 있습니다.
미국의 CY 제어 케이블 시장은 2034년까지 13억 달러를 넘어설 것으로 예상됩니다. 미국에서 자동화 기술과 인더스트리 4.0 원칙이 빠르게 채택되면서 고급 제어 케이블에 대한 수요가 증가하고 있습니다. 자동화가 생산성 향상의 초석이 되면서 이러한 케이블은 자동화 기계 및 로봇 공학에서 효율적인 통신 및 전력 전송을 보장하는 데 필수적인 요소가 되고 있습니다. 이러한 추세는 산업 전반에서 운영을 간소화하고 정밀도를 향상시키기 위해 자동화 시스템에 대한 의존도가 높아지고 있음을 반영합니다.
The Global CY Control Cable Market was valued at USD 4.1 billion in 2024 and is expected to grow at a CAGR of 9% between 2025 and 2034. The growth is attributed to the rising demand for these cables across industrial automation, manufacturing, and infrastructure sectors. Known for their flexibility, superior shielding capabilities, and reliable signal transmission, CY control cables have become essential for precise operations and reducing electromagnetic interference (EMI).
The increasing focus on automation and technological advancements, including smart manufacturing and Industry 4.0, is driving adoption. These cables are critical for enabling seamless communication between machines and ensuring efficiency in complex systems. Additionally, ongoing infrastructure development, particularly in emerging regions, is accelerating the installation of CY cables in HVAC systems, elevators, and building management solutions. Regulatory frameworks emphasizing safety and reliable signal transmission further boost market demand.
| Market Scope | |
|---|---|
| Start Year | 2024 |
| Forecast Year | 2025-2034 |
| Start Value | $4.1 Billion |
| Forecast Value | $9.8 Billion |
| CAGR | 9% |
The CY PUR control cable segment is predicted to generate revenues exceeding USD 3.4 billion by 2034, driven by its critical role in smart factories and automation processes. These cables deliver consistent performance in automated machinery and robotic systems thanks to their shielding properties that prevent EMI. Their precision and efficiency in maintaining uninterrupted communication between equipment have made them indispensable in industrial settings focused on high performance and operational reliability.
In terms of application, the robotics production line voltage segment is forecasted to grow at a CAGR of over 9.1% through 2034. The increasing integration of automation across industries has amplified the need for reliable control cables that support high voltages while minimizing EMI. These cables facilitate control signal transmission to various automated systems, ensuring efficiency in modern production lines. This rising demand is supported by advancements in automation, which necessitate durable and high-performance cabling solutions.
The United States CY control cable market is poised to surpass USD 1.3 billion by 2034. The rapid adoption of automation technologies and Industry 4.0 principles in the country is fueling the demand for advanced control cables. With automation being a cornerstone of productivity enhancement, these cables are becoming essential for ensuring efficient communication and power transmission in automated machinery and robotics. This trend reflects the growing reliance on automated systems to streamline operations and improve precision across industrial sectors.