Gas Station Equipment Market Opportunity, Growth Drivers, Industry Trend Analysis, and Forecast 2024 - 2032
상품코드:1665061
리서치사:Global Market Insights Inc.
발행일:2024년 12월
페이지 정보:영문 225 Pages
라이선스 & 가격 (부가세 별도)
ㅁ Add-on 가능: 고객의 요청에 따라 일정한 범위 내에서 Customization이 가능합니다. 자세한 사항은 문의해 주시기 바랍니다.
한글목차
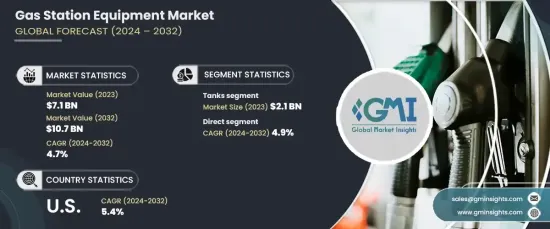
세계의 주유소 설비 시장은 2023년 71억 달러로 평가되었으며, 2024년부터 2032년까지 연평균 복합 성장률(CAGR) 4.7%로 확대되어 꾸준한 성장이 예상됩니다.
이 성장의 원동력이 되고 있는 것은 첨단 연료 공급 시스템과 에너지 효율이 높은 기술에 대한 수요 증가입니다. 이산화탄소 배출량 감소에 대한 관심이 높아짐에 따라 압축 천연가스(CNG), 수소, 전기자동차(EV) 충전소 등 대체 연료로의 이동이 현저해지고 있습니다. 이러한 전환은 주유소 운영자가 소비자의 선호도 변화에 대응하기 위해 최첨단 디스펜싱 장비, 혁신적인 저장 시스템 및 통합 소프트웨어 솔루션을 도입하여 인프라를 근대화해야 함을 강조합니다.
시장은 유형별로 탱크, 연료 디스펜서, 노즐, 펌프, 호스, 타이어 공기 공급, 편의점(C 스토어) 장비 및 기타 관련 제품으로 구분됩니다. 그중에서도 탱크가 최대의 점유율을 차지하고 2023년에는 21억 달러에 달했습니다. 예측 기간 중 CAGR은 4.6%로 예측됩니다. 탱크는 연료의 저장과 안전성 확보에 필수적이며 주유소 운영에 필수적입니다. 규제 준수를 보장하고 환경 위험을 최소화하는 능력은 시장에서 우위를 강화하고 있습니다.
시장 범위
시작 연도
2023년
예측 연도
2024-2032년
시작 금액
71억 달러
예측 금액
107억 달러
CAGR
4.7%
유통 채널의 관점에서 시장은 직접 부문와 간접 부문으로 나뉩니다. 2023년 시점에서는 직접 부문이 52.6%의 점유율을 차지해 시장을 선도했으며, 2032년까지의 CAGR은 4.9%로 예상되고 있습니다. 직접 판매 채널은 제조업체와 최종 사용자 간의 견고한 관계를 구축할 수 있기 때문에 선호됩니다. 이 접근법은 맞춤형 솔루션, 신속한 배송 및 더 나은 판매 후 서비스를 제공합니다. 또한 제조업체에 실시간 피드백을 제공하여 지속적인 개선과 고객 만족도를 향상시킬 수 있습니다.
미국 주유소 설비 시장은 2023년에 14억 달러를 창출했으며, 2032년까지 연평균 복합 성장률(CAGR)은 5.4%로 견조한 성장이 예상됩니다. 이 나라의 확립된 급유 인프라와 높은 자동차 보유율은 이 시장의 우위성에 기여하고 있습니다. 최첨단 연료 보급 기술에 대한 지속적인 투자와 EV 충전 네트워크의 확대는 이 나라 시장 성장을 더욱 밀어올릴 것으로 보입니다.
목차
제1장 조사 방법과 조사 범위
시장 범위와 정의
기본 추정과 계산
예측 파라미터
데이터 소스
1차 데이터
2차 데이터
유료 소스
공개 소스
제2장 주요 요약
제3장 업계 인사이트
생태계 분석
밸류체인에 영향을 주는 요인
이익률 분석
방해
향후 전망
제조업체
유통업체
공급자의 상황
이익률 분석
주요 뉴스와 대처
규제 상황
기술적 전망
영향요인
성장 촉진요인
대체 연료 및 EV 충전 인프라 채용 증가
연료 디스펜서 및 자동화 시스템의 기술적 진보
높은 에너지 효율과 친환경 장비에 대한 수요 증가
교통망의 확대와 도시화
업계의 잠재적 위험 및 과제
높은 초기 투자 및 유지 보수 비용
규제 준수와 환경에 대한 우려
성장 가능성 분석
Porter's Five Forces 분석
PESTEL 분석
제4장 경쟁 구도
서론
기업 점유율 분석
경쟁 포지셔닝 매트릭스
전략 전망 매트릭스
제5장 시장 추계·예측 : 유형별(2021-2032년), 10억 달러
주요 동향
탱크
연료 디스펜서
노즐
펌프
호스
타이어 공기주입기
C-Store 설비
기타(펌프 필터 등)
제6장 시장 추계·예측 : 연료 유형별(2021-2032년), 10억 달러
주요 동향
가솔린
디젤
바이오연료
압축천연가스(CNG)
액화천연가스(LNG)
수소연료
기타
제7장 시장 추계·예측 : 최종 용도별(2021-2032년), 10억 달러
주요 동향
소매 주유소
상업용 항공기
항공
해양
군사
제8장 시장 추계·예측 : 유통 채널별(2021-2032년), 10억 달러
주요 동향
직접 유통
간접 유통
제9장 시장 추계·예측 : 지역별(2021-2032년), 10억 달러
주요 동향
북미
미국
캐나다
유럽
영국
독일
프랑스
이탈리아
스페인
아시아태평양
중국
일본
인도
호주
라틴아메리카
브라질
멕시코
중동 및 아프리카
남아프리카
사우디아라비아
아랍에미리트(UAE)
제10장 기업 프로파일
Beijing Sanki Petroleum Technology
Bennett Pump Company
Censtar Science and Technology Corp. Ltd.
China Hongyang
Dover Corporation
Franklin Fueling Systems
Gilbarco Veeder-Root
Jiangsu Furen Group
Korea EnE Co. Ltd.
Peltek
Tatsuno Corporation
Tokheim Group
U-Fuel Corporate HongYang Group
VeriFone
Wayne Fueling Systems
KTH
영문 목차
영문목차
The Global Gas Station Equipment Market was valued at USD 7.1 billion in 2023 and is expected to experience steady growth, expanding at a CAGR of 4.7% from 2024 to 2032. This growth is being driven by the increasing demand for advanced fueling systems and energy-efficient technologies. As the focus on reducing carbon emissions intensifies, there has been a marked shift toward alternative fuels such as compressed natural gas (CNG), hydrogen, and electric vehicle (EV) charging stations. This transition is prompting gas station operators to modernize their infrastructure with cutting-edge dispensing equipment, innovative storage systems, and integrated software solutions to meet the changing preferences of consumers.
The market is segmented by type into tanks, fuel dispensers, nozzles, pumps, hoses, tire inflators, convenience store (C-store) equipment, and other related products. Among these, tanks hold the largest share, contributing USD 2.1 billion in 2023. They are projected to grow at a CAGR of 4.6% over the forecast period. Tanks are crucial for fuel storage and safety, making them an essential part of any gas station operation. Their ability to ensure compliance with regulations and minimize environmental risks reinforces their dominance in the market.
Market Scope
Start Year
2023
Forecast Year
2024-2032
Start Value
$7.1 Billion
Forecast Value
$10.7 Billion
CAGR
4.7%
In terms of distribution channels, the market is divided into direct and indirect segments. The direct segment led the market in 2023, holding a 52.6% share, and is expected to grow at a CAGR of 4.9% through 2032. Direct distribution channels are favored due to their ability to create stronger relationships between manufacturers and end-users. This approach allows for tailored solutions, faster delivery, and better after-sales service. Additionally, it provides manufacturers with real-time feedback, allowing for continuous improvement and enhanced customer satisfaction.
The U.S. gas station equipment market generated USD 1.4 billion in 2023 and is forecast to grow at a robust CAGR of 5.4% through 2032. The country's well-established fueling infrastructure and high vehicle ownership rates contribute to its dominant market position. Ongoing investments in cutting-edge fueling technologies, along with the expansion of EV charging networks, will further boost its market growth.
Table of Contents
Chapter 1 Methodology & Scope
1.1 Market scope & definition
1.2 Base estimates & calculations
1.3 Forecast parameters
1.4 Data sources
1.4.1 Primary
1.5 Secondary
1.5.1 Paid sources
1.5.2 Public sources
Chapter 2 Executive Summary
2.1 Industry synopsis, 2021 - 2032
Chapter 3 Industry Insights
3.1 Industry ecosystem analysis
3.1.1 Factor affecting the value chain
3.1.2 Profit margin analysis
3.1.3 Disruptions
3.1.4 Future outlook
3.1.5 Manufacturers
3.1.6 Distributors
3.2 Supplier landscape
3.3 Profit margin analysis
3.4 Key news & initiatives
3.5 Regulatory landscape
3.6 Technological landscape
3.7 Impact forces
3.7.1 Growth drivers
3.7.1.1 Increasing adoption of alternative fuels and EV charging infrastructure.
3.7.1.2 Technological advancements in fuel dispensing and automation systems.
3.7.1.3 Rising demand for energy-efficient and eco-friendly equipment.
3.7.1.4 Expanding transportation networks and urbanization
3.7.2 Industry pitfalls & challenges
3.7.2.1 High initial investment and maintenance costs.
3.7.2.2 Regulatory compliance and environmental concerns
3.8 Growth potential analysis
3.9 Porter’s analysis
3.10 PESTEL analysis
Chapter 4 Competitive Landscape, 2023
4.1 Introduction
4.2 Company market share analysis
4.3 Competitive positioning matrix
4.4 Strategic outlook matrix
Chapter 5 Market Estimates and Forecast, By Type, 2021 – 2032 (USD Billion) (Thousand units)
5.1 Key trends
5.2 Tanks
5.3 Fuel dispensers
5.4 Nozzles
5.5 Pumps
5.6 Hoses
5.7 Tire inflators
5.8 C-Store equipment
5.9 Others (pump filters, etc.)
Chapter 6 Market Estimates and Forecast, By Fuel Type, 2021 – 2032 (USD Billion) (Thousand units)
6.1 Key trends
6.2 Gasoline
6.3 Diesel
6.4 Biofuel
6.5 Compressed Natural Gas (CNG)
6.6 Liquefied Natural Gas (LNG)
6.7 Hydrogen fueling
6.8 Others
Chapter 7 Market Estimates and Forecast, By End Use, 2021 – 2032 (USD Billion) (Thousand units)
7.1 Key trends
7.2 Retail gas stations
7.3 Commercial fleets
7.4 Aviation
7.5 Marine
7.6 Military
Chapter 8 Market Estimates & Forecast, By Distribution Channel, 2021 – 2032, (USD Billion) (Thousand units)