Recyclable Cups Market Opportunity, Growth Drivers, Industry Trend Analysis, and Forecast 2024 - 2032
상품코드:1665019
리서치사:Global Market Insights Inc.
발행일:2024년 12월
페이지 정보:영문 220 Pages
라이선스 & 가격 (부가세 별도)
ㅁ Add-on 가능: 고객의 요청에 따라 일정한 범위 내에서 Customization이 가능합니다. 자세한 사항은 문의해 주시기 바랍니다.
한글목차
세계 재활용 컵 시장은 2023년 295억 달러에 달했으며, 2024년부터 2032년까지 연평균 복합 성장률(CAGR) 5.7%로 성장할 것으로 예상됩니다.
환경 의식 증가, 규제 강화, 기업 지속가능성에 대한 노력이 이 시장의 성장을 뒷받침하는 주요 요인입니다. 소비자가 환경 친화적인 대체품을 요구하게 되어, 재활용 기술의 진보나 음료 산업의 확대가, 종래의 일회용 컵에 비해 보다 지속 가능한 선택으로서 재활용 컵의 변화에 박차를 가하고 있습니다.
시장은 종이, 플라스틱, 금속, 유리, 대나무 섬유 및 기타 재활용 가능한 소재와 같은 소재 유형에 따라 구분됩니다. 종이컵 부문은 2023년에 169억 달러의 수익으로 시장을 선도했으며, 2032년까지 견고한 연평균 성장률(CAGR) 5.9%로 성장할 것으로 예상됩니다. 플라스틱의 사용 규제가 강화되어 환경에 대한 관심이 높아지면서 종이컵이 선택되도록 되어 있습니다. 그러나 전통적인 종이컵은 종종 폴리에틸렌 라이닝을 사용하며 재활용 문제에 직면합니다. 이로 인해 생분해성 소재와 완전히 재활용 가능한 소재의 기술 혁신이 추진되어 보다 지속 가능한 종이컵 솔루션에 대한 수요가 더욱 높아지고 있습니다.
시장 범위
시작연도
2023
예측연도
2024-2032
시작금액
295억 달러
예측 금액
477억 달러
CAGR
5.7%
재활용 컵 시장은 또한 최종 사용자별로 주택용과 상업용으로 구분되며, 2023년에는 상업용이 압도적인 95%의 점유율을 차지했습니다. 이 부문은 2024년과 2032년 사이에 CAGR 5.7%로 성장할 것으로 예상됩니다. 접객, 푸드서비스, 이벤트 등의 분야에서 일회용 플라스틱이 금지되고 있기 때문에 재활용 가능하고 재사용 가능한 옵션으로의 이동이 가속화되고 있습니다. 기업은 지속가능성과 환경에 미치는 영향을 줄이기 위한 헌신의 일환으로 종이, 대나무 섬유, 재활용 가능한 플라스틱 컵을 채택하고 있습니다.
미국에서 재활용 컵 시장은 2023년에 90억 달러의 매출을 올렸고, 2032년까지 연평균 복합 성장률(CAGR)은 5.8%를 나타낼 것으로 예상됩니다. 이 시장의 성장을 이끌어내는 것은 소비자의 에코 의식 증가, 정부 정책 진화, 외식 산업 수요 증가, 재활용 인프라 개선입니다. 지속가능성이 소비자의 우선순위가 됨에 따라 종이, 대나무, 식물 유래 소재로 만든 퇴비화 가능한 컵과 재사용 가능한 컵에 대한 수요가 계속 증가하고 있습니다. 일회용 플라스틱의 사용을 억제하는 규제 조치는 환경 친화적인 대체품 시장을 더욱 강화하고 있습니다.
목차
제1장 조사 방법과 조사 범위
시장 범위와 정의
기본 추정과 계산
예측 계산
데이터 소스
1차 데이터
2차 데이터
유료 정보원
공적 정보원
제2장 주요 요약
제3장 업계 인사이트
생태계 분석
밸류체인에 영향을 주는 요인
이익률 분석
파괴
장래의 전망
제조업체
유통업체
공급자의 상황
이익률 분석
주요 뉴스 및 이니셔티브
규제 상황
영향요인
성장 촉진요인
환경 의식의 고조
친환경 제품에 대한 소비자 수요
업계의 잠재적 위험 및 과제
다른 친환경 대체품과의 경쟁
종래의 플라스틱과의 경쟁
소비자의 구매행동분석
성장 가능성 분석
Porter's Five Forces 분석
PESTEL 분석
제4장 경쟁 구도
소개
기업 점유율 분석
경쟁 포지셔닝 매트릭스
전략 전망 매트릭스
제5장 시장 추정 및 예측 : 소재 유형별, 2021-2032년
주요 동향
종이컵
코팅 컵
비코팅컵
플라스틱 컵
금속 컵
유리컵
대나무 섬유 컵
기타(복합 컵, 발포 컵 등)
제6장 시장 추정 및 예측 : 용량별, 2021-2032년
주요 동향
10온스까지
10-15온스
15온스 이상
제7장 시장 추정 및 예측 : 가격별, 2021-2032년
주요 동향
저렴한 가격
중가격
고가격
제8장 시장 추정 및 예측 : 용도별, 2021-2032년
주요 동향
핫 음료
콜드 음료
제9장 시장 추정 및 예측 : 최종 용도별, 2021-2032년
주요 동향
주택용
업무용
음식
호텔 및 카페
접객와 이벤트
기타(퀵 서비스 레스토랑 등)
제10장 시장 추정 및 예측 : 유통 채널별, 2021-2032년
주요 동향
직접 판매
간접판매
제11장 시장 추정 및 예측 : 지역별, 2021-2032년
주요 동향
북미
미국
캐나다
유럽
영국
독일
프랑스
이탈리아
스페인
러시아
아시아태평양
중국
인도
일본
한국
호주
라틴아메리카
브라질
멕시코
중동 및 아프리카
UAE
사우디아라비아
남아프리카
제12장 기업 프로파일
Ball
Benders Paper Cups
Berry Global
BioCup
Dart Container
Detmold
EcoSoul
Georgia-Pacific
Golden Paper Cups
Green Paper Products
Huhtamaki
Nippon Paper
Pactiv
SogreenPack
Solo Cup Company
SHW
영문 목차
영문목차
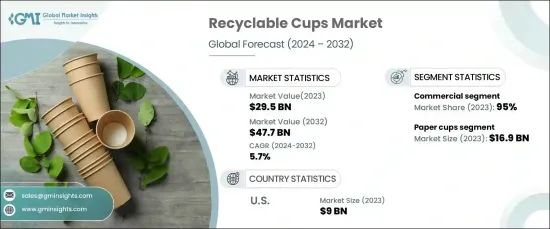
The Global Recyclable Cups Market reached a value of USD 29.5 billion in 2023 and is projected to grow at a CAGR of 5.7% from 2024 to 2032. Rising environmental awareness, stricter regulations, and corporate sustainability efforts are key factors propelling the growth of this market. As consumers increasingly demand eco-friendly alternatives, advancements in recycling technologies and the expansion of the beverage industry are fueling the shift toward recyclable cups as a more sustainable option compared to traditional disposable cups.
The market is segmented by material type, including paper, plastic, metal, glass, bamboo fiber, and other recyclable materials. The paper cup segment led the market in 2023 with a revenue of USD 16.9 billion and is expected to grow at a robust CAGR of 5.9% through 2032. The increasing restrictions on plastic use and growing environmental concerns are making paper cups the preferred choice. However, traditional paper cups, which often feature polyethylene linings, face recycling challenges. This has driven innovation in biodegradable and fully recyclable materials, further propelling the demand for more sustainable paper cup solutions.
Market Scope
Start Year
2023
Forecast Year
2024-2032
Start Value
$29.5 Billion
Forecast Value
$47.7 Billion
CAGR
5.7%
The recyclable cups market is also segmented by end-users into residential and commercial applications, with the commercial segment accounting for a dominant 95% share in 2023. This segment is expected to grow at a CAGR of 5.7% between 2024 and 2032. The growing bans on single-use plastics in sectors such as hospitality, food services, and events have accelerated the shift toward recyclable and reusable options. Businesses are adopting paper, bamboo fiber, and recyclable plastic cups as part of their commitment to sustainability and reducing environmental impact.
In the U.S., the recyclable cups market generated USD 9 billion in revenue in 2023 and is expected to experience a CAGR of 5.8% through 2032. The growth of this market is driven by heightened eco-consciousness among consumers, evolving government policies, increased demand within the food service industry, and improvements in recycling infrastructure. As sustainability becomes a priority for consumers, the demand for compostable and reusable cups made from paper, bamboo, and plant-based materials continues to rise. Regulatory measures that curb the use of single-use plastics are further propelling the market for eco-friendly alternatives.
Table of Contents
Chapter 1 Methodology & Scope
1.1 Market scope & definitions
1.2 Base estimates & calculations
1.3 Forecast calculations.
1.4 Data sources
1.4.1 Primary
1.4.2 Secondary
1.4.2.1 Paid sources
1.4.2.2 Public sources
Chapter 2 Executive Summary
2.1 Industry synopsis, 2021-2032
Chapter 3 Industry Insights
3.1 Industry ecosystem analysis
3.1.1 Factor affecting the value chain.
3.1.2 Profit margin analysis.
3.1.3 Disruptions
3.1.4 Future outlook
3.1.5 Manufacturers
3.1.6 Distributors
3.2 Supplier landscape
3.3 Profit margin analysis.
3.4 Key news & initiatives
3.5 Regulatory landscape
3.6 Impact forces
3.6.1 Growth drivers
3.6.1.1 Increased environmental awareness
3.6.1.2 Consumer demand for eco-friendly products
3.6.2 Industry pitfalls & challenges
3.6.2.1 Competition from other eco-friendly alternatives
3.6.2.2 Competition from traditional plastics
3.7 Consumer buying behavior analysis
3.8 Growth potential analysis
3.9 Porter’s analysis
3.10 PESTEL analysis
Chapter 4 Competitive Landscape, 2023
4.1 Introduction
4.2 Company market share analysis
4.3 Competitive positioning matrix
4.4 Strategic outlook matrix
Chapter 5 Market Estimates & Forecast, By Material Type, 2021-2032 (USD Billion) (Million Units)