자동차용 토크 컨버터 시장 기회, 성장 촉진요인, 업계 동향 분석 및 예측(2026-2035년)
Automotive Torque Converter Market Opportunity, Growth Drivers, Industry Trend Analysis, and Forecast 2026 - 2035
상품코드:1892900
리서치사:Global Market Insights Inc.
발행일:2025년 12월
페이지 정보:영문 230 Pages
라이선스 & 가격 (부가세 별도)
ㅁ Add-on 가능: 고객의 요청에 따라 일정한 범위 내에서 Customization이 가능합니다. 자세한 사항은 문의해 주시기 바랍니다.
한글목차
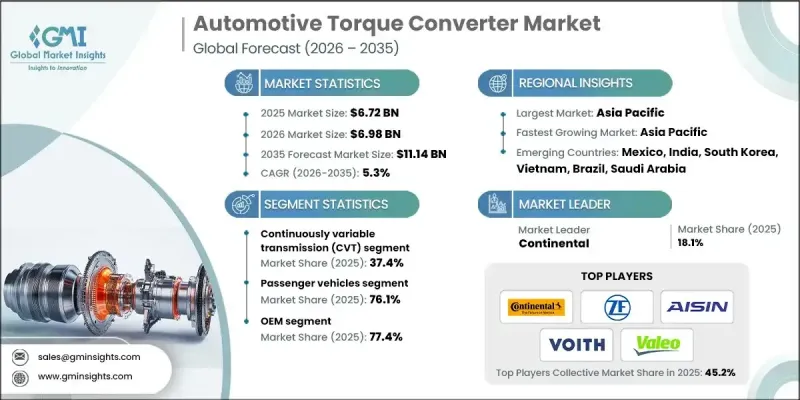
세계의 자동차용 토크 컨버터 시장은 2025년에 67억 2,000만 달러로 평가되었으며, 2035년까지 연평균 복합 성장률(CAGR) 5.3%를 나타내 111억 4,000만 달러에 이를 것으로 예측됩니다.
이 성장은 특히 도시 지역에서 더 부드럽고 쉬운 운전 경험을 제공하는 자동 변속기의 채용 증가에 의해 견인되었습니다. 토크 컨버터는 복잡한 클러치와 기어 기구를 유압 유체 기반 시스템으로 대체하여 기존 차량을 변화시켜 클러치 페달 없이 차량 운전을 가능하게 하고 있습니다. 승용차 및 상용차 함대 모두에서 자동 변속기에 대한 소비자 선호도 증가가 시장 수요를 밀어 올리고 있습니다. 토크 컨버터는 또한 수동 변속기와 비교하여 연비 효율을 향상시키기 위해 그 채용을 더욱 촉진하고 있습니다. 미국과 영국 등 자동 변속차의 보급률이 높은 시장에서는 신차 생산과 애프터마켓 부품 교환의 양면에서 계속 큰 기회가 탄생하고 있습니다. 세계의 도시화와 하이브리드 자동차의 보급이 진행되고 있는 가운데, 토크 컨버터는 원활한 및 효율적인 차량 운전에 필수적이 되고 있습니다.
시장 범위
시작 연도
2025년
예측 연도
2026-2035년
시작 가치
67억 2,000만 달러
예측 금액
111억 4,000만 달러
CAGR
5.3%
무단 변속기(CVT) 부문은 뛰어난 연비 효율과 엔진을 최적의 회전수로 작동시키는 능력으로 2025년 37.4%의 점유율을 차지했습니다. CVT는 매끄럽고 매끄러운 운전 경험을 제공하며 도시 환경에서 점점 더 좋아지고 있습니다.
승용차 부문은 2025년에 51억 1,000만 달러 시장 규모를 기록했으며, 자동 변속기 탑재 차량에 대한 높은 수요를 반영합니다. 하이브리드 전기자동차(HEV)의 상승과 제조업체의 첨단 자동 변속기 기술의 추진이 이 부문의 성장을 이끌고 있습니다.
미국의 자동차용 토크 컨버터 시장은 2024년 17억 5,000만 달러에서 증가했으며, 2025년에는 18억 2,000만 달러에 이르렀습니다. 기술 진보로 미국 OEM 제조업체는 기업 평균 연비 기준(CAFE) 달성에 기여하는 고효율 토크 컨버터의 채용을 촉진하고 있습니다. 배터리형 전기자동차(BEV)는 토크 컨버터를 필요로 하지 않는 경우가 많지만 HEV 및 플러그인 하이브리드 차량(PHEV)은 효율과 성능을 극대화하기 위해 선진적이고 컴팩트한 컨버터에 의존하고 있습니다.
목차
제1장 조사 방법
제2장 주요 요약
제3장 업계 인사이트
생태계 분석
공급업체 현황
이익률
비용 구조
각 단계별 부가가치
밸류체인에 영향을 주는 요인
파괴적 혁신
업계에 미치는 영향요인
성장 촉진요인
세계의 오토매틱 트랜스미션의 보급 확대
승용차 생산의 성장
상용차 및 오프 하이웨이 차량의 성장
애프터마켓 및 서비스 시장의 성장
업계의 잠재적 위험 및 과제
전기자동차의 보급에 의한 자동 변속기 수요 감소
가격에 민감한 시장에서 수동 변속기 선호
시장 기회
하이브리드 전기자동차(HEV) 부문의 성장
OEM과의 시스템 레벨 최적화에 관한 제휴
지속가능성과 순환형 경제의 통합
애프터마켓 성능 및 레이싱 분야
성장 가능성 분석
규제 상황
북미
미국 : 미국 기업 평균 연비 기준(CAFE)
캐나다 : 캐나다 연방 경차 기준
유럽
독일 : 독일 도로 교통법(StVZO) 라이선싱 규정
프랑스 : 프랑스에 있어서 자동차 형식 인정의 틀
영국 : 영국 차량 인증 기관(VCA)
아시아태평양
중국 : 중국 VI 자동차 배출 가스 규제
일본 : 일본 자동차 형식 인정(JATA) 규제
인도 : 바랏 배출가스 규제기준
라틴아메리카
브라질 : 브라질 자동차 배출 가스 규제 프로그램(PROCONVE)
아르헨티나 : 아르헨티나 국가 자동차 안전 기준
멕시코 : 멕시코 국가 규격(NOM) 자동차 배출 가스 및 안전 기준
중동 및 아프리카
UAE : 아랍에미리트(UAE) 연방 자동차 안전 및 배출 가스 규제
남아프리카 : 남아프리카공화국 도로 교통법
사우디아라비아 : SASO 연비 기준 및 차량 안전 기준
Porter's Five Forces 분석
PESTEL 분석
기술 및 혁신 현황
현재 기술 동향
신흥 기술
가격 동향
지역별
제품별
생산 통계
생산 거점
소비 거점
수출입
코스트 내역 분석
제조 비용 구조
운영 비용 분석
인프라 비용 분석
비용 최적화 전략
특허 분석
지속가능성과 환경영향
토크 컨버터 생산에 있어서 탄소발자국
재료 재활용 가능성 분석
환경에 배려한 제조 수법
라이프 사이클 평가
최상의 시나리오
전망과 기회
제4장 경쟁 구도
서론
기업의 시장 점유율 분석
북미
유럽
아시아태평양
라틴아메리카
중동 및 아프리카
주요 시장 기업의 경쟁 분석
경쟁 포지셔닝 매트릭스
전략적 전망 매트릭스
주요 발전
인수합병
파트너십 및 협력
신제품 출시
사업 확대 계획과 자금 조달
제5장 시장 추계·예측 : 송전 방식별(2022-2035년)
자동화 수동 변속기(AMT)
듀얼 클러치 변속기(DCT)
무단 변속기(CVT)
기타
제6장 시장 추계·예측 : 컨버터별(2022-2035년)
단단
다단
록업
기타
제7장 시장 추계·예측 : 차량별(2022-2035년)
승용차
해치백
세단
SUV
상용차
경상용차(LCV)
중형상용차(MCV)
대형상용차(HCV)
제8장 시장 추계·예측 : 판매 채널별(2022-2035년)
OEM
애프터마켓
제9장 시장 추계·예측 : 지역별(2022-2035년)
북미
미국
캐나다
유럽
독일
영국
프랑스
이탈리아
스페인
러시아
북유럽 국가
베네룩스
아시아태평양
중국
인도
일본
한국
ANZ
싱가포르
말레이시아
인도네시아
베트남
태국
라틴아메리카
브라질
멕시코
아르헨티나
콜롬비아
중동 및 아프리카
남아프리카
사우디아라비아
아랍에미리트(UAE)
제10장 기업 프로파일
세계 기업
ZF Friedrichshafen
Schaeffler
Valeo
EXEDY
Aisin
BorgWarner
Yutaka Giken
Allison Transmission
JATCO
Punch Powertrain
Voith
Delphi Technologies
지역 기업
Zhejiang Torch Auto Parts
Hubei Aviation Precision Machinery Technology
Zhejiang Wanliyang
Transtar Industries
Florida Torque Converter
RevMax Converters
TCI Automotive
신흥 기업
Circle D Specialties
Coan Engineering
Hughes Performance
Hays Performance(Holley)
Sonnax Transmission Company
KTH
영문 목차
영문목차
The Global Automotive Torque Converter Market was valued at USD 6.72 billion in 2025 and is estimated to grow at a CAGR of 5.3% to reach USD 11.14 billion by 2035.
Growth is driven by the rising adoption of automatic transmissions, which offer a smoother, easier driving experience, particularly in urban areas. Torque converters are transforming traditional vehicles by replacing complex clutch and gear mechanisms with hydraulic fluid-based systems, allowing vehicles to operate without a clutch pedal. Increasing consumer preference for automatic transmission in both passenger cars and commercial fleets is boosting market demand. Torque converters also enhance fuel efficiency compared to manual transmissions, which further encourages adoption. Markets with high penetration of automatic vehicles, including the U.S. and the U.K., continue to create significant opportunities for both new vehicle production and aftermarket component replacement. As global urbanization and hybrid vehicle adoption grow, torque converters are becoming essential for seamless and efficient vehicle operation.
Market Scope
Start Year
2025
Forecast Year
2026-2035
Start Value
$6.72 Billion
Forecast Value
$11.14 Billion
CAGR
5.3%
The continuously variable transmission (CVT) segment held a 37.4% share in 2025 due to its superior fuel efficiency and ability to allow engines to operate at optimal revolutions per minute. CVTs provide a smooth, seamless driving experience that is increasingly favored in city environments.
The passenger vehicle segment generated USD 5.11 billion in 2025, reflecting high demand for automatic transmission vehicles. The rise of hybrid electric vehicles (HEVs) and manufacturers' push for advanced automatic transmission technology is driving growth in this segment.
United States Automotive Torque Converter Market reached USD 1.82 billion in 2025, up from USD 1.75 billion in 2024. Technological advancements are encouraging U.S.-based OEMs to adopt more efficient torque converters that help meet Corporate Average Fuel Economy (CAFE) standards. While battery-electric vehicles often do not require torque converters, HEVs and plug-in hybrids rely on advanced, compact converters to maximize efficiency and performance.
Key players in the Automotive Torque Converter Market include Schaeffler Technologies, BorgWarner, Exedy, Aisin Seiki, Allison Transmission, Continental, Voith, ZF Friedrichshafen, Valeo, and Delphi Technologies. Companies are strengthening their Automotive Torque Converter Market positions by developing high-efficiency and compact torque converters suitable for hybrid and plug-in hybrid electric vehicles. Strategic R&D investments are focused on improving fuel economy, reducing emissions, and enhancing durability. Leading manufacturers are forming alliances with OEMs to integrate advanced torque converters into next-generation automatic transmissions and continuously variable transmissions (CVTs). Technological innovation, including hydraulic optimization and lightweight materials, is being used to improve performance while lowering costs. Market leaders are also expanding global production capabilities and establishing service and aftermarket networks to ensure long-term customer support.
Table of Contents
Chapter 1 Methodology
1.1 Market scope and definition
1.2 Research design
1.2.1 Research approach
1.2.2 Data collection methods
1.3 Data mining sources
1.3.1 Global
1.3.2 Regional/Country
1.4 Base estimates and calculations
1.4.1 Base year calculation
1.4.2 Key trends for market estimation
1.5 Primary research and validation
1.5.1 Primary sources
1.6 Forecast
1.7 Research assumptions and limitations
Chapter 2 Executive Summary
2.1 Industry 3600 synopsis
2.2 Key market trends
2.2.1 Regional
2.2.2 Transmission
2.2.3 Converter
2.2.4 Vehicle
2.2.5 Sales Channel
2.3 TAM analysis, 2026-2035
2.4 CXO perspectives: Strategic imperatives
2.4.1 Executive decision points
2.4.2 Critical success factors
2.5 Future outlook and recommendations
Chapter 3 Industry Insights
3.1 Industry ecosystem analysis
3.1.1 Supplier landscape
3.1.2 Profit margin
3.1.3 Cost structure
3.1.4 Value addition at each stage
3.1.5 Factor affecting the value chain
3.1.6 Disruptions
3.2 Industry impact forces
3.2.1 Growth drivers
3.2.1.1 Growing global automatic transmission penetration