Digital Interactive Service Market, By Display Type, By Application, By Geography
상품코드:1699465
리서치사:Coherent Market Insights
발행일:2025년 03월
페이지 정보:영문
라이선스 & 가격 (부가세 별도)
ㅁ Add-on 가능: 고객의 요청에 따라 일정한 범위 내에서 Customization이 가능합니다. 자세한 사항은 문의해 주시기 바랍니다.
한글목차
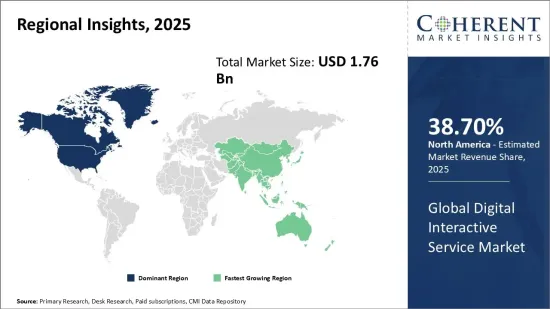
세계 디지털 인터랙티브 서비스 시장은 2025년에 17억 6,000만 달러, 2032년에는 26억 8,000만 달러에 이를 것으로 예측되며, 2025년부터 2032년까지의 연평균 성장률(CAGR)은 6.2%를 나타낼 전망입니다.
보고 범위
보고서 세부정보
기준연도
2024년
2025년 시장 규모
17억 6,000만 달러
실적 데이터
2020-2024년
예측 기간
2025-2032년
예측 기간 : 2025-2032년 CAGR :
6.20%
2032년 가치 예측
26억 8,000만 달러
그림. 디지털 인터랙티브 서비스 시장 점유율 지역별(%) 2025년
다양한 산업에서의 디지털화와 자동화 동향으로 디지털 플랫폼을 통해 제공되는 인터랙티브 서비스의 채택이 증가하고 있습니다. AI, IoT, 클라우드, 분석과 같은 기술의 발전으로 서비스 제공업체는 사용자에게 고도로 맞춤화되고 매력적인 디지털 체험을 사용자에게 제공할 수 있게 되었습니다. 인터넷과 스마트폰의 보급률의 성장과 디지털로 자동화된 서비스에 대한 소비자의 기호의 변화는 세계의 디지털 인터랙티브 서비스 시장을 전진시키는 주요 요인의 일부입니다.
시장 역학:
세계 디지털 인터랙티브 서비스 시장의 성장을 가속하는 주요 요인으로는 업계 전반의 디지털화와 자동화 동향의 확대, 인터넷과 스마트폰의 보급률 상승, 디지털 서비스에 대한 소비자의 기호의 변화 등이 있습니다. 그러나 디지털 데이터 수집 및 사용과 관련된 데이터 프라이버시 및 보안 문제는 시장에 큰 과제가 되고 있습니다. 향후 몇 년 동안 서비스 제공업체에 새로운 기회를 가져올 것으로 예측됩니다. 비디오 및 오디오 기반의 인터랙티브 툴의 인기가 높아지고 있는 것도, 시장 성장을 뒷받침하는 요인의 하나입니다. 그러나, 이러한 서비스에 관련된 높은 도입 비용과 유지관리 비용이, 특히 신흥국 시장에서 방해가 되고 있습니다.
본 조사의 주요 특징
본 보고서에서는 세계의 디지털 인터랙티브 서비스 시장을 상세하게 분석하여 2024년을 기준연도로 한 예측기간(2025년-2032년) 시장 규모 및 복합 연간 성장률(CAGR%)을 제공합니다.
또한 다양한 부문에 걸친 잠재적인 수익 기회를 밝히고 이 시장의 매력적인 투자 제안 매트릭스를 설명합니다.
또한 시장 성장 촉진요인, 억제요인, 기회, 신제품 출시 및 승인, 시장 동향, 지역별 전망, 주요 기업이 채용하는 경쟁 전략 등에 관한 중요한 고찰도 제공합니다.
엔터프라이즈 하이라이트, 제품 포트폴리오, 주요 하이라이트, 실적, 전략 등의 매개변수를 기반으로 세계 디지털 인터랙티브 서비스 시장의 주요 기업을 프로파일링합니다.
주요 기업으로는 Samsung Electronics, LG Electronics, Microsoft Corporation, Google LLC, Sharp Corporation, BenQ Corporation, Elo Touch Solutions, NEC Display Solutions, ViewSonic Corporation, SMART Technologies, Promethean World, InFocus Corporation, Panasonic Corporation, Cisco Systems, Inc., Acer Inc.
이 보고서의 통찰을 통해 마케팅 담당자와 기업 경영진은 향후 제품 출시, 타이핑, 시장 확대, 마케팅 전술에 대한 정보를 바탕으로 의사 결정을 내릴 수 있습니다.
이 조사 보고서는 투자자, 공급업체, 제품 제조업체, 유통업체, 신규 참가자, 재무 분석가 등 이 업계의 다양한 이해관계자를 대상으로 합니다.
이해관계자는 세계 디지털 인터랙티브 서비스 시장 분석에 사용되는 다양한 전략 매트릭스를 통해 의사결정을 용이하게 할 수 있습니다.
목차
제1장 조사의 목적과 전제조건
조사 목적
전제조건
약어
제2장 시장 전망
보고서 설명
시장 정의와 범위
주요 요약
제3장 시장 역학, 규제, 동향 분석
시장 역학
영향 분석
주요 하이라이트
규제 시나리오
제품 출시/승인
PEST 분석
PORTER 분석
시장 기회
규제 시나리오
주요 발전
업계 동향
제4장 세계의 디지털 인터랙티브 서비스 시장, 디스플레이 유형별, 2020년-2032년
인터랙티브 키오스크
인터랙티브 비디오 월
인터랙티브 테이블
인터랙티브 모니터
인터랙티브 화이트보드
제5장 세계의 디지털 인터랙티브 서비스 시장, 용도별, 2020년-2032년
소매
접객
헬스케어
교통기관
은행, 금융서비스 및 보험(BFSI)
기업
엔터테인먼트
교육
제6장 세계의 디지털 인터랙티브 서비스 시장, 지역별, 2020년-2032년
북미
라틴아메리카
유럽
아시아태평양
중동
아프리카
제7장 경쟁 구도
Samsung Electronics
LG Electronics
Microsoft Corporation
Google LLC
Sharp Corporation
BenQ Corporation
Elo Touch Solutions
NEC Display Solutions
ViewSonic Corporation
SMART Technologies
Promethean World
InFocus Corporation
Panasonic Corporation
Cisco Systems, Inc.
Acer Inc.
제8장 분석가 추천
행운의 수레바퀴
애널리스트의 견해
일관된 기회 맵
제9장 참고문헌과 조사 방법
참고문헌
조사 방법
출판사에 대해
SHW
영문 목차
영문목차
Global Digital Interactive Service Market is estimated to be valued at US$ 1.76 Bn in 2025 and is expected to reach US$ 2.68 Bn by 2032, growing at a compound annual growth rate (CAGR) of 6.2% from 2025 to 2032.
Report Coverage
Report Details
Base Year:
2024
Market Size in 2025:
USD 1.76 Bn
Historical Data for:
2020 To 2024
Forecast Period:
2025 To 2032
Forecast Period 2025 to 2032 CAGR:
6.20%
2032 Value Projection:
USD 2.68 Bn
Figure. Digital Interactive Service Market Share (%), By Region 2025
Digitalization and automation trends across various industry verticals have increased the adoption of interactive services which are offered through digital platforms. Interactive services allow users to engage in two-way communication and receive customized and personalized experience. Advancements in technologies, such as AI, IoT, cloud, and analytics, have enabled service providers to offer highly customized and engaging digital experiences to users. The growth of internet and smartphone penetration coupled with changing consumer preferences for digital and automated services are some of the key factors driving the global digital interactive service market forward. However, security and privacy concerns associated with digital data collection and usage may restrain the market growth to a certain extent.
Market Dynamics:
The key drivers propelling the growth of the global digital interactive service market include growing digitization and automation trends across industries, rising internet and smartphone penetration, and changing consumer preferences towards digital services. However, data privacy and security concerns associated with digital data collection and usage pose as major challenges for the market. But development of advanced technologies such as AI, Blockchain, augmented reality, and virtual reality are expected to create new opportunities for service providers in the coming years. Adoption of digital interactive services is increasing across sectors like education, healthcare, e-commerce, BFSI, manufacturing, media, and entertainment, among others. Rising popularity of video and audio based interactive tools is another factor boosting the market growth. However, high implementation and maintenance costs associated with these services hamper the market particularly in under developed regions.
Key Features of the Study:
This report provides in-depth analysis of the global digital interactive service market, and provides market size (US$ Billion) and compound annual growth rate (CAGR%) for the forecast period (2025-2032), considering 2024 as the base year
It elucidates potential revenue opportunities across different segments and explains attractive investment proposition matrices for this market
This study also provides key insights about market drivers, restraints, opportunities, new product launches or approvals, market trends, regional outlook, and competitive strategies adopted by key players
It profiles key players in the global digital interactive service market based on the following parameters - company highlights, products portfolio, key highlights, financial performance, and strategies
Key companies covered as a part of this study include Samsung Electronics, LG Electronics, Microsoft Corporation, Google LLC, Sharp Corporation, BenQ Corporation, Elo Touch Solutions, NEC Display Solutions, ViewSonic Corporation, SMART Technologies, Promethean World, InFocus Corporation, Panasonic Corporation, Cisco Systems, Inc., and Acer Inc.
Insights from this report would allow marketers and the management authorities of the companies to make informed decisions regarding their future product launches, type up-gradation, market expansion, and marketing tactics
The global digital interactive service market report caters to various stakeholders in this industry including investors, suppliers, product manufacturers, distributors, new entrants, and financial analysts
Stakeholders would have ease in decision-making through various strategy matrices used in analyzing the global digital interactive service market
Market Segmentation
Display Type Insights (Revenue, USD Bn, 2020 - 2032)