Cooling Towers Market, By Product Type, By Heat Transfer Method, By Application, By Geography
상품코드:1673077
리서치사:Coherent Market Insights
발행일:2025년 02월
페이지 정보:영문
라이선스 & 가격 (부가세 별도)
ㅁ Add-on 가능: 고객의 요청에 따라 일정한 범위 내에서 Customization이 가능합니다. 자세한 사항은 문의해 주시기 바랍니다.
한글목차
세계의 냉각탑 시장은 2025년에 36억 4,000만 달러로 추정되며, 2032년에는 52억 6,000만 달러에 달할 것으로 예측되며, 2025-2032년 연간 평균 성장률(CAGR)은 5.4%로 성장할 것으로 예측됩니다.
보고 범위
보고서 상세 내용
기준연도
2024년
2025년 시장 규모
36억 4,000만 달러
실적 데이터
2020-2024년
예측 기간
2025-2032년
예측 기간 : 2025-2032년 CAGR
5.40%
2032년 금액 예측
52억 6,000만 달러
도표. 2025년 지역별 냉각탑 시장 점유율(%)
냉각탑은 증기의 열을 대기로 방출하는 열 제거 장비입니다. 폐열을 대기로 방출함으로써 발전, HVAC, 산업 기계 등 다양한 산업에서 중요한 역할을 하고 있습니다. 신흥 경제국의 급속한 산업화와 제조 부문의 확대로 인해 산업 공정용 냉각탑에 대한 수요가 증가하고 있습니다. 또한 인구 증가와 도시화로 인한 에너지 소비 증가는 새로운 발전소 설치를 촉진하고 있으며, 이는 냉각탑 시장을 주도하고 있습니다. 그러나 냉각탑의 높은 초기 설치 비용과 높은 유지보수 비용은 시장 성장의 주요 과제입니다. 혁신적인 냉각 기술 부문의 지속적인 연구개발은 향후 수년간 다양한 기회를 제공할 것으로 예상됩니다.
시장 역학
세계 냉각탑 시장은 급속한 산업화와 제조업의 세계 성장에 의해 주도되고 있습니다. 인구 증가와 도시화로 인한 에너지 수요 증가는 새로운 발전소 설립을 촉진하고 냉각탑의 필요성을 높이고 있습니다. 그러나 냉각탑의 설치 및 유지보수에 따른 높은 초기 비용은 시장 성장에 영향을 미치는 주요 억제요인으로 작용하고 있습니다. 친환경 냉각 기술의 개발은 냉각탑 시장의 이해관계자들에게 유리한 기회를 제공합니다. 새로운 재료 및 설계를 통한 효율성 향상 부문에서 진행 중인 연구개발은 향후 냉각탑의 적용 가능성을 더욱 확대할 수 있습니다.
본 조사의 주요 특징
세계의 냉각탑 시장을 상세하게 분석하여 2024년을 기준 연도로 하여 예측 기간(2025-2032년) 시장 규모와 연평균 성장률(CAGR%)을 게재하고 있습니다.
또한 다양한 부문에 걸친 잠재적 매출 기회를 밝히고, 이 시장의 매력적인 투자 제안 매트릭스를 설명합니다.
또한 시장 성장 촉진요인, 억제요인, 기회, 신제품 출시 및 승인, 시장 동향, 지역별 전망, 주요 기업의 경쟁 전략 등에 대한 주요 인사이트를 제공합니다.
이 보고서는 기업 하이라이트, 제품 포트폴리오, 주요 하이라이트, 재무 성과, 전략 등의 매개 변수를 기반으로 세계 냉각탑 시장의 주요 기업을 프로파일링합니다.
이 보고서의 인사이트를 통해 마케팅 담당자와 기업 경영진은 향후 제품 출시, 유형화, 시장 확대, 마케팅 전술에 대한 정보에 입각한 의사결정을 내릴 수 있습니다.
냉각탑 세계 시장 보고서는 투자자, 공급업체, 제품 제조업체, 유통업체, 신규 시장 진출기업, 재무 분석가 등 이 산업의 다양한 이해관계자를 대상으로 합니다.
이해관계자들은 세계 냉각탑 시장 분석에 사용되는 다양한 전략 매트릭스를 통해 의사결정을 쉽게 내릴 수 있습니다.
목차
제1장 조사의 목적과 전제조건
조사 목적
전제조건
약어
제2장 시장 전망
리포트 설명
시장의 정의와 범위
개요
COM(Coherent Opportunity Map)(COM)
제3장 시장 역학, 규제, 동향 분석
시장 역학
촉진요인
억제요인
시장 기회
규제 시나리오
산업 동향
합병과 인수
신시스템 출시/승인
COVID-19 팬데믹의 영향
제4장 세계의 냉각탑 시장, 제품 유형별, 2020-2032년
서론
개회로 냉각탑
폐회로 냉각탑
제5장 세계의 냉각탑 시장, 전열방식별, 2020-2032년
서론
증발 냉각
건식 냉각
백연방지(하이브리드) 냉각
제6장 세계의 냉각탑 시장, 용도별, 2020-2032년
서론
공조
발전
제조
제7장 세계의 냉각탑 시장, 지역별, 2020-2032년
서론
북미
유럽
아시아태평양
라틴아메리카
중동 및 아프리카
제8장 경쟁 구도
기업 개요
Baltimore Aircoil Company Inc.
Bell Cooling Tower
Brentwood Industries, Inc.
ENEXIO Management GmbH
Evapco, Inc.
Hamon &Cie International SA
ILMED IMPIANTI SRL
JACIR-GOHL
JAEGGI Hybridtechnologie AG
Johnson Controls, Inc.
Kelvion Holding GmbH
Krones AG
MITA Cooling Technologies Srl
Paharpur Cooling Tower Limited
SPX CORPORATION
제9장 애널리스트의 권장사항
운명의 수레바퀴
COM(Coherent Opportunity Map)
제10장 조사 방법
참고 문헌
조사 방법
KSA
영문 목차
영문목차
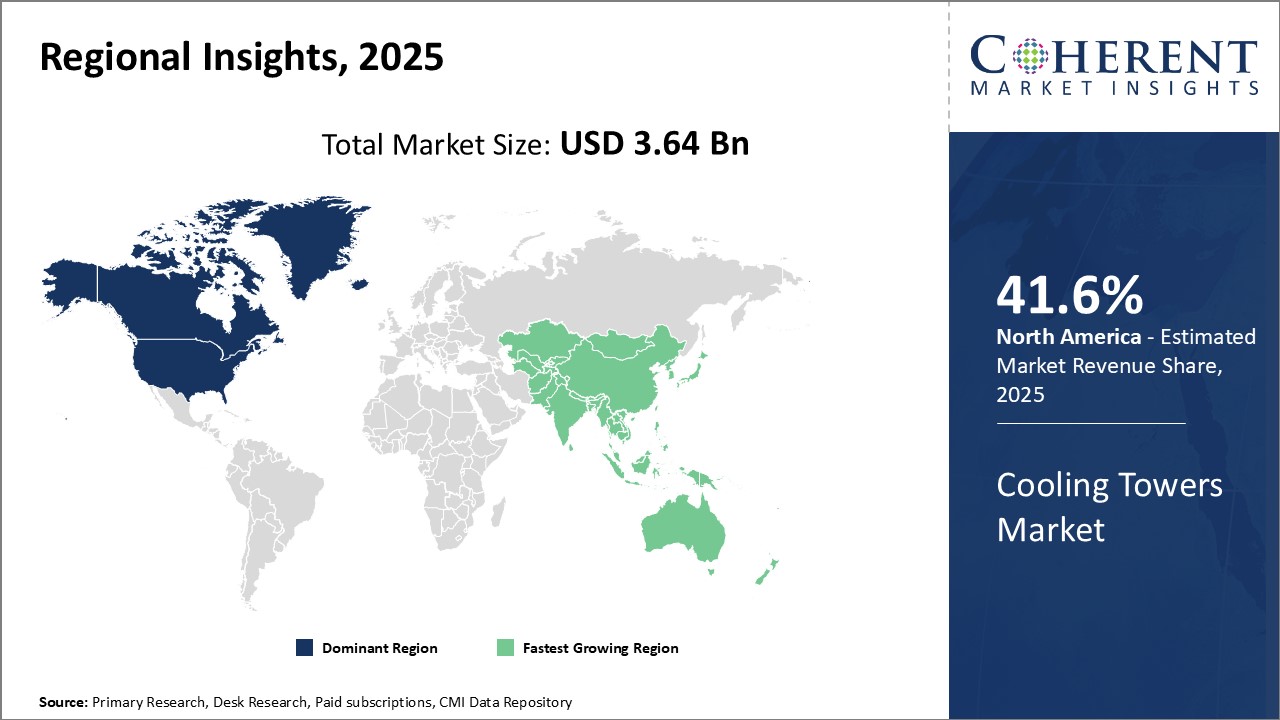
Global Cooling Towers Market is estimated to be valued at USD 3.64 Bn in 2025 and is expected to reach USD 5.26 Bn by 2032, growing at a compound annual growth rate (CAGR) of 5.4% from 2025 to 2032.
Report Coverage
Report Details
Base Year:
2024
Market Size in 2025:
USD 3.64 Bn
Historical Data for:
2020 To 2024
Forecast Period:
2025 To 2032
Forecast Period 2025 to 2032 CAGR:
5.40%
2032 Value Projection:
USD 5.26 Bn
Figure. Cooling Towers Market Share (%), By Region 2025
Cooling towers are heat removal devices that release heat from the steam back into the atmosphere. They play a crucial role in various industries such as power generation, HVAC, and industrial machineries by rejecting waste heat to the atmosphere. Rapid industrialization and expansion of manufacturing sector across developing economies have increased the demand for cooling towers for industrial processes. Moreover, rising energy consumption driven by increasing population and urbanization is propelling the installation of new power plants, which in turn is driving the cooling towers market. However, high initial installation and maintenance cost of cooling towers remain a key challenge for market growth. Ongoing research and development in the field of innovative cooling technologies are expected to bring various opportunities in the coming years.
Market Dynamics:
The global cooling towers market is driven by factors such as rapid industrialization and growing manufacturing sector globally. The increasing demand for energy due to rising population and urbanization is propelling the setting up of new power plants, which, in turn, is augmenting the need for cooling towers. However, high initial costs associated with the installation and maintenance of cooling towers acts as a major restraining factor affecting the market growth. The development of eco-friendly cooling technologies presents lucrative opportunities for the stakeholders in the cooling towers market. Ongoing R&D in the area of improving efficiency through new materials and design can further expand the application scope of cooling towers in future.
Key Features of the Study:
This report provides in-depth analysis of the global cooling towers market, and provides market size (US$ Bn) and compound annual growth rate (CAGR%) for the forecast period (2025-2032), considering 2024 as the base year
It elucidates potential revenue opportunities across different segments and explains attractive investment proposition matrices for this market
This study also provides key insights about market drivers, restraints, opportunities, new product launches or approval, market trends, regional outlook, and competitive strategies adopted by key players
It profiles key players in the global cooling towers market based on the following parameters - company highlights, products portfolio, key highlights, financial performance, and strategies
Key companies covered as a part of this study include Baltimore Aircoil Company Inc., Bell Cooling Tower, Brentwood Industries, Inc., ENEXIO Management GmbH, Evapco, Inc., Hamon & Cie International SA, ILMED IMPIANTI SRL, JACIR - GOHL, JAEGGI Hybridtechnologie AG, Johnson Controls, Inc., Kelvion Holding GmbH, Krones AG, MITA Cooling Technologies Srl, Paharpur Cooling Tower Limited, and SPX CORPORATION
Insights from this report would allow marketers and the management authorities of the companies to make informed decisions regarding their future product launches, type up-gradation, market expansion, and marketing tactics
The global cooling towers market report caters to various stakeholders in this industry including investors, suppliers, product manufacturers, distributors, new entrants, and financial analysts
Stakeholders would have ease in decision-making through various strategy matrices used in analyzing the global cooling towers market
Detailed Segmentation:
By Product Type
Open Cooling Tower
Closed Circuit Cooling Tower
By Heat Transfer Method
Evaporative Cooling
Dry Cooling
Plume Abatement (Hybrid) Cooling
By Application
Air-Conditioning
Power Generation
Manufacturing Industry
By Regional
North America
Latin America
Europe
Asia Pacific
Middle East & Africa
Key Players Insights
Baltimore Aircoil Company Inc.
Bell Cooling Tower
Brentwood Industries, Inc.
ENEXIO Management GmbH
Evapco, Inc.
Hamon & Cie International SA
ILMED IMPIANTI SRL
JACIR - GOHL
JAEGGI Hybridtechnologie AG
Johnson Controls, Inc.
Kelvion Holding GmbH
Krones AG
MITA Cooling Technologies Srl
Paharpur Cooling Tower Limited
SPX CORPORATION
Table of Contents
1. Research Objectives and Assumptions
Research Objectives
Assumptions
Abbreviations
2. Market Purview
Report Description
Market Definition and Scope
Executive Summary
Market Snippet, By Product Type
Market Snippet, By Heat Transfer Method
Market Snippet, By Application
Market Snippet, By Region
Coherent Opportunity Map (COM)
3. Market Dynamics, Regulations, and Trends Analysis
Market Dynamics
Drivers
Restraints
Market Opportunities
Regulatory Scenario
Industry Trend
Merger and Acquisitions
New System Launches/Approvals
Impact of COVID-19 Pandemic
4. Global Cooling Towers Market, By Product Type, 2020-2032, (US$ Bn)
Introduction
Market Share Analysis, 2025 and 2032 (%)
Y-o-Y Growth Analysis, 2020-2032
Segment Trends
Open Cooling Tower
Introduction
Market Size and Forecast, 2020-2032, (US$ Bn)
Closed Circuit Cooling Tower
Introduction
Market Size and Forecast, 2020-2032, (US$ Bn)
5. Global Cooling Towers Market, By Heat Transfer Method, 2020-2032, (US$ Bn)
Introduction
Market Share Analysis, 2025 and 2032 (%)
Y-o-Y Growth Analysis, 2020-2032
Segment Trends
Evaporative Cooling
Introduction
Market Size and Forecast, 2020-2032, (US$ Bn)
Dry Cooling
Introduction
Market Size and Forecast, 2020-2032, (US$ Bn)
Plume Abatement (Hybrid) Cooling
Introduction
Market Size and Forecast, 2020-2032, (US$ Bn)
6. Global Cooling Towers Market, By Application, 2020-2032, (US$ Bn)
Introduction
Market Share Analysis, 2025 and 2032 (%)
Y-o-Y Growth Analysis, 2020-2032
Segment Trends
Air-Conditioning
Introduction
Market Size and Forecast, 2020-2032, (US$ Bn)
Power Generation
Introduction
Market Size and Forecast, 2020-2032, (US$ Bn)
Manufacturing Industry
Introduction
Mark
et Size and Forecast, 2020-2032, (US$ Bn)
7. Global Cooling Towers Market, By Region, 2020-2032, (US$ Bn)
Introduction
Market Share Analysis, By Region, 2025 and 2032 (%)
Y-o-Y Growth Analysis, 2020-2032
North America
Regional Trends
Market Size and Forecast, By Product Type, 2020-2032, (US$ Bn)
Market Size and Forecast, By Heat Transfer Method, 2020-2032, (US$ Bn)
Market Size and Forecast, By Application, 2020-2032, (US$ Bn)
Market Size and Forecast, By Country, 2020-2032, (US$ Bn)
U.S.
Canada
Europe
Regional Trends
Market Size and Forecast, By Product Type, 2020-2032, (US$ Bn)
Market Size and Forecast, By Heat Transfer Method, 2020-2032, (US$ Bn)
Market Size and Forecast, By Application, 2020-2032, (US$ Bn)
Market Size and Forecast, By Country, 2020-2032, (US$ Bn)
Germany
U.K.
Spain
France
Italy
Russia
Rest of Europe
Asia Pacific
Regional Trends
Market Size and Forecast, By Product Type, 2020-2032, (US$ Bn)
Market Size and Forecast, By Heat Transfer Method, 2020-2032, (US$ Bn)
Market Size and Forecast, By Application, 2020-2032, (US$ Bn)
Market Size and Forecast, By Country, 2020-2032, (US$ Bn)
China
India
Japan
ASEAN
Australia
South Korea
Rest of Asia Pacific
Latin America
Regional Trends
Market Size and Forecast, By Product Type, 2020-2032, (US$ Bn)
Market Size and Forecast, By Heat Transfer Method, 2020-2032, (US$ Bn)
Market Size and Forecast, By Application, 2020-2032, (US$ Bn)
Market Size and Forecast, By Country, 2020-2032, (US$ Bn)
Brazil
Argentina
Mexico
Rest of Latin America
Middle East & Africa
Regional Trends
Market Size and Forecast, By Product Type, 2020-2032, (US$ Bn)
Market Size and Forecast, By Heat Transfer Method, 2020-2032, (US$ Bn)
Market Size and Forecast, By Application, 2020-2032, (US$ Bn)
Market Size and Forecast, By Country, 2020-2032, (US$ Bn)