Managed Mobility Services Market, By Function, By Organization Size, By Industry Vertical, By Geography
상품코드:1672946
리서치사:Coherent Market Insights
발행일:2025년 02월
페이지 정보:영문
라이선스 & 가격 (부가세 별도)
ㅁ Add-on 가능: 고객의 요청에 따라 일정한 범위 내에서 Customization이 가능합니다. 자세한 사항은 문의해 주시기 바랍니다.
한글목차
세계 매니지드 모빌리티 서비스 시장은 2025년 299억 7,000만 달러, 2032년에는 1,812억 1,000만 달러에 달할 것으로 예측되며, 2025-2032년 연평균 29.3%의 성장률을 보일 것으로 예상됩니다.
보고 범위
보고서 상세 내용
기준 연도
2024년
2025년 시장 규모
299억 7,000만 달러
실적 데이터
2020-2024년
예측 기간
2025-2032년
예측 기간(2025-2032년) CAGR
29.30%
2032년 금액 예측
1,812억 1,000만 달러
그림. 매니지드 모빌리티 서비스 시장 점유율(%), 2025년 지역별 시장 점유율(%)
매니지드 모빌리티 서비스는 조직 내 직원들이 사용하는 모바일 디바이스를 중앙에서 관리하고 지원하는 것을 말합니다. 이러한 서비스는 직원들이 사용하는 다양한 모바일 기기와 용도를 안전하게 도입, 통합, 지원할 수 있도록 지원합니다. 전체 모바일 기기의 소유권, 관리, 보안을 중앙에서 관리하면서 비즈니스 정책 및 규정 준수를 보장합니다. 매니지드 모빌리티 서비스를 통해 기업은 모빌리티 솔루션을 효율적이고 비용 효율적으로 활용하면서 핵심 비즈니스 활동에 집중할 수 있습니다.
시장 역학
매니지드 모빌리티 서비스 시장은 모바일 기기에서 기업 데이터에 안전하게 액세스하고, 점점 더 모바일화 되어가는 직원들을 지원하고자 하는 기업의 니즈가 증가함에 따라 성장하고 있습니다. 조직에서 BYOD(Bring-your-own-device) 정책의 채택이 증가함에 따라 모빌리티 이니셔티브를 효과적으로 관리하는 것이 점점 더 중요해지고 있습니다. 이에 따라 다양한 산업의 대기업뿐만 아니라 중소기업에서도 매니지드 모빌리티 서비스에 대한 수요가 증가하고 있습니다. 그러나 모바일 기기와 관련된 데이터 프라이버시 및 보안에 대한 우려는 시장 성장을 저해할 수 있습니다. 사물인터넷(IoT) 트렌드 증가는 매니지드 서비스 제공업체들이 서비스를 확장할 수 있는 새로운 기회를 창출하고 있습니다. 매니지드 모빌리티 플랫폼과 분석 기능의 통합은 시장 진출기업들에게도 기회를 제공할 것입니다.
본 조사의 주요 특징
세계의 매니지드 모빌리티 서비스(Managed Mobility Services) 시장을 상세하게 분석했으며, 2024년을 기준 연도로 하여 예측 기간(2025-2032년) 시장 규모와 연평균 성장률(CAGR%)에 대해 조사 분석하여 전해드립니다.
또한, 다양한 부문에 걸친 잠재적 수익 기회를 밝히고, 이 시장의 매력적인 투자 제안 매트릭스를 설명합니다.
또한 시장 성장 촉진요인, 억제요인, 기회, 신제품 출시 및 승인, 시장 동향, 지역별 전망, 주요 기업의 경쟁 전략 등에 대한 주요 고찰을 제공합니다.
이 보고서는 기업 하이라이트, 제품 포트폴리오, 주요 하이라이트, 재무 성과, 전략 등의 매개 변수를 기반으로 세계 매니지드 모빌리티 서비스 시장의 주요 기업을 프로파일링합니다.
이 보고서의 통찰력을 통해 마케팅 담당자와 기업 경영진은 향후 제품 출시, 유형화, 시장 확대, 마케팅 전술에 대한 정보에 입각한 의사결정을 내릴 수 있습니다.
세계 매니지드 모빌리티 서비스 시장 보고서는 투자자, 공급업체, 제품 제조업체, 유통업체, 신규 시장 진출기업, 재무 분석가 등 이 산업의 다양한 이해관계자를 대상으로 합니다.
이해관계자들은 세계 매니지드 모빌리티 서비스 시장 분석에 사용되는 다양한 전략 매트릭스를 통해 의사결정을 쉽게 내릴 수 있습니다.
목차
제1장 조사 목적과 전제조건
조사 목적
전제조건
약어
제2장 시장 전망
보고서 설명
시장 정의와 범위
주요 요약
Coherent Opportunity Map (COM)
제3장 시장 역학, 규제, 동향 분석
시장 역학
성장 촉진요인
성장 억제요인
시장 기회
규제 시나리오
산업 동향
인수합병(M&A)
신시스템 시작/승인
COVID-19 팬데믹의 영향
제4장 세계의 매니지드 모빌리티 서비스 시장, 기능별, 2020-2032년
서론
디바이스 관리
애플리케이션 관리
보안 관리
지원 및 유지관리
제5장 세계의 매니지드 모빌리티 서비스 시장, 조직 규모별, 2020-2032년
서론
중소기업
대기업
제6장 세계의 매니지드 모빌리티 서비스 시장, 업계별, 2020-2032년
서론
의료
제조업
통신 및 IT
금융 서비스
소매
기타
제7장 세계의 매니지드 모빌리티 서비스 시장, 지역별, 2020-2032년
서론
북미
유럽
아시아태평양
라틴아메리카
중동 및 아프리카
제8장 경쟁 구도
기업 개요
IBM Corporation
AT&T Intellectual Property
BT Group plc
CDW Corporation
Deutsche Telekom AG
HCL Technologies Limited
Orange SA
Samsung SDS Co., Ltd.
Tata Consultancy Services Limited
Telefonica, SA
TELUS Corporation
T-Mobile US, Inc.
Verizon Business
Vodafone Group Plc
Wipro Limited
제9장 애널리스트 추천 사항
융성과 쇠퇴
Coherent Opportunity Map
제10장 조사 방법
참고 문헌
조사 방법
LSH
영문 목차
영문목차
Global Managed Mobility Services Market is estimated to be valued at USD 29.97 Bn in 2025 and is expected to reach USD 181.21 Bn by 2032, growing at a compound annual growth rate (CAGR) of 29.3% from 2025 to 2032.
Report Coverage
Report Details
Base Year:
2024
Market Size in 2025:
USD 29.97 Bn
Historical Data for:
2020 To 2024
Forecast Period:
2025 To 2032
Forecast Period 2025 to 2032 CAGR:
29.30%
2032 Value Projection:
USD 181.21 Bn
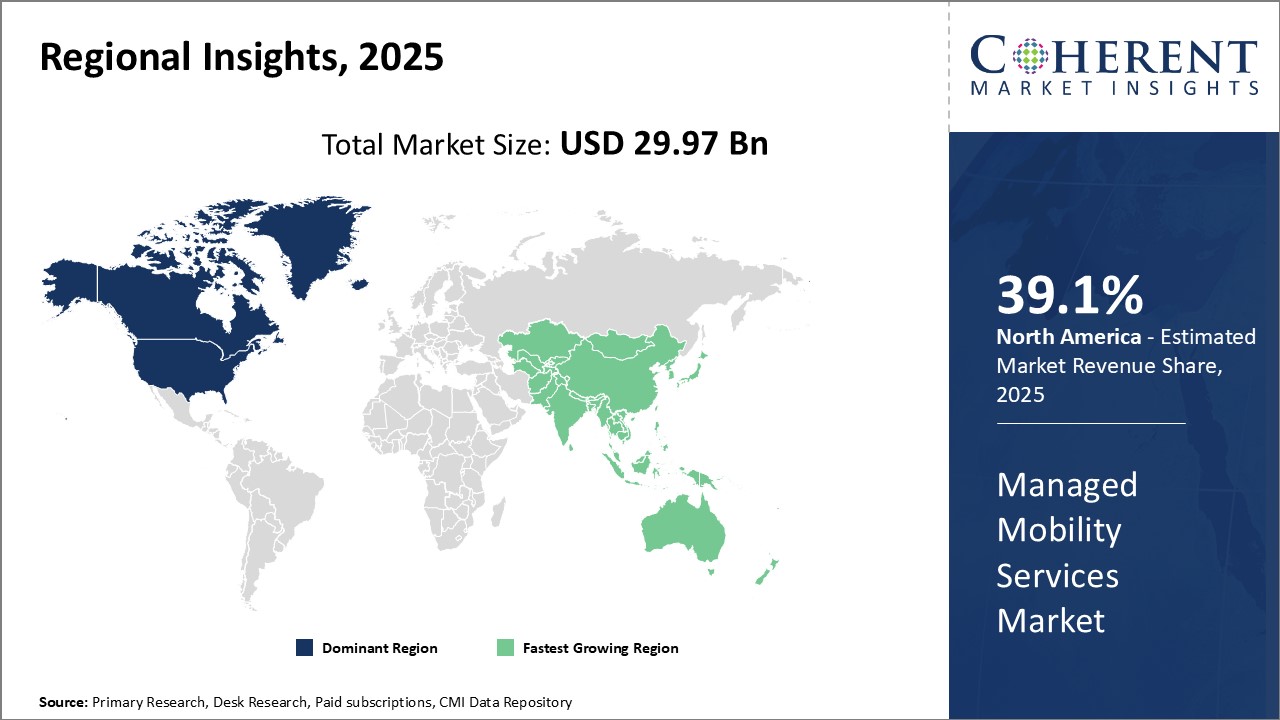
Figure. Managed Mobility Services Market Share (%), By Region 2025
Managed mobility services refer to the centralized management and support of mobile devices used by the workforce of an organization. These services help organizations to securely deploy, integrate, and support a variety of mobile devices and applications used by their employees. They provide single point of ownership, management, and security of the entire mobile fleet while ensuring compliance with business policies and regulations. Managed mobility services allow organizations to focus on their core business activities while leveraging mobility solutions efficiently and cost-effectively.
Market Dynamics:
The managed mobility services market is driven by the growing need of organizations to securely access corporate data on mobile devices and support an increasingly mobile workforce. Rising adoption of bring-your-own-device (BYOD) policy in organizations has heightened the importance of managing mobility initiatives effectively. This is resulting into increased demand for managed mobility services from SMBs as well as large enterprises across various industry verticals. However, data privacy and security concerns associated with mobile devices could restrain the market growth. Growing trend of Internet of Things (IoT) is unlocking new opportunities for managed service providers to expand their offerings. Integration of analytical capabilities with mobility management platforms also presents an opportunity for market participants.
Key features of the study:
This report provides in-depth analysis of the global managed mobility services market, and provides market size (US$ Billion) and compound annual growth rate (CAGR %) for the forecast period (2025-2032), considering 2024 as the base year.
It elucidates potential revenue opportunities across different segments and explains attractive investment proposition matrices for this market.
This study also provides key insights about market drivers, restraints, opportunities, new product launches or approval, market trends, regional outlook, and competitive strategies adopted by key players.
It profiles key players in the global managed mobility services market based on the following parameters - company highlights, products portfolio, key highlights, financial performance, and strategies.
Key companies covered as a part of this study include IBM Corporation, AT&T Intellectual Property, BT Group plc, CDW Corporation, Deutsche Telekom AG, HCL Technologies Limited, Orange S.A., Samsung SDS Co., Ltd., Tata Consultancy Services Limited, Telefonica, S.A., TELUS Corporation, T-Mobile US, Inc., Verizon Business, Vodafone Group Plc, and Wipro Limited
Insights from this report would allow marketers and the management authorities of the companies to make informed decisions regarding their future product launches, type up-gradation, market expansion, and marketing tactics.
The global managed mobility services market report caters to various stakeholders in this industry including investors, suppliers, product manufacturers, distributors, new entrants, and financial analysts.
Stakeholders would have ease in decision-making through various strategy matrices used in analyzing the global managed mobility services market.
Market Segmentation
By Function
Device Management
Application Management
Security Management
Support and Maintenance
By Organization Size
SMEs
Large Enterprises
By Industry Vertical
Healthcare
Manufacturing
Telecom and IT
Financial Services
Retail
Others
By Regional
North America
Europe
Asia Pacific
Latin America
Middle East & Africa
Key Players Insights
IBM Corporation
AT&T Intellectual Property
BT Group plc
CDW Corporation
Deutsche Telekom AG
HCL Technologies Limited
Orange S.A.
Samsung SDS Co., Ltd.
Tata Consultancy Services Limited
Telefonica, S.A.
TELUS Corporation
T-Mobile US, Inc.
Verizon Business
Vodafone Group Plc
Wipro Limited
Table of Contents
1. Research Objectives and Assumptions
Research Objectives
Assumptions
Abbreviations
2. Market Purview
Report Description
Market Definition and Scope
Executive Summary
Market Snippet, By Function
Market Snippet, By Organization Size
Market Snippet, By Industry Vertical
Market Snippet, By Region
Coherent Opportunity Map (COM)
3. Market Dynamics, Regulations, and Trends Analysis
Market Dynamics
Drivers
Restraints
Market Opportunities
Regulatory Scenario
Industry Trend
Merger and Acquisitions
New system Launch/Approvals
Impact of COVID-19 Pandemic
4. Global Managed Mobility Services Market, By Function, 2020-2032 (US$ Billion)
Introduction
Market Share Analysis, 2025 and 2032 (%)
Y-o-Y Growth Analysis, 2020-2032
Segment Trends
Device Management
Introduction
Market Size and Forecast, 2020-2032, (US$ Billion)
Application Management
Introduction
Market Size and Forecast, 2020-2032, (US$ Billion)
Security Management
Introduction
Market Size and Forecast, 2020-2032, (US$ Billion)
Support and Maintenance
Introduction
Market Size and Forecast, 2020-2032, (US$ Billion)
5. Global Managed Mobility Services Market, By Organization Size, 2020-2032 (US$ Billion)
Introduction
Market Share Analysis, 2025 and 2032 (%)
Y-o-Y Growth Analysis, 2020-2032
Segment Trends
SMEs
Introduction
Market Size and Forecast, 2020-2032, (US$ Billion)
Large Enterprises
Introduction
Market Size and Forecast, 2020-2032, (US$ Billion)
6. Global Managed Mobility Services Market, By Industry Vertical, 2020-2032 (US$ Billion)
Introduction
Market Share Analysis, 2025 and 2032 (%)
Y-o-Y Growth Analysis, 2020-2032
Segment Trends
Healthcare
Introduction
Market Size and Forecast, 2020-2032, (US$ Billion)
Manufacturing
Introduction
Market Size and Forecast, 2020-2032, (US$ Billion)
Telecom and IT
Introduction
Market Size and Forecast, 2020-2032, (US$ Billion)
Financial Services
Introduction
Market Size and Forecast, 2020-2032, (US$ Billion)
Retail
Introduction
Market Size and Forecast, 2020-2032, (US$ Billion)
Others
Introduction
Market Size and Forecast, 2020-2032, (US$ Billion)
7. Global Managed Mobility Services Market, By Region, 2020-2032 (US$ Billion)
Introduction
Market Share Analysis, By Region, 2025 and 2032 (%)
North America
Regional Trends
Market Size and Forecast, By Function, 2020-2032 (US$ Billion)
Market Size and Forecast, By Organization Size, 2020-2032 (US$ Billion)
Market Size and Forecast, By Industry Vertical, 2020-2032 (US$ Billion)
Market Share Analysis, By Country, 2025 and 2032 (%)
U.S.
Canada
Europe
Regional Trends
Market Size and Forecast, By Function, 2020-2032 (US$ Billion)
Market Size and Forecast, By Organization Size, 2020-2032 (US$ Billion)
Market Size and Forecast, By Industry Vertical, 2020-2032 (US$ Billion)
Market Share Analysis, By Country, 2025 and 2032 (%)
U.K.
Germany
France
Russia
Rest of Europe
Asia Pacific
Regional Trends
Market Size and Forecast, By Function, 2020-2032 (US$ Billion)
Market Size and Forecast, By Organization Size, 2020-2032 (US$ Billion)
Market Size and Forecast, By Industry Vertical, 2020-2032 (US$ Billion)
Market Share Analysis, By Country, 2025 and 2032 (%)
China
India
Japan
ASEAN
Australia
South Korea
Rest of Asia Pacific
Latin America
Regional Trends
Market Size and Forecast, By Function, 2020-2032 (US$ Billion)
Market Size and Forecast, By Organization Size, 2020-2032 (US$ Billion)
Market Size and Forecast, By Industry Vertical, 2020-2032 (US$ Billion)
Market Share Analysis, By Country, 2025 and 2032 (%)
Brazil
Argentina
Mexico
Rest of Latin America
Middle East and Africa
Regional Trends
Market Size and Forecast, By Function, 2020-2032 (US$ Billion)
Market Size and Forecast, By Organization Size, 2020-2032 (US$ Billion)
Market Size and Forecast, By Industry Vertical, 2020-2032 (US$ Billion)
Market Share Analysis, By Country, 2025 and 2032 (%)