°¡½ºÈ ½ÃÀå : ¿ø·áº°, ±â¼úº°, À¯Åë °æ·Îº°
Gasification Market, By Feedstock, By Technology, By Distribution Channel
»óǰÄÚµå
:
1671969
¸®¼Ä¡»ç
:
Coherent Market Insights
¹ßÇàÀÏ
:
2025³â 02¿ù
ÆäÀÌÁö Á¤º¸
:
¿µ¹®
¶óÀ̼±½º & °¡°Ý (ºÎ°¡¼¼ º°µµ)
¤± Add-on °¡´É: °í°´ÀÇ ¿äû¿¡ µû¶ó ÀÏÁ¤ÇÑ ¹üÀ§ ³»¿¡¼ CustomizationÀÌ °¡´ÉÇÕ´Ï´Ù. ÀÚ¼¼ÇÑ »çÇ×Àº ¹®ÀÇÇØ Áֽñ⠹ٶø´Ï´Ù.
»ùÇà ¿äû ¸ñ·Ï¿¡ Ãß°¡
¼¼°è °¡½ºÈ ½ÃÀåÀÇ 2025³â ½ÃÀå ±Ô¸ð´Â 5,845¾ï 4,000¸¸ ´Þ·¯·Î ÃßÁ¤µÇ¸ç, 2032³â¿¡´Â 8,013¾ï 6,000¸¸ ´Þ·¯¿¡ ´ÞÇÒ °ÍÀ¸·Î ¿¹»óµÇ¸ç, 2025³âºÎÅÍ 2032³â±îÁö 4.6%ÀÇ CAGRÀ» ±â·ÏÇÒ °ÍÀ¸·Î ¿¹»óµË´Ï´Ù.
º¸°í¼ ¹üÀ§
º¸°í¼ »ó¼¼ ³»¿ë
±âÁØ ¿¬µµ
2024³â
2025³â ½ÃÀå ±Ô¸ð
5,845¾ï 4,000¸¸ ´Þ·¯
½ÇÀû µ¥ÀÌÅÍ
2020-2024³â
¿¹Ãø ±â°£
2025-2032³â
¿¹Ãø ±â°£ : 2025-2032³â CAGR
4.60%
2032³â °¡Ä¡ ¿¹Ãø
8,013¾ï 6,000¸¸ ´Þ·¯
±×¸². °¡½ºÈ ½ÃÀå Á¡À¯À²(%), 2025³â, Áö¿ªº°
°¡½ºÈ´Â ¼®Åº, ¼®À¯, õ¿¬°¡½º µîÀÇ Åº¼ÒÁú ¹°ÁúÀ» ÀÏ»êÈź¼Ò¿Í ¼ö¼Ò·Î º¯È¯ÇÏ´Â °úÁ¤ÀÔ´Ï´Ù. ÀÌ ÇÕ¼º°¡½º ¶Ç´Â ÇÕ¼º°¡½º´Â ¿¬·á·Î »ç¿ëÇϰųª ÈÇÐÁ¦Ç°ÀÇ ÇÕ¼º¿¡ »ç¿ëÇÒ ¼ö ÀÖ½À´Ï´Ù. °¡½ºÈ¿¡¼´Â ź¼Ò ¿ø·á¸¦ Àú¹èÃâ °¡½º·Î ±âü ¿¬·á·Î °íÈ¿À²·Î º¯È¯ÇÒ ¼ö ÀÖ½À´Ï´Ù. ÀÌ °øÁ¤Àº ¿¡³ÊÁö »ý»êÀ» À§ÇÑ Á÷Á¢ ¿¬¼Ò¿¡ ´ëÇÑ º¸´Ù ±ú²ýÇÑ ´ë¾ÈÀ» Á¦°øÇϸç, ¹ßÀü, ÈÇÐÁ¦Ç° Á¦Á¶, ±âü ¿¬·á Á¦Á¶, ¿î¼Û µî ´Ù¾çÇÑ ¿ëµµ¿¡ Àû¿ëµÇ°í ÀÖ½À´Ï´Ù. ¾ö°ÝÇÑ ¹èÃâ ±ÔÁ¦, ¿¡³ÊÁö ¼ö¿ä Áõ°¡, ´ëü ûÁ¤¿¡³ÊÁö¿ø¿¡ ´ëÇÑ °ü½É, ģȯ°æ ±â¼úÀº ÇâÈÄ ¸î ³â µ¿¾È Àü ¼¼°èÀûÀ¸·Î °¡½ºÈÀÇ Ã¤Åà Ȯ´ë¸¦ ÃËÁøÇÒ °ÍÀ¸·Î ¿¹»óµË´Ï´Ù.
½ÃÀå ¿ªÇÐ:
ûÁ¤¿¡³ÊÁö ¼Ö·ç¼Ç¿¡ ´ëÇÑ ¼ö¿ä Áõ°¡, ¼®Åº ¿¬¼Ò ¹èÃâÀ» ¾ïÁ¦ÇÏ´Â ¾ö°ÝÇÑ È¯°æ ±ÔÁ¦, ¼®ÅºÀÇ È¿À²ÀûÀÎ À̿뿡 ´ëÇÑ °ü½É Áõ°¡ µîÀÇ ¿äÀÎÀÌ ¼¼°è °¡½ºÈ ¼ö¿ä¸¦ °ßÀÎÇÒ °ÍÀ¸·Î ¿¹»óµË´Ï´Ù. ÇÕ¼º °¡½º¸¦ ÀÌ¿ëÇÑ ¾Ï¸ð´Ï¾Æ, ¸Þź¿Ã, ÇǼŠƮ·ÎÇÁ½º ¾×üÀÇ ÇÕ¼º»Ó¸¸ ¾Æ´Ï¶ó ¼ö¼Ò Á¦Á¶¿¡µµ °¡½ºÈ ±â¼úÀÌ »ç¿ëµÇ±â ½ÃÀÛÇÏ¸é¼ ½ÃÀå ¼ºÀåÀ» ´õ¿í ÃËÁøÇϰí ÀÖ½À´Ï´Ù. ±×·¯³ª °¡½ºÈ Ç÷£Æ® ¼³Ä¡¸¦ À§ÇÑ °í°¡ÀÇ ¼³ºñ ÅõÀÚ´Â ¿©ÀüÈ÷ Áß¿äÇÑ °úÁ¦·Î ³²¾ÆÀÖ½À´Ï´Ù. ºñ¿ë Àý°¨À» À§ÇÑ Ç÷£Æ® ¼³°è¿Í °¡½ºÈ ±â¼ú ¸ðµÎ¿¡¼ Áö¼ÓÀûÀÎ ±â¼ú ¹ßÀüÀÌ ÇâÈÄ ½ÃÀå ±âȸ¸¦ ³ôÀÏ °ÍÀ¸·Î ¿¹»óµË´Ï´Ù.
º» Á¶»çÀÇ ÁÖ¿ä Æ¯Â¡
ÀÌ º¸°í¼´Â ¼¼°èÀÇ °¡½ºÈ ½ÃÀåÀ» »ó¼¼È÷ ºÐ¼®ÇÏ¿© 2024³âÀ» ±âÁØ ¿¬µµ·Î ÇÏ¿© ¿¹Ãø ±â°£(2025-2032³â)ÀÇ ½ÃÀå ±Ô¸ð¿Í ¿¬Æò±Õ ¼ºÀå·ü(CAGR)À» Á¶»çÇÏ¿© ÀüÇØµå¸³´Ï´Ù.
¶ÇÇÑ, ´Ù¾çÇÑ ºÎ¹®¿¡ °ÉÄ£ ÀáÀçÀû ¼öÀÍ ±âȸ¸¦ ÆÄ¾ÇÇϰí ÀÌ ½ÃÀåÀÇ ¸Å·ÂÀûÀÎ ÅõÀÚ Á¦¾È ¸ÅÆ®¸¯½º¸¦ ¼³¸íÇÕ´Ï´Ù.
¶ÇÇÑ ½ÃÀå ÃËÁø¿äÀÎ, ¾ïÁ¦¿äÀÎ, ±âȸ, ½ÅÁ¦Ç° Ãâ½Ã ¹× ½ÂÀÎ, ½ÃÀå µ¿Çâ, Áö¿ªº° Àü¸Á, ÁÖ¿ä ±â¾÷ÀÇ °æÀï Àü·« µî¿¡ ´ëÇÑ Áß¿äÇÑ ÀλçÀÌÆ®¸¦ Á¦°øÇÕ´Ï´Ù.
ÀÌ º¸°í¼´Â ±â¾÷ ÇÏÀ̶óÀÌÆ®, Á¦Ç° Æ÷Æ®Æú¸®¿À, ÁÖ¿ä ÇÏÀ̶óÀÌÆ®, À繫 ¼º°ú, Àü·« µîÀÇ ¸Å°³ º¯¼ö¸¦ ±â¹ÝÀ¸·Î ¼¼°è °¡½ºÈ ½ÃÀåÀÇ ÁÖ¿ä ±â¾÷À» ÇÁ·ÎÆÄÀϸµÇÕ´Ï´Ù.
º» Á¶»ç ´ë»óÀÇ ÁÖ¿ä ±â¾÷¿¡´Â Air Products and Chemicals, Inc., General Electric Company, Siemens AG, Shell Global Solutions, Linde plc, Bechtel Corporation, Mitsubishi Heavy Industries, Ltd., Thyssenkrupp AG, Synthesis Energy Systems, Inc., Nexterra Systems Corp., Bioenergy Technologies Office (DOE), KBR, Inc., TechnipFMC plc, Chemrec AB, and Gaskatel GmbH µîÀÌ ÀÖ½À´Ï´Ù.
ÀÌ º¸°í¼ÀÇ ÀλçÀÌÆ®¸¦ ÅëÇØ ¸¶ÄÉÆÃ ´ã´çÀÚ¿Í ±â¾÷ °æ¿µÁøÀº ÇâÈÄ Á¦Ç° Ãâ½Ã, À¯Çü ¾÷±×·¹À̵å, ½ÃÀå È®´ë, ¸¶ÄÉÆÃ Àü¼ú¿¡ ´ëÇÑ Á¤º¸¿¡ ÀÔ°¢ÇÑ ÀÇ»ç°áÁ¤À» ³»¸± ¼ö ÀÖ½À´Ï´Ù.
ÀÌ º¸°í¼´Â ÅõÀÚÀÚ, °ø±Þ¾÷ü, Á¦Ç° Á¦Á¶¾÷ü, À¯Åë¾÷ü, ½Å±Ô ÁøÀÔÀÚ, À繫 ºÐ¼®°¡ µî ¾÷°èÀÇ ´Ù¾çÇÑ ÀÌÇØ°ü°èÀÚ¸¦ ´ë»óÀ¸·Î ÇÕ´Ï´Ù.
ÀÌÇØ°ü°èÀÚµéÀº ¼¼°è °¡½ºÈ ½ÃÀå ºÐ¼®¿¡ »ç¿ëµÇ´Â ´Ù¾çÇÑ Àü·« ¸ÅÆ®¸¯½º¸¦ ÅëÇØ ÀÇ»ç°áÁ¤À» ½±°Ô ³»¸± ¼ö ÀÖ½À´Ï´Ù.
¸ñÂ÷
Á¦1Àå Á¶»ç ¸ñÀû°ú °¡Á¤
Á¦2Àå ½ÃÀå Àü¸Á
Á¦3Àå ½ÃÀå ¿ªÇÐ, ±ÔÁ¦, µ¿Ç⠺м®
½ÃÀå ¿ªÇÐ
¿µÇ⠺м®
ÁÖ¿ä ÇÏÀ̶óÀÌÆ®
±ÔÁ¦ ½Ã³ª¸®¿À
Á¦Ç° ¹ß¸Å/½ÂÀÎ
PEST ºÐ¼®
Porters ºÐ¼®
½ÃÀå ±âȸ
±ÔÁ¦ ½Ã³ª¸®¿À
ÁÖ¿ä ¹ßÀü
¾÷°è µ¿Çâ
Á¦4Àå ¼¼°èÀÇ °¡½ºÈ ½ÃÀå, ¿ø·áº°, 2020-2032³â
¼®Åº
¹ÙÀÌ¿À¸Å½º
õ¿¬°¡½º
Æó±â¹°
±âŸ
Á¦5Àå ¼¼°èÀÇ °¡½ºÈ ½ÃÀå, ±â¼úº°, 2020-2032³â
°íÁ¤Ãþ °¡½ºÈ±â
À¯µ¿Ãþ °¡½ºÈ±â
ºÐ·ùÃþ °¡½ºÈ±â
±âŸ
Á¦6Àå ¼¼°èÀÇ °¡½ºÈ ½ÃÀå, À¯Åë ä³Îº°, 2020-2032³â
¹ßÀü
ÈÇÐÁ¦Ç° Á¦Á¶
¿¬·á »ý»ê
±âŸ
Á¦7Àå ¼¼°èÀÇ °¡½ºÈ ½ÃÀå, Áö¿ªº°, 2020-2032³â
ºÏ¹Ì
¶óƾ¾Æ¸Þ¸®Ä«
À¯·´
¾Æ½Ã¾ÆÅÂÆò¾ç
秵¾ÆÇÁ¸®Ä«
Á¦8Àå °æÀï ±¸µµ
Air Products and Chemicals, Inc.
General Electric Company
Siemens AG
Shell Global Solutions
Linde plc
Bechtel Corporation
Mitsubishi Heavy Industries, Ltd.
Thyssenkrupp AG
Synthesis Energy Systems, Inc.
Nexterra Systems Corp.
Bioenergy Technologies Office(DOE)
KBR, Inc.
TechnipFMC plc
Chemrec AB
Gaskatel GmbH
Á¦9Àå ¾Ö³Î¸®½ºÆ®ÀÇ Ãßõ»çÇ×
Wheel of Fortune
¾Ö³Î¸®½ºÆ®ÀÇ °ßÇØ
Coherent Opportunity Map
Á¦10Àå Âü°í¹®Çå°ú Á¶»ç ¹æ¹ý
Âü°í¹®Çå
Á¶»ç ¹æ¹ý
ÃâÆÇ»ç ¼Ò°³
ksm
¿µ¹® ¸ñÂ÷
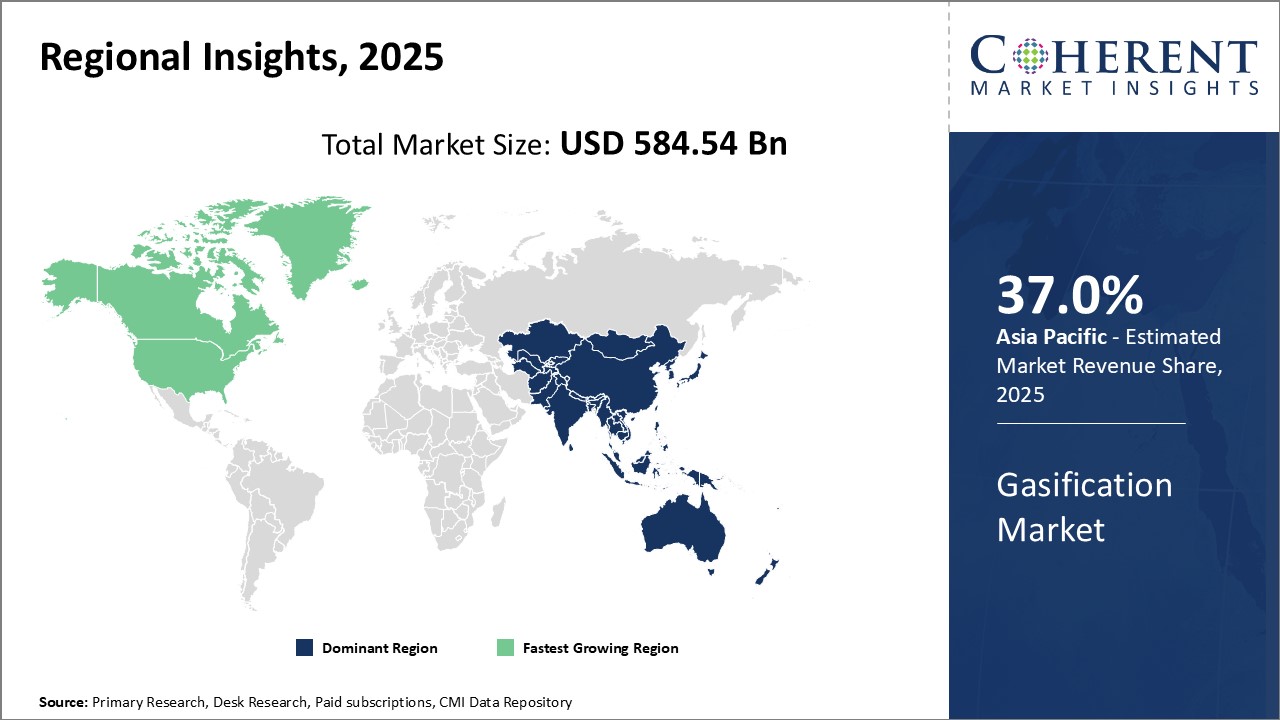
The global gasification market is estimated to be valued at USD 584.54 Bn in 2025. The market is expected to reach USD 801.36 Bn by 2032, exhibiting a compound annual growth rate (CAGR) of 4.6% from 2025 to 2032.
Report Coverage
Report Details
Base Year:
2024
Market Size in 2025:
USD 584.54 Bn
Historical Data for:
2020 To 2024
Forecast Period:
2025 To 2032
Forecast Period 2025 to 2032 CAGR:
4.60%
2032 Value Projection:
USD 801.36 Bn
Figure. Gasification Market Share (%), By Region 2025
Gasification is a process that converts carbonaceous materials like coal, petroleum, or natural gas into carbon monoxide and hydrogen. This synthesis gas or syngas can then be used as fuel or used to synthesize chemicals. Gasification allows for highly efficient conversion of carbon feedstock into gaseous fuel with low emissions. The process offers a cleaner alternative to direct combustion for energy production and has various applications in power generation, chemicals manufacturing, gaseous fuels production, and transportation. Strict emission norms, rising energy demand, focus on alternative clean sources of energy, and green technologies are expected to drive increased adoption of gasification globally in the coming years.
Market Dynamics:
Factors, such as growing need for clean energy solutions, stringent environmental regulations curbing emissions from coal combustion, and increasing focus on efficient utilization of coal, are expected to drive the demand for gasification globally. Rising use of gasification technology for hydrogen production as well as synthesis of ammonia, methanol, and Fischer-Tropsch liquids using syngas is further augmenting market growth. However, high capital investment for setting up gasification plants continues to remain a key challenge. Ongoing technological advancements in both plant design and gasification techniques aimed at reducing costs are expected to boost market opportunities going forward.
Key features of the study:
This report provides in-depth analysis of the global gasification market, and provides market size (USD Bn) and compound annual growth rate (CAGR%) for the forecast period (2025-2032), considering 2024 as the base year
It elucidates potential revenue opportunities across different segments and explains attractive investment proposition matrices for this market
This study also provides key insights about market drivers, restraints, opportunities, new product launches or approvals, market trends, regional outlook, and competitive strategies adopted by key players
It profiles key players in the global gasification market based on the following parameters - company highlights, products portfolio, key highlights, financial performance, and strategies
Key companies covered as a part of this study include Air Products and Chemicals, Inc., General Electric Company, Siemens AG, Shell Global Solutions, Linde plc, Bechtel Corporation, Mitsubishi Heavy Industries, Ltd., Thyssenkrupp AG, Synthesis Energy Systems, Inc., Nexterra Systems Corp., Bioenergy Technologies Office (DOE), KBR, Inc., TechnipFMC plc, Chemrec AB, and Gaskatel GmbH
Insights from this report would allow marketers and the management authorities of the companies to make informed decisions regarding their future product launches, type up-gradation, market expansion, and marketing tactics
The global gasification market report caters to various stakeholders in this industry including investors, suppliers, product manufacturers, distributors, new entrants, and financial analysts
Stakeholders would have ease in decision-making through various strategy matrices used in analyzing the global gasification market
Market Segmentation:
Feedstock Insights (Revenue, USD Bn, 2020 - 2032)
Coal
Biomass
Natural Gas
Waste
Others
Technology Insights (Revenue, USD Bn, 2020 - 2032)
Fixed Bed Gasifiers
Fluidized Bed Gasifiers
Entrained Flow Gasifiers
Others
Distribution Channel Insights (Revenue, USD Bn, 2020 - 2032)
Electricity Generation
Chemical Production
Fuel Production
Others
Regional Insights (Revenue, USD Bn, 2020 - 2032)
North America
U.S.
Canada
Latin America
Brazil
Argentina
Mexico
Rest of Latin America
Europe
Germany
U.K.
Spain
France
Italy
Russia
Rest of Europe
Asia Pacific
China
India
Japan
Australia
South Korea
ASEAN
Rest of Asia Pacific
Middle East
GCC Countries
Israel
Rest of Middle East
Africa
South Africa
North Africa
Central Africa
Key Players Insights
Air Products and Chemicals, Inc.
General Electric Company
Siemens AG
Shell Global Solutions
Linde plc
Bechtel Corporation
Mitsubishi Heavy Industries, Ltd.
Thyssenkrupp AG
Synthesis Energy Systems, Inc.
Nexterra Systems Corp.
Bioenergy Technologies Office (DOE)
KBR, Inc.
TechnipFMC plc
Chemrec AB
Gaskatel GmbH
Table of Contents
1. Research Objectives and Assumptions
Research Objectives
Assumptions
Abbreviations
2. Market Purview
Report Description
Market Definition and Scope
Executive Summary
Global Gasification Market, By Feedstock
Global Gasification Market, By Technology
Global Gasification Market, By Distribution Channel
Global Gasification Market, By Region
3. Market Dynamics, Regulations, and Trends Analysis
Market Dynamics
Impact Analysis
Key Highlights
Regulatory Scenario
Product Launches/Approvals
PEST Analysis
PORTER's Analysis
Market Opportunities
Regulatory Scenario
Key Developments
Industry Trend
4. Global Gasification Market, By Feedstock, 2020-2032, (USD Bn)
Introduction
Market Share Analysis, 2025 and 2032 (%)
Y-o-Y Growth Analysis, 2021 - 2032
Segment Trends
Coal
Introduction
Market Size and Forecast, and Y-o-Y Growth, 2020-2032, (USD Bn)
Biomass
Introduction
Market Size and Forecast, and Y-o-Y Growth, 2020-2032, (USD Bn)
Natural Gas
Introduction
Market Size and Forecast, and Y-o-Y Growth, 2020-2032, (USD Bn)
Waste
Introduction
Market Size and Forecast, and Y-o-Y Growth, 2020-2032, (USD Bn)
Others
Introduction
Market Size and Forecast, and Y-o-Y Growth, 2020-2032, (USD Bn)
5. Global Gasification Market, By Technology, 2020-2032, (USD Bn)
Introduction
Market Share Analysis, 2025 and 2032 (%)
Y-o-Y Growth Analysis, 2021 - 2032
Segment Trends
Fixed Bed Gasifiers
Introduction
Market Size and Forecast, and Y-o-Y Growth, 2020-2032, (USD Bn)
Fluidized Bed Gasifiers
Introduction
Market Size and Forecast, and Y-o-Y Growth, 2020-2032, (USD Bn)
Entrained Flow Gasifiers
Introduction
Market Size and Forecast, and Y-o-Y Growth, 2020-2032, (USD Bn)
Others
Introduction
Market Size and Forecast, and Y-o-Y Growth, 2020-2032, (USD Bn)
6. Global Gasification Market, By Distribution Channel, 2020-2032, (USD Bn)
Introduction
Market Share Analysis, 2025 and 2032 (%)
Y-o-Y Growth Analysis, 2021 - 2032
Segment Trends
Electricity Generation
Introduction
Market Size and Forecast, and Y-o-Y Growth, 2020-2032, (USD Bn)
Chemical Production
Introduction
Market Size and Forecast, and Y-o-Y Growth, 2020-2032, (USD Bn)
Fuel Production
Introduction
Market Size and Forecast, and Y-o-Y Growth, 2020-2032, (USD Bn)
Others
Introduction
Market Size and Forecast, and Y-o-Y Growth, 2020-2032, (USD Bn)
7. Global Gasification Market, By Region, 2020 - 2032, Value (USD Bn)
Introduction
Market Share (%) Analysis, 2025, 2028 & 2032, Value (USD Bn)
Market Y-o-Y Growth Analysis (%), 2021 - 2032, Value (USD Bn)
Regional Trends
North America
Introduction
Market Size and Forecast, By Feedstock, 2020 - 2032, Value (USD Bn)
Market Size and Forecast, By Technology, 2020 - 2032, Value (USD Bn)
Market Size and Forecast, By Distribution Channel, 2020 - 2032, Value (USD Bn)
Market Size and Forecast, By Country, 2020 - 2032, Value (USD Bn)
U.S.
Canada
Latin America
Introduction
Market Size and Forecast, By Feedstock, 2020 - 2032, Value (USD Bn)
Market Size and Forecast, By Technology, 2020 - 2032, Value (USD Bn)
Market Size and Forecast, By Distribution Channel, 2020 - 2032, Value (USD Bn)
Market Size and Forecast, By Country, 2020 - 2032, Value (USD Bn)
Brazil
Argentina
Mexico
Rest of Latin America
Europe
Introduction
Market Size and Forecast, By Feedstock, 2020 - 2032, Value (USD Bn)
Market Size and Forecast, By Technology, 2020 - 2032, Value (USD Bn)
Market Size and Forecast, By Distribution Channel, 2020 - 2032, Value (USD Bn)
Market Size and Forecast, By Country, 2020 - 2032, Value (USD Bn)
Germany
U.K.
Spain
France
Italy
Russia
Rest of Europe
Asia Pacific
Introduction
Market Size and Forecast, By Feedstock, 2020 - 2032, Value (USD Bn)
Market Size and Forecast, By Technology, 2020 - 2032, Value (USD Bn)
Market Size and Forecast, By Distribution Channel, 2020 - 2032, Value (USD Bn)
Market Size and Forecast, By Country, 2020 - 2032, Value (USD Bn)
China
India
Japan
Australia
South Korea
ASEAN
Rest of Asia Pacific
Middle East
Introduction
Market Size and Forecast, By Feedstock, 2020 - 2032, Value (USD Bn)
Market Size and Forecast, By Technology, 2020 - 2032, Value (USD Bn)
Market Size and Forecast, By Distribution Channel, 2020 - 2032, Value (USD Bn)
Market Size and Forecast, By Country, 2020 - 2032, Value (USD Bn)
GCC Countries
Israel
Rest of Middle East
Africa
Introduction
Market Size and Forecast, By Feedstock, 2020 - 2032, Value (USD Bn)
Market Size and Forecast, By Technology, 2020 - 2032, Value (USD Bn)
Market Size and Forecast, By Distribution Channel, 2020 - 2032, Value (USD Bn)
Market Size and Forecast, By Country/Region, 2020 - 2032, Value (USD Bn)
South Africa
North Africa
Central Africa
8. Competitive Landscape
Air Products and Chemicals, Inc.
Company Highlights
Product Portfolio
Key Developments
Financial Performance
Strategies
General Electric Company
Company Highlights
Product Portfolio
Key Developments
Financial Performance
Strategies
Siemens AG
Company Highlights
Product Portfolio
Key Developments
Financial Performance
Strategies
Shell Global Solutions
Company Highlights
Product Portfolio
Key Developments
Financial Performance
Strategies
Linde plc
Company Highlights
Product Portfolio
Key Developments
Financial Performance
Strategies
Bechtel Corporation
Company Highlights
Product Portfolio
Key Developments
Financial Performance
Strategies
Mitsubishi Heavy Industries, Ltd.
Company Highlights
Product Portfolio
Key Developments
Financial Performance
Strategies
Thyssenkrupp AG
Company Highlights
Product Portfolio
Key Developments
Financial Performance
Strategies
Synthesis Energy Systems, Inc.
Company Highlights
Product Portfolio
Key Developments
Financial Performance
Strategies
Nexterra Systems Corp.
Company Highlights
Product Portfolio
Key Developments
Financial Performance
Strategies
Bioenergy Technologies Office (DOE)
Company Highlights
Product Portfolio
Key Developments
Financial Performance
Strategies
KBR, Inc.
Company Highlights
Product Portfolio
Key Developments
Financial Performance
Strategies
TechnipFMC plc
Company Highlights
Product Portfolio
Key Developments
Financial Performance
Strategies
Chemrec AB
Company Highlights
Product Portfolio
Key Developments
Financial Performance
Strategies
Gaskatel GmbH
Company Highlights
Product Portfolio
Key Developments
Financial Performance
Strategies
9. Analyst Recommendations
Wheel of Fortune
Analyst View
Coherent Opportunity Map
10. References and Research Methodology
References
Research Methodology
About us
°ü·ÃÀÚ·á