Physical Vapor Deposition Market, By Type, By Application, By Geography
상품코드:1671966
리서치사:Coherent Market Insights
발행일:2025년 02월
페이지 정보:영문
라이선스 & 가격 (부가세 별도)
ㅁ Add-on 가능: 고객의 요청에 따라 일정한 범위 내에서 Customization이 가능합니다. 자세한 사항은 문의해 주시기 바랍니다.
한글목차
세계의 PVD(물리 기상 증착) 시장은 2025년에 255억 8,000만 달러로 추정되며, 2032년에는 395억 2,000만 달러에 달할 것으로 예측되며, 2025-2032년 CAGR은 6.4%로 성장할 전망입니다.
리포트 범위
리포트 상세
기준연도
2024
2025년 시장 규모
255억 8,000만 달러
실적 데이터
2020-2024년
예측 기간
2025-2032년
예측 기간 : 2025-2032년 CAGR :
6.40%
2032년 가치 예측
395억 2,000만 달러
도표. PVD(물리 기상 증착) 시장 점유율(%), 2025년 지역별
PVD(물리 기상 증착)는 박막 및 코팅 제조에 사용되는 진공 증착 공정으로, 진공 챔버 내의 고체 표면에서 원하는 박막 재료를 기화시켜 응축하는 방식으로, 박막 조성, 두께, 균일성을 정밀하게 제어할 수 있으며, 마이크로 전자, 데이터 저장, 포장, 태양전지/신재생에너지 용도에 널리 사용되고 있습니다. 포장, 태양전지/재생에너지 용도의 박막성막에 일반적으로 채택되고 있습니다. 향후 이러한 최종 사용 산업에서 수요 증가는 예측 기간 중 PVD(물리적 기상 성장) 시장의 성장을 가속할 것으로 예상됩니다.
시장 역학:.
PVD(물리적 기상증착) 시장은 여러 요인에 의해 강력한 성장세를 보이고 있습니다. 태양광, 건축, 자동차 등 다양한 산업 분야의 광학 코팅에 대한 수요 증가가 시장을 주도하고 있으며, PVD 코팅 부품이 필요한 가전제품의 세계 판매 증가도 주요 촉진요인입니다. 그러나 장비 비용과 복잡한 제조 공정에 대한 문제가 시장의 광범위한 보급을 방해하고 있습니다. 한편, 더 높은 처리량과 막의 균일성을 가능하게 하는 첨단 PVD 기술의 혁신은 새로운 기회를 제공합니다. 또한 반도체 및 마이크로 일렉트로닉스 산업의 소형화 추세는 중요한 성장 경로를 보여주고 있습니다.
본 조사의 주요 특징
세계의 PVD(물리적 기상 성장) 시장을 상세하게 분석하여 2024년을 기준 연도로 하여 예측 기간(2025-2032년) 시장 규모와 연평균 성장률(CAGR%)을 조사하여 전해드립니다.
또한 다양한 부문에 걸친 잠재적 매출 기회를 밝히고, 이 시장의 매력적인 투자 제안 매트릭스를 설명합니다.
또한 시장 성장 촉진요인, 억제요인, 기회, 신제품 출시 및 승인, 시장 동향, 지역별 전망, 주요 기업의 경쟁 전략 등에 대한 중요한 인사이트를 제공합니다.
이 보고서는 기업 하이라이트, 제품 포트폴리오, 주요 하이라이트, 재무 성과, 전략 등의 매개 변수를 기반으로 세계 PVD(물리적 기상 성장) 시장의 주요 업체를 프로파일링합니다.
이 보고서의 인사이트를 통해 마케팅 담당자와 기업 경영진은 향후 제품 출시, 유형 업그레이드, 시장 확대, 마케팅 전술에 대한 정보에 입각한 의사결정을 내릴 수 있습니다.
이 보고서는 투자자, 공급업체, 제품 제조업체, 유통업체, 신규 시장 진출기업, 재무 분석가 등 업계의 다양한 이해관계자를 대상으로 합니다.
목차
제1장 조사의 목적과 전제조건
조사 목적
전제조건
약어
제2장 시장 전망
리포트 설명
시장의 정의와 범위
개요
Coherent Opportunity Map(COM)
제3장 시장 역학, 규제, 동향 분석
시장 역학
촉진요인
억제요인
PEST 분석
PORTER Five Forces 분석
시장 기회
규제 시나리오
주요 발전
제품 유형의 동향
제4장 세계의 PVD(물리 기상 증착) 시장 - 코로나바이러스(COVID-19) 팬데믹의 영향
세계의 PVD(물리 기상 증착) 시장에 영향을 미치는 요인-COVID-19
영향 분석
제5장 세계의 PVD(물리 기상 증착) 시장, 유형별, 2020-2032년
열증발
스퍼터 증착
아크 증착
제6장 세계의 PVD(물리 기상 증착) 시장, 용도별, 2020-2032년
마이크로일렉트로닉스
스토리지
솔라
의료장비
절삭 공구
기타
제7장 세계의 PVD(물리 기상 증착) 시장, 지역별, 2020-2032년
북미
라틴아메리카
유럽
아시아태평양
중동 및 아프리카
걸프협력회의
남아프리카공화국
북아프리카
기타 중동 및 아프리카
제8장 경쟁 구도
히트맵 분석
시장 점유율 분석(3x3 매트릭스)
기업 개요
Oerlikon Balzers(Oerlikon Group)
IHI Corporation
Silfex Inc.
Lam Research Corp
Singulus Technologies AG
Applied Materials, Inc.
ULVAC Inc.
Veeco Instruments Inc.
Buhler AG
Semicore Equipment, Inc.
Platit AG.
Intevac, Inc.
Denton Vacuum
Impact Coatings AB
Advanced Coating Service
KOLZER SRL
Inorcoat
Lafer SpA
Kobe Steel Ltd.
HEF Groupe
제9장 애널리스트의 권장사항
제10장 섹션
참고 문헌
조사 방법
KSA
영문 목차
영문목차
Global Physical Vapor Deposition Market is estimated to be valued at USD 25.58 Bn in 2025 and is expected to reach USD 39.52 Bn by 2032, growing at a compound annual growth rate (CAGR) of 6.4% from 2025 to 2032.
Report Coverage
Report Details
Base Year:
2024
Market Size in 2025:
USD 25.58 Bn
Historical Data for:
2020 To 2024
Forecast Period:
2025 To 2032
Forecast Period 2025 to 2032 CAGR:
6.40%
2032 Value Projection:
USD 39.52 Bn
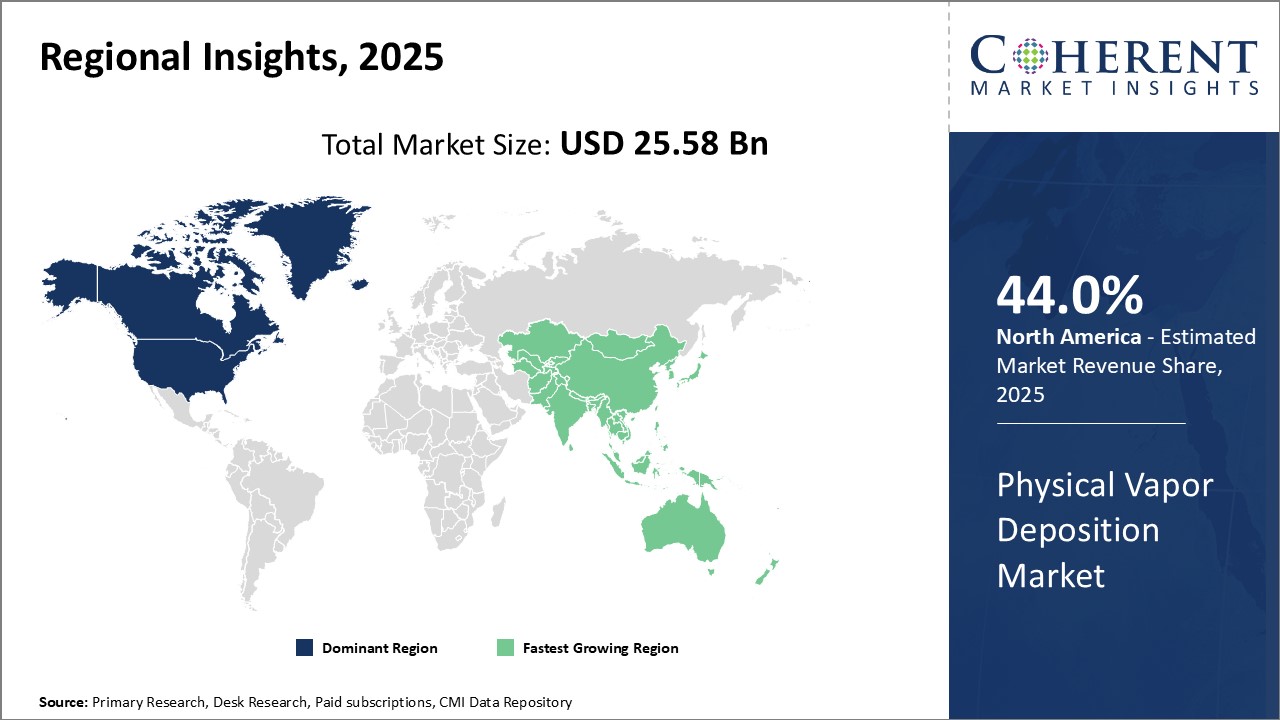
Figure. Physical Vapor Deposition Market Share (%), By Region 2025
Physical vapor deposition (PVD) is a vacuum deposition process used to produce thin films and coatings. It relies on the condensation of a vaporized form of the desired film material onto a solid surface within a vacuum chamber. PVD methods are commonly employed for thin film deposition in microelectronics, data storage, and packaging and solar/renewable energy applications due to their ability to precisely control film composition, thickness, and uniformity. Going forward, rising demand from these end use industries is expected to drive the physical vapor deposition market growth over the forecast period.
Market Dynamics:
The physical vapor deposition market is witnessing strong growth driven by several factors. Growing demand for optical coatings from various industry verticals such as solar, architectural and automotive is propelling the market. Increasing worldwide sales of consumer electronics that require PVD coated components is another major driver. However, issues regarding equipment costs and complex manufacturing processes have been restricting broader market adoption. On the upside, innovations towards advanced PVD techniques that allow higher throughput and film uniformity are opening new opportunities. Miniaturization trends in semiconductor and microelectronics industries also present a key growth avenue.
Key Features of the Study:
This report provides an in-depth analysis of the global physical vapor deposition market, and provides market size (US$ Bn) and compound annual growth rate (CAGR%) for the forecast period (2025-2032), considering 2024 as the base year
It elucidates potential revenue opportunities across different segments and explains attractive investment proposition matrices for this market
This study also provides key insights about market drivers, restraints, opportunities, new product launches or approval, market trends, regional outlook, and competitive strategies adopted by key players
It profiles key players in the global physical vapor deposition market based on the following parameters - company highlights, products portfolio, key highlights, financial performance, and strategies
Key companies covered as a part of this study include Oerlikon Balzers (Oerlikon Group), IHI Corporation, Silfex Inc., Lam Research Corp, Singulus Technologies AG, Applied Materials, Inc., ULVAC Inc., Veeco Instruments Inc., Buhler AG, Semicore Equipment, Inc., Platit AG., Intevac, Inc., Denton Vacuum, Impact Coatings AB, Advanced Coating Service, KOLZER SRL, Inorcoat, Lafer S.p.A., Kobe Steel Ltd., and HEF Groupe
Insights from this report would allow marketers and the management authorities of the companies to make informed decisions regarding their future product launches, type up-gradation, market expansion, and marketing tactics
The global physical vapor deposition market report caters to various stakeholders in this industry including investors, suppliers, product manufacturers, distributors, new entrants, and financial analysts
Market Segmentation
By Type:
Thermal Evaporation
Sputter Deposition
Arc Vapor Deposition
By Application:
Microelectronics
Storage
Solar
Medical Equipment
Cutting Tools
Others
By Regional:
North America
Europe
Asia Pacific
Latin America
Middle East & Africa
Company Profiles:
Oerlikon Balzers (Oerlikon Group)
IHI Corporation
Silfex Inc.
Lam Research Corp
Singulus Technologies AG
Applied Materials, Inc.
ULVAC Inc.
Veeco Instruments Inc.
Buhler AG
Semicore Equipment, Inc.
Platit AG.
Intevac, Inc.
Denton Vacuum
Impact Coatings AB
Advanced Coating Service
KOLZER SRL
Inorcoat
Lafer S.p.A.
Kobe Steel Ltd.
HEF Groupe
Table of Contents
1. Research Objectives and Assumptions
Research Objectives
Assumptions
Abbreviations
2. Market Purview
Report Description
Market Definition and Scope
Executive Summary
Market Snippet, By Type
Market Snippet, By Application
Market Snippet, By Region
Coherent Opportunity Map (COM)
3. Market Dynamics, Regulations, and Trends Analysis
Market Dynamics
Drivers
Restraints
PEST Analysis
PORTER's Five Forces Analysis
Market Opportunities
Regulatory Scenario
Key Developments
Product Type Trend
4. Global Physical Vapor Deposition Market - Impact of Coronavirus (COVID-19) Pandemic
Overview
Factors Affecting Global Physical Vapor Deposition Market - COVID-19
Impact Analysis
5. Global Physical Vapor Deposition Market, By Type, 2020-2032 (US$ Bn)
Introduction
Market Share Analysis, 2025, 2028, and 2032 (%)
Y-o-Y Growth Analysis, 2021 - 2032
Segment Trends
Thermal Evaporation
Introduction
Market Size and Forecast, and Y-o-Y Growth, 2021 - 2032, (US$ Bn)
Sputter Deposition
Introduction
Market Size and Forecast, and Y-o-Y Growth, 2021 - 2032, (US$ Bn)
Arc Vapor Deposition
Introduction
Market Size and Forecast, and Y-o-Y Growth, 2021 - 2032, (US$ Bn)
6. Global Physical Vapor Deposition Market, By Application, 2020-2032 (US$ Bn)
Introduction
Market Share Analysis, 2025, 2028, and 2032 (%)
Y-o-Y Growth Analysis, 2021 - 2032
Segment Trends
Microelectronics
Introduction
Market Size and Forecast, and Y-o-Y Growth, 2021 - 2032, (US$ Bn)
Storage
Introduction
Market Size and Forecast, and Y-o-Y Growth, 2021 - 2032, (US$ Bn)
Solar
Introduction
Market Size and Forecast, and Y-o-Y Growth, 2021 - 2032, (US$ Bn)
Medical Equipment
Introduction
Market Size and Forecast, and Y-o-Y Growth, 2021 - 2032, (US$ Bn)
Cutting Tools
Introduction
Market Size and Forecast, and Y-o-Y Growth, 2021 - 2032, (US$ Bn)
Others
Introduction
Market Size and Forecast, and Y-o-Y Growth, 2021 - 2032, (US$ Bn)
7. Global Physical Vapor Deposition Market, By Region, 2020-2032 (US$ Bn)
Introduction
Market Share Analysis, By Region, 2025, 2028, and 2032 (%)
Y-o-Y Growth Analysis, For Region, 2020 - 2032
North America
Market Share Analysis, By Country, 2025, 2028, and 2032 (%)
Y-o-Y Growth Analysis, By Country, 2020 - 2032
Market Size and Forecast, By Type , 2020- 2032 (US$ Bn)
Market Size and Forecast, By Application, 2020- 2032 (US$ Bn)
Countries
U.S.
Canada
Latin America
Market Share Analysis, By Country, 2025, 2028, and 2032 (%)
Y-o-Y Growth Analysis, By Country, 2020 - 2032
Market Size and Forecast, By Type, 2020- 2032 (US$ Bn)
Market Size and Forecast, By Application, 2020- 2032 (US$ Bn)
Countries
Brazil
Mexico
Rest of Latin America
Europe
Market Share Analysis, By Country, 2025, 2028, and 2032 (%)
Y-o-Y Growth Analysis, By Country, 2020 - 2032
Market Size and Forecast, By Type , 2020- 2032 (US$ Bn)
Market Size and Forecast, By Application, 2020- 2032 (US$ Bn)
Countries
France
Germany
Italy
Spain
U.K.
Nordic
Benelux
Russia
Poland
Asia Pacific
Market Share Analysis, By Country, 2025, 2028, and 2032 (%)
Y-o-Y Growth Analysis, By Country, 2020 - 2032
Market Size and Forecast, By Type , 2020- 2032 (US$ Bn)
Market Size and Forecast, By Application, 2020- 2032 (US$ Bn)
Countries
China
India
South Korea
ASEAN
Japan
Rest of Asia Pacific
Middle East & Africa
Market Share Analysis, By Region/Country, 2025, 2028, and 2032 (%)
Y-o-Y Growth Analysis, By Region/Country, 2020 - 2032
Market Size and Forecast, By Type , 2020- 2032 (US$ Bn)
Market Size and Forecast, By Application, 2020- 2032 (US$ Bn)