그래핀 시장(-2035년) : 제품 유형별, 생산 방법별, 형태별, 품질별, 용도별, 유통 채널별, 최종사용자별, 지역별 - 업계 동향과 세계 예측
Graphene Market, Till 2035: Distribution by Type of Product, Type of Production Method, Type of Form, Type of Quality, Type of Application, Type of Distribution Channel, Type of End-User and Geographical Regions: Industry Trends and Global Forecasts
상품코드:1857188
리서치사:Roots Analysis
발행일:On Demand Report
페이지 정보:영문 154 Pages
라이선스 & 가격 (부가세 별도)
한글목차
그래핀 시장 개요
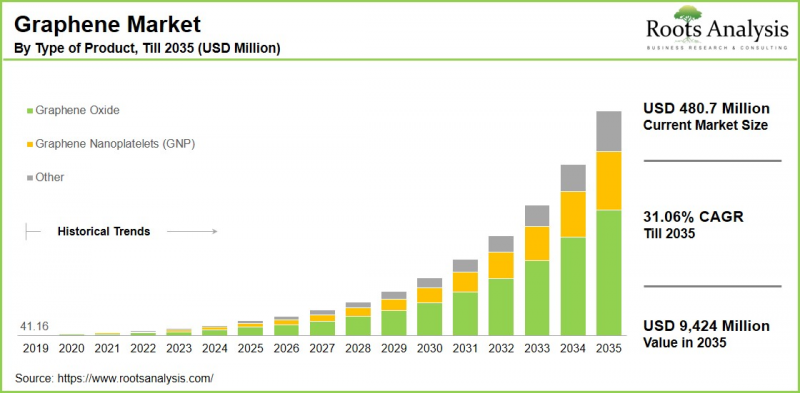
세계 그래핀 시장 규모는 현재 4억 8,070만 달러에서 2035년까지 94억 2,400만 달러에 달할 것으로 예상되며, 2035년까지 예측 기간 동안 CAGR 31.06%를 보일 것으로 예측됩니다.
그래핀 시장의 기회는 다음과 같은 부문에 분산되어 있습니다.
제품 유형
산화 그래핀
그래핀 나노플레이트(GNP)
기타
제품 유형
화학증착법
박리
산화 그래핀의 환원
기타
모양
분산
영화
분말
기타
품질 유형
산업용 등급
연구 등급
기타
용도
촉매제
복합재료
전자 부품
에너지 저장
페인트 및 코팅
타이어
유통 채널
직접 판매
유통업체
온라인 소매업체
기타
최종 사용자
항공우주 및 방위 산업
자동차
전자제품
에너지
기타
지역
북미
미국
캐나다
멕시코
기타 북미 국가
유럽
오스트리아
벨기에
덴마크
프랑스
독일
아일랜드
이탈리아
네덜란드
노르웨이
러시아
스페인
스웨덴
스위스
영국
기타 유럽 국가
아시아
중국
인도
일본
싱가포르
한국
기타 아시아 국가
라틴아메리카
브라질
칠레
콜롬비아
베네수엘라
기타 라틴아메리카 국가
중동 및 북아프리카
이집트
이란
이라크
이스라엘
쿠웨이트
사우디아라비아
아랍에미리트(UAE)
기타 MENA 국가
세계 기타 지역
호주
뉴질랜드
기타 국가
그래핀 시장 성장 및 동향
그래핀은 경량 구조와 고효율로 집적회로의 개발 등 다양한 산업의 기술 발전에 매우 중요한 역할을 하고 있습니다. 뛰어난 전도성, 투명성, 유연성, 가벼움, 우수한 저항성 등 독특한 특성으로 인해 그래핀은 매우 다재다능한 소재가 되었습니다. 흑연에서 유래한 그래핀은 탄소 원자의 단층으로 구성되어 있으며, 두께가 원자 1개에 불과해 알려진 물질 중 가장 얇다. 이러한 특성으로 인해 생명공학, 헬스케어, 건축, 그래핀 기반 전자제품에 이르기까지 다양한 분야에 적용이 가능합니다.
놀랍게도 그래핀은 강철보다 약 200배 더 강하고 구리보다 더 효과적으로 전기와 열을 전달합니다. 단층 시트, 이중층 그래핀, 터보 스트라틱 그래핀 등 다양한 형태의 그래핀은 뚜렷한 특성과 특수한 용도로 평가받고 있습니다.
그래핀 시장은 지속적인 기술 혁신과 기술 혁신으로 빠르게 발전하고 있습니다. 또한, 수소 저장 및 그래핀 기반 온도 센서 개발과 같은 분야의 발전도 시장 성장에 기여하고 있습니다. 결과적으로, 위의 요인으로 인해 그래핀 시장은 예측 기간 동안 크게 성장할 것으로 예측됩니다.
그래핀 시장 주요 부문
제품 유형별 시장 점유율
그래핀 세계 시장은 제품 유형별로 그래핀 산화물, 그래핀 나노 플레이트(GNP), 기타로 분류됩니다. 당사의 추정에 따르면, 현재 그래핀 산화물 부문이 시장 점유율의 대부분을 차지하고 있습니다. 이는 그래핀 전자제품 시장, 자동차 산업 등 다양한 분야에서 수요가 많기 때문입니다. 또한, 대규모 생산의 가능성은 산화 그래핀 시장을 더욱 발전시킬 것으로 기대되고 있습니다.
제품 유형별 시장 점유율
생산 방식에 따라 세계 그래핀 시장은 화학 기상 성장, 박리, 산화 그래핀 환원, 기타로 구분됩니다. 당사의 추정에 따르면, 현재 화학 기상 성장법은 대면적에서 고품질 그래핀을 생산할 수 있기 때문에 시장 점유율의 대부분을 차지하고 있습니다. 또한, 다양한 산업, 특히 전자 분야에서의 적용 확대는 장기적인 성장을 가속할 것으로 예측됩니다.
형태별 시장 점유율
세계 그래핀 시장은 형태에 따라 분산, 필름, 분말, 기타로 분류됩니다. 당사의 추정에 따르면, 현재 시장 점유율의 대부분을 차지하는 것은 분말입니다. 이는 주로 그 특징적인 특성, 우수한 성능, 헬스케어 및 자동차 등 다양한 산업과의 적합성 때문입니다.
품질 유형별 시장 점유율
세계 그래핀 시장은 품질 유형에 따라 산업 등급, 연구 등급, 기타로 분류됩니다. 우리 회사의 추정에 따르면, 현재 시장 점유율의 대부분을 차지하는 것은 산업용 등급입니다. 이는 그래핀이 여러 산업 및 응용 분야에서 널리 사용되고 있기 때문입니다. 반면, 조사 등급 부문은 이 예측 기간 동안 더 높은 CAGR을 보일 것으로 예측됩니다.
용도별 시장 점유율
세계 그래핀 시장은 용도별로 촉매, 복합재료, 전자부품, 전자부품, 에너지 저장, 페인트 및 코팅, 타이어로 구분됩니다. 당사의 추정에 따르면, 현재 전자 솔루션에 대한 수요 증가로 인해 전자 부품이 시장 점유율의 대부분을 차지하고 있습니다. 한편, 에너지 저장 분야는 그래핀 배터리 시장 확대로 인해 예측 기간 동안 더 높은 CAGR을 나타낼 것으로 예측됩니다.
유통채널별 시장 점유율
세계 그래핀 시장은 유통 채널 유형에 따라 직접 판매, 유통업체, 유통업체, 온라인 소매업체, 기타로 분류됩니다. 당사의 추정에 따르면, 현재 시장 점유율의 대부분을 차지하는 것은 직접 판임베디드니다. 이러한 성장의 배경에는 비용 효율성, 고객과의 직접적 관계, 전자상거래의 부상 등의 요인이 있습니다.
최종 사용자별 시장 점유율
세계 그래핀 시장은 최종 사용자 유형에 따라 항공우주 및 방위, 자동차, 전자, 에너지, 기타로 분류됩니다. 당사의 추정에 따르면, 현재 자동차 분야가 시장 점유율의 대부분을 차지하고 있습니다. 이는 주로 구조 부품, 그래핀 배터리, 타이어 등 자동차 응용 분야에서 그래핀의 활용이 확대되고 있기 때문입니다.
반면, 전자 분야는 우수한 전기 전도성, 소비자 인식 제고, R&D 자금 증가 등으로 인해 예측 기간 동안 상대적으로 높은 CAGR을 나타낼 것으로 예측됩니다.
지역별 시장 점유율
그래핀 시장은 지역별로 북미, 유럽, 아시아, 아시아, 라틴아메리카, 중동 및 아프리카, 기타 지역으로 구분됩니다. 당사의 추정에 따르면, 현재 아시아가 시장 점유율의 대부분을 차지하고 있습니다. 이는 산업화의 진전, 중국 및 인도와 같은 국가의 견조한 자동차 수요, 빠른 경제 성장으로 인해 이 지역 시장이 성장하고 있기 때문입니다.
그래핀 시장 진출기업 사례
ACS Material
Applied Graphene Materials
BGT Materials
CVD Equipment
Directa Plus
G6 Materials
Grafoid
Graphene NanoChem
Graphenea
Haydale Graphene Industries
JCNANO Tech
Morsh
NanoXplore
NeoGraf
Ningbo Morsh Technology
Talga
Thomas Swan
Vorbeck Materials
XG Sciences
Xiamen Knano Graphene Technology
그래핀 시장 조사 대상
그래핀 시장 조사 보고서에는 다음과 같은 다양한 섹션에 대한 고찰이 포함되어 있습니다.
시장 규모 및 기회 분석 :(A) 제품 유형,(B) 제조 방법 유형,(C) 형태 유형,(D) 품질 유형,(E) 용도 유형,(F) 유통 채널 유형,(G) 최종 사용자 유형,(H) 지역별 등 주요 시장 부문에 초점을 맞춘 그래핀 시장의 상세 분석.
경쟁 구도:(A) 설립 연도,(B) 기업 규모,(C) 본사 소재지,(D) 소유 구조 등 관련 매개 변수를 기반으로 그래핀 시장에 종사하는 기업을 종합적으로 분석.
기업 프로파일:(A)본사 소재지,(B)기업 규모,(C)기업 사명,(D)기업 발자취,(E)경영진,(F)연락처,(G)재무정보,(H)사업부문,(i)그래핀 포트폴리오,(J)해자 분석,(K)최근 동향, 미래 전망 등 그래핀 시장에 관련 유명 기업들의 상세한 프로파일을 수록하였습니다.
SWOT 분석 : 통찰력 있는 SWOT 프레임워크를 통해 해당 영역의 강점, 약점, 기회, 위협을 강조합니다. 또한, 각 SWOT 파라미터의 상대적 영향을 강조한 하비볼 분석을 제공합니다.
가치사슬 분석 : 가치사슬을 종합적으로 분석하여 그래핀 시장에 관련된 다양한 단계와 이해관계자에 대한 정보를 제공합니다.
목차
제1장 서문
제2장 조사 방법
제3장 경제적 및 기타 프로젝트 특유의 고려사항
제4장 거시경제 지표
제5장 주요 요약
제6장 서론
본 장의 개요
그래핀 시장 개요
제품 유형
용도
최종사용자
향후 전망
제7장 경쟁 구도
본 장의 개요
그래핀 : 시장 구도
제8장 기업 개요
본 장의 개요
ACS Material
Applied Graphene Materials
BGT Materials
CVD Equipment
Directa Plus
G6 Materials
Grafoid
Graphene NanoChem
Graphenea
Haydale Graphene Industries
JCNANO Tech
Morsh
NanoXplore
NeoGraf
Ningbo Morsh Technology
Talga
Thomas Swan
Vorbeck Materials
XG Sciences
Xiamen Knano Graphene Technology
제9장 밸류체인 분석
제10장 SWOT 분석
제11장 세계의 그래핀 시장
본 장의 개요
주요 전제와 조사 방법
시장에 영향을 미치는 동향 혼란
세계의 그래핀 시장, 과거 동향(2019년 이후) 및 예측 추정(2035년까지)
다변량 시나리오 분석
주요 시장 세분화
제12장 제품 유형별 시장 기회
제13장 생산 방법 유형별 시장 기회
제14장 형태별 시장 기회
제15장 품질 유형별 시장 기회
제16장 용도별 시장 기회
제17장 유통 채널별 시장 기회
제18장 최종사용자 유형별 시장 기회
제19장 북미의 그래핀 시장 기회
제20장 유럽의 그래핀 시장 기회
제21장 아시아의 그래핀 시장 기회
제22장 중동 및 북아프리카(MENA)의 그래핀 시장 기회
제23장 라틴아메리카의 그래핀 시장 기회
제24장 기타 지역의 그래핀 시장 기회
제25장 표 형식 데이터
제26장 기업 및 단체 리스트
제27장 커스터마이즈 기회
제28장 ROOT 구독 서비스
제29장 저자 상세
LSH
영문 목차
영문목차
Graphene Market Overview
As per Roots Analysis, the global graphene market size is estimated to grow from USD 480.7 million in the current year to USD 9,424 million by 2035, at a CAGR of 31.06% during the forecast period, till 2035.
The opportunity for graphene market has been distributed across the following segments:
Type of Product
Graphene Oxide
Graphene Nanoplatelets (GNP)
Others
Type of Production Method
Chemical Vapor Deposition
Exfoliation
Reduction of Graphene Oxide
Others
Type of Form
Dispersion
Film
Powder
Others
Type of Quality
Industrial Grade
Research Grade
Others
Type of Application
Catalyst
Composites
Electronic Component
Energy Storage
Paint & Coating
Tires
Type of Distribution Channel
Direct Sales
Distributors
Online Retailers
Others
Type of End-User
Aerospace & Defense
Automotive
Electronics
Energy
Others
Geographical Regions
North America
US
Canada
Mexico
Other North American countries
Europe
Austria
Belgium
Denmark
France
Germany
Ireland
Italy
Netherlands
Norway
Russia
Spain
Sweden
Switzerland
UK
Other European countries
Asia
China
India
Japan
Singapore
South Korea
Other Asian countries
Latin America
Brazil
Chile
Colombia
Venezuela
Other Latin American countries
Middle East and North Africa
Egypt
Iran
Iraq
Israel
Kuwait
Saudi Arabia
UAE
Other MENA countries
Rest of the World
Australia
New Zealand
Other countries
Graphene Market: Growth and Trends
Graphene plays a pivotal role in advancing technology across multiple industries, including the development of integrated circuits, where its lightweight structure and high efficiency offer significant benefits. Its unique properties, such as exceptional electrical conductivity, transparency, flexibility, lightness, and outstanding resistance, make it a highly versatile material. Derived from graphite, graphene is composed of a single layer of carbon atoms, making it the thinnest known material at just one atom thick. These characteristics enable its wide application in fields ranging from biological engineering and healthcare to construction and graphene-based electronics.
Remarkably, graphene is about 200 times stronger than steel and conducts electricity and heat more effectively than copper. Different forms of graphene, including monolayer sheets, bilayer graphene, and turbostratic graphene, are valued for their distinct properties and specialized applications.
The graphene market is evolving rapidly, fueled by ongoing innovation and technological breakthroughs. Additionally, advancements in areas such as hydrogen storage and the development of graphene-based temperature sensors is contributing to the its growth. As a result, owing to the above mentioned factors, the graphene market is expected to grow significantly during the forecast period.
Graphene Market: Key Segments
Market Share by Type of Product
Based on type of product, the global graphene market is segmented into graphene oxide, graphene nanoplatelets (GNP) and others. According to our estimates, currently, the graphene oxide segment captures the majority of the market share. This can be attributed to significant demand from various sectors, such as the graphene electronics market and the automotive industry. Additionally, the potential for large-scale production is expected to further advance the graphene oxide market.
Market Share by Type of Production Method
Based on type of production method, the global graphene market is segmented into chemical vapor deposition, exfoliation, reduction of graphene oxide and others. According to our estimates, currently, the chemical vapor deposition segment captures the majority of the market share, due to its capability to manufacture large-area, high-quality graphene. Additionally, increasing applications across various industries, particularly in electronics, are anticipated to propel its long-term growth.
Market Share by Type of Form
Based on type of form, the global graphene market is segmented into dispersion, film, powder and others. According to our estimates, currently, the powder segment captures the majority of the market share. This is primarily due to its distinctive characteristics, superior performance, and compatibility with various industries such as healthcare and automotive.
Market Share by Type of Quality
Based on type of quality, the global graphene market is segmented into industrial grade, research grade and others. According to our estimates, currently, the industrial grade segment captures the majority of the market share. This is due to the widespread use of graphene across multiple industries and applications. Meanwhile, the research grade segment is expected to experience a higher compound annual growth rate (CAGR) during this forecast period.
Market Share by Type of Application
Based on type of application, the global graphene market is segmented into catalyst, composites, electronic component, energy storage, paint & coating and tires. According to our estimates, currently, the electronic component captures the majority of the market share, owing to the growing demand for electronic solutions. Meanwhile, the energy storage segment is expected to experience a higher compound annual growth rate (CAGR) during this forecast period, due to the rising market for graphene batteries.
Market Share by Type of Distribution Channel
Based on type of distribution channel, the global graphene market is segmented into direct sales, distributors, online retailers and others. According to our estimates, currently, the direct sales segment captures the majority of the market share. This growth can be linked to factors such as cost efficiency, direct engagement with customers, and the rise of e-commerce.
Market Share by Type of End-User
Based on type of end-user, the global graphene market is segmented into aerospace & defense, automotive, electronics, energy and others. According to our estimates, currently, the automotive segment captures the majority of the market share. This is primarily due to the growing use of graphene in automotive applications such as structural components, graphene batteries, and tires.
On the other hand, the electronics sector is anticipated to experience a relatively higher CAGR during the forecast period, owing to its outstanding conductivity, heightened consumer awareness, and an increase in research and development funding.
Market Share by Geographical Regions
Based on geographical regions, the graphene market is segmented into North America, Europe, Asia, Latin America, Middle East and North Africa, and the rest of the world. According to our estimates, currently, Asia captures the majority share of the market, driven by increasing industrialization, robust automotive demand in countries like China and India, and rapid economic growth boosting the region's market.
Example Players in Graphene Market
ACS Material
Applied Graphene Materials
BGT Materials
CVD Equipment
Directa Plus
G6 Materials
Grafoid
Graphene NanoChem
Graphenea
Haydale Graphene Industries
JCNANO Tech
Morsh
NanoXplore
NeoGraf
Ningbo Morsh Technology
Talga
Thomas Swan
Vorbeck Materials
XG Sciences
Xiamen Knano Graphene Technology
Graphene Market: Research Coverage
The report on the graphene market features insights on various sections, including:
Market Sizing and Opportunity Analysis: An in-depth analysis of the graphene market, focusing on key market segments, including [A] type of product, [B] type of production method, [C] type of form, [D] type of quality, [E] type of application, [F] type of distribution channel, [G] type of end-user and [H] geographical regions.
Competitive Landscape: A comprehensive analysis of the companies engaged in the graphene market, based on several relevant parameters, such as [A] year of establishment, [B] company size, [C] location of headquarters and [D] ownership structure.
Company Profiles: Elaborate profiles of prominent players engaged in the graphene market, providing details on [A] location of headquarters, [B] company size, [C] company mission, [D] company footprint, [E] management team, [F] contact details, [G] financial information, [H] operating business segments, [I] graphene portfolio, [J] moat analysis, [K] recent developments, and an informed future outlook.
SWOT Analysis: An insightful SWOT framework, highlighting the strengths, weaknesses, opportunities and threats in the domain. Additionally, it provides Harvey ball analysis, highlighting the relative impact of each SWOT parameter.
Value Chain Analysis: A comprehensive analysis of the value chain, providing information on the different phases and stakeholders involved in the graphene market.
Key Questions Answered in this Report
How many companies are currently engaged in graphene market?
Which are the leading companies in this market?
What factors are likely to influence the evolution of this market?
What is the current and future market size?
What is the CAGR of this market?
How is the current and future market opportunity likely to be distributed across key market segments?
Reasons to Buy this Report
The report provides a comprehensive market analysis, offering detailed revenue projections of the overall market and its specific sub-segments. This information is valuable to both established market leaders and emerging entrants.
Stakeholders can leverage the report to gain a deeper understanding of the competitive dynamics within the market. By analyzing the competitive landscape, businesses can make informed decisions to optimize their market positioning and develop effective go-to-market strategies.
The report offers stakeholders a comprehensive overview of the market, including key drivers, barriers, opportunities, and challenges. This information empowers stakeholders to stay abreast of market trends and make data-driven decisions to capitalize on growth prospects.
Additional Benefits
Complimentary Excel Data Packs for all Analytical Modules in the Report
15% Free Content Customization
Detailed Report Walkthrough Session with Research Team
Free Updated report if the report is 6-12 months old or older
TABLE OF CONTENTS
1. PREFACE
1.1. Introduction
1.2. Market Share Insights
1.3. Key Market Insights
1.4. Report Coverage
1.5. Key Questions Answered
1.6. Chapter Outlines
2. RESEARCH METHODOLOGY
2.1. Chapter Overview
2.2. Research Assumptions
2.3. Database Building
2.3.1. Data Collection
2.3.2. Data Validation
2.3.3. Data Analysis
2.4. Project Methodology
2.4.1. Secondary Research
2.4.1.1. Annual Reports
2.4.1.2. Academic Research Papers
2.4.1.3. Company Websites
2.4.1.4. Investor Presentations
2.4.1.5. Regulatory Filings
2.4.1.6. White Papers
2.4.1.7. Industry Publications
2.4.1.8. Conferences and Seminars
2.4.1.9. Government Portals
2.4.1.10. Media and Press Releases
2.4.1.11. Newsletters
2.4.1.12. Industry Databases
2.4.1.13. Roots Proprietary Databases
2.4.1.14. Paid Databases and Sources
2.4.1.15. Social Media Portals
2.4.1.16. Other Secondary Sources
2.4.2. Primary Research
2.4.2.1. Introduction
2.4.2.2. Types
2.4.2.2.1. Qualitative
2.4.2.2.2. Quantitative
2.4.2.3. Advantages
2.4.2.4. Techniques
2.4.2.4.1. Interviews
2.4.2.4.2. Surveys
2.4.2.4.3. Focus Groups
2.4.2.4.4. Observational Research
2.4.2.4.5. Social Media Interactions
2.4.2.5. Stakeholders
2.4.2.5.1. Company Executives (CXOs)
2.4.2.5.2. Board of Directors
2.4.2.5.3. Company Presidents and Vice Presidents
2.4.2.5.4. Key Opinion Leaders
2.4.2.5.5. Research and Development Heads
2.4.2.5.6. Technical Experts
2.4.2.5.7. Subject Matter Experts
2.4.2.5.8. Scientists
2.4.2.5.9. Doctors and Other Healthcare Providers
2.4.2.6. Ethics and Integrity
2.4.2.6.1. Research Ethics
2.4.2.6.2. Data Integrity
2.4.3. Analytical Tools and Databases
3. ECONOMIC AND OTHER PROJECT SPECIFIC CONSIDERATIONS
3.1. Forecast Methodology
3.1.1. Top-Down Approach
3.1.2. Bottom-Up Approach
3.1.3. Hybrid Approach
3.2. Market Assessment Framework
3.2.1. Total Addressable Market (TAM)
3.2.2. Serviceable Addressable Market (SAM)
3.2.3. Serviceable Obtainable Market (SOM)
3.2.4. Currently Acquired Market (CAM)
3.3. Forecasting Tools and Techniques
3.3.1. Qualitative Forecasting
3.3.2. Correlation
3.3.3. Regression
3.3.4. Time Series Analysis
3.3.5. Extrapolation
3.3.6. Convergence
3.3.7. Forecast Error Analysis
3.3.8. Data Visualization
3.3.9. Scenario Planning
3.3.10. Sensitivity Analysis
3.4. Key Considerations
3.4.1. Demographics
3.4.2. Market Access
3.4.3. Reimbursement Scenarios
3.4.4. Industry Consolidation
3.5. Robust Quality Control
3.6. Key Market Segmentations
3.7. Limitations
4. MACRO-ECONOMIC INDICATORS
4.1. Chapter Overview
4.2. Market Dynamics
4.2.1. Time Period
4.2.1.1. Historical Trends
4.2.1.2. Current and Forecasted Estimates
4.2.2. Currency Coverage
4.2.2.1. Overview of Major Currencies Affecting the Market
4.2.2.2. Impact of Currency Fluctuations on the Industry
4.2.3. Foreign Exchange Impact
4.2.3.1. Evaluation of Foreign Exchange Rates and Their Impact on Market
4.2.3.2. Strategies for Mitigating Foreign Exchange Risk
4.2.4. Recession
4.2.4.1. Historical Analysis of Past Recessions and Lessons Learnt
4.2.4.2. Assessment of Current Economic Conditions and Potential Impact on the Market
4.2.5. Inflation
4.2.5.1. Measurement and Analysis of Inflationary Pressures in the Economy
4.2.5.2. Potential Impact of Inflation on the Market Evolution
4.2.6. Interest Rates
4.2.6.1. Overview of Interest Rates and Their Impact on the Market
4.2.6.2. Strategies for Managing Interest Rate Risk
4.2.7. Commodity Flow Analysis
4.2.7.1. Type of Commodity
4.2.7.2. Origins and Destinations
4.2.7.3. Values and Weights
4.2.7.4. Modes of Transportation
4.2.8. Global Trade Dynamics
4.2.8.1. Import Scenario
4.2.8.2. Export Scenario
4.2.9. War Impact Analysis
4.2.9.1. Russian-Ukraine War
4.2.9.2. Israel-Hamas War
4.2.10. COVID Impact / Related Factors
4.2.10.1. Global Economic Impact
4.2.10.2. Industry-specific Impact
4.2.10.3. Government Response and Stimulus Measures
4.2.10.4. Future Outlook and Adaptation Strategies
4.2.11. Other Indicators
4.2.11.1. Fiscal Policy
4.2.11.2. Consumer Spending
4.2.11.3. Gross Domestic Product (GDP)
4.2.11.4. Employment
4.2.11.5. Taxes
4.2.11.6. R&D Innovation
4.2.11.7. Stock Market Performance
4.2.11.8. Supply Chain
4.2.11.9. Cross-Border Dynamics
5. EXECUTIVE SUMMARY
6. INTRODUCTION
6.1. Chapter Overview
6.2. Overview of Graphene Market
6.2.1. Type of Product
6.2.2. Type of Applications
6.2.3. Type of End-User
6.3. Future Perspective
7. COMPETITIVE LANDSCAPE
7.1. Chapter Overview
7.2. Graphene: Overall Market Landscape
7.2.1. Analysis by Year of Establishment
7.2.2. Analysis by Company Size
7.2.3. Analysis by Location of Headquarters
7.2.4. Analysis by Ownership Structure
8. COMPANY PROFILES
8.1. Chapter Overview
8.2. ACS Material *
8.2.1. Company Overview
8.2.2. Company Mission
8.2.3. Company Footprint
8.2.4. Management Team
8.2.5. Contact Details
8.2.6. Financial Performance
8.2.7. Operating Business Segments
8.2.8. Service / Product Portfolio (project specific)
8.2.9. MOAT Analysis
8.2.10. Recent Developments and Future Outlook
8.3. Applied Graphene Materials
8.4. BGT Materials
8.5. CVD Equipment
8.6. Directa Plus
8.7. G6 Materials
8.8. Grafoid
8.9. Graphene NanoChem
8.10. Graphenea
8.11. Haydale Graphene Industries
8.12. JCNANO Tech
8.13. Morsh
8.14. NanoXplore
8.15. NeoGraf
8.16. Ningbo Morsh Technology
8.17. Talga
8.18. Thomas Swan
8.19. Vorbeck Materials
8.20. XG Sciences
8.21. Xiamen Knano Graphene Technology
9. VALUE CHAIN ANALYSIS
10. SWOT ANALYSIS
11. GLOBAL GRAPHENE MARKET
11.1. Chapter Overview
11.2. Key Assumptions and Methodology
11.3. Trends Disruption Impacting Market
11.4. Global Graphene Market, Historical Trends (Since 2019) and Forecasted Estimates (Till 2035)
11.5. Multivariate Scenario Analysis
11.5.1. Conservative Scenario
11.5.2. Optimistic Scenario
11.6. Key Market Segmentations
12. MARKET OPPORTUNITIES BASED ON TYPE OF PRODUCT
12.1. Chapter Overview
12.2. Key Assumptions and Methodology
12.3. Revenue Shift Analysis
12.4. Market Movement Analysis
12.5. Penetration-Growth (P-G) Matrix
12.6. Graphene Market for Graphene Oxide: Historical Trends (Since 2019) and Forecasted Estimates (Till 2035)
12.7. Graphene Market for Graphene Nanoplatelets (GNP): Historical Trends (Since 2019) and Forecasted Estimates (Till 2035)
12.8. Graphene Market for Others: Historical Trends (Since 2019) and Forecasted Estimates (Till 2035)
12.9. Data Triangulation and Validation
13. MARKET OPPORTUNITIES BASED ON TYPE OF PRODUCTION METHOD
13.1. Chapter Overview
13.2. Key Assumptions and Methodology
13.3. Revenue Shift Analysis
13.4. Market Movement Analysis
13.5. Penetration-Growth (P-G) Matrix
13.6. Graphene Market for Chemical Vapor Deposition: Historical Trends (Since 2019) and Forecasted Estimates (Till 2035)
13.7. Graphene Market for Exfoliation: Historical Trends (Since 2019) and Forecasted Estimates (Till 2035)
13.8. Graphene Market for Reduction of Graphene Oxide: Historical Trends (Since 2019) and Forecasted Estimates (Till 2035)
13.9. Graphene Market for Others: Historical Trends (Since 2019) and Forecasted Estimates (Till 2035)
13.10. Data Triangulation and Validation
14. MARKET OPPORTUNITIES BASED ON TYPE OF FORM
14.1. Chapter Overview
14.2. Key Assumptions and Methodology
14.3. Revenue Shift Analysis
14.4. Market Movement Analysis
14.5. Penetration-Growth (P-G) Matrix
14.6. Graphene Market for Dispersion: Historical Trends (Since 2019) and Forecasted Estimates (Till 2035)
14.7. Graphene Market for Film: Historical Trends (Since 2019) and Forecasted Estimates (Till 2035)
14.8. Graphene Market for Powder: Historical Trends (Since 2019) and Forecasted Estimates (Till 2035)
14.9. Graphene Market for Others: Historical Trends (Since 2019) and Forecasted Estimates (Till 2035)
14.10. Data Triangulation and Validation
15. MARKET OPPORTUNITIES BASED ON TYPE OF QUALITY
15.1. Chapter Overview
15.2. Key Assumptions and Methodology
15.3. Revenue Shift Analysis
15.4. Market Movement Analysis
15.5. Penetration-Growth (P-G) Matrix
15.6. Graphene Market for Industrial Grade: Historical Trends (Since 2019) and Forecasted Estimates (Till 2035)
15.7. Graphene Market for Research Grade: Historical Trends (Since 2019) and Forecasted Estimates (Till 2035)
15.8. Graphene Market for Others: Historical Trends (Since 2019) and Forecasted Estimates (Till 2035)
15.9. Data Triangulation and Validation
16. MARKET OPPORTUNITIES BASED ON TYPE OF APPLICATION
16.1. Chapter Overview
16.2. Key Assumptions and Methodology
16.3. Revenue Shift Analysis
16.4. Market Movement Analysis
16.5. Penetration-Growth (P-G) Matrix
16.6. Graphene Market for Catalyst: Historical Trends (Since 2019) and Forecasted Estimates (Till 2035)
16.7. Graphene Market for Composites: Historical Trends (Since 2019) and Forecasted Estimates (Till 2035)
16.8. Graphene Market for Electronic Component: Historical Trends (Since 2019) and Forecasted Estimates (Till 2035)
16.9. Graphene Market for Energy Storage: Historical Trends (Since 2019) and Forecasted Estimates (Till 2035)
16.10. Graphene Market for Paint & Coating: Historical Trends (Since 2019) and Forecasted Estimates (Till 2035)
16.11. Graphene Market for Others: Historical Trends (Since 2019) and Forecasted Estimates (Till 2035)
16.12. Data Triangulation and Validation
17. MARKET OPPORTUNITIES BASED ON TYPE OF DISTRIBUTION CHANNEL
17.1. Chapter Overview
17.2. Key Assumptions and Methodology
17.3. Revenue Shift Analysis
17.4. Market Movement Analysis
17.5. Penetration-Growth (P-G) Matrix
17.6. Graphene Market for Direct Sales: Historical Trends (Since 2019) and Forecasted Estimates (Till 2035)
17.7. Graphene Market for Distributors: Historical Trends (Since 2019) and Forecasted Estimates (Till 2035)
17.8. Graphene Market for Online Retailers: Historical Trends (Since 2019) and Forecasted Estimates (Till 2035)
17.9. Graphene Market for Others: Historical Trends (Since 2019) and Forecasted Estimates (Till 2035)
17.10. Data Triangulation and Validation
18. MARKET OPPORTUNITIES BASED ON TYPE OF END-USER
18.1. Chapter Overview
18.2. Key Assumptions and Methodology
18.3. Revenue Shift Analysis
18.4. Market Movement Analysis
18.5. Penetration-Growth (P-G) Matrix
18.6. Graphene Market for Aerospace & Defense: Historical Trends (Since 2019) and Forecasted Estimates (Till 2035)
18.7. Graphene Market for Automotive: Historical Trends (Since 2019) and Forecasted Estimates (Till 2035)
18.8. Graphene Market for Electronics: Historical Trends (Since 2019) and Forecasted Estimates (Till 2035)
18.9. Graphene Market for Energy: Historical Trends (Since 2019) and Forecasted Estimates (Till 2035)
18.10. Graphene Market for Others: Historical Trends (Since 2019) and Forecasted Estimates (Till 2035)
18.11. Data Triangulation and Validation
19. MARKET OPPORTUNITIES FOR GRAPHENE IN NORTH AMERICA
19.1. Chapter Overview
19.2. Key Assumptions and Methodology
19.3. Revenue Shift Analysis
19.4. Market Movement Analysis
19.5. Penetration-Growth (P-G) Matrix
19.6. Graphene Market in North America: Historical Trends (Since 2019) and Forecasted Estimates (Till 2035)
19.6.1. Graphene Market in the US: Historical Trends (Since 2019) and Forecasted Estimates (Till 2035)
19.6.2. Graphene Market in Canada: Historical Trends (Since 2019) and Forecasted Estimates (Till 2035)
19.6.3. Graphene Market in Mexico: Historical Trends (Since 2019) and Forecasted Estimates (Till 2035)
19.6.4. Graphene Market in Other North American Countries: Historical Trends (Since 2019) and Forecasted Estimates (Till 2035)
19.7. Data Triangulation and Validation
20. MARKET OPPORTUNITIES FOR GRAPHENE IN EUROPE
20.1. Chapter Overview
20.2. Key Assumptions and Methodology
20.3. Revenue Shift Analysis
20.4. Market Movement Analysis
20.5. Penetration-Growth (P-G) Matrix
20.6. Graphene Market in Europe: Historical Trends (Since 2019) and Forecasted Estimates (Till 2035)
20.6.1. Graphene Market in Austria: Historical Trends (Since 2019) and Forecasted Estimates (Till 2035)
20.6.2. Graphene Market in Belgium: Historical Trends (Since 2019) and Forecasted Estimates (Till 2035)
20.6.3. Graphene Market in Denmark: Historical Trends (Since 2019) and Forecasted Estimates (Till 2035)
20.6.4. Graphene Market in France: Historical Trends (Since 2019) and Forecasted Estimates (Till 2035)
20.6.5. Graphene Market in Germany: Historical Trends (Since 2019) and Forecasted Estimates (Till 2035)
20.6.6. Graphene Market in Ireland: Historical Trends (Since 2019) and Forecasted Estimates (Till 2035)
20.6.7. Graphene Market in Italy: Historical Trends (Since 2019) and Forecasted Estimates (Till 2035)
20.6.8. Graphene Market in Netherlands: Historical Trends (Since 2019) and Forecasted Estimates (Till 2035)
20.6.9. Graphene Market in Norway: Historical Trends (Since 2019) and Forecasted Estimates (Till 2035)
20.6.10. Graphene Market in Russia: Historical Trends (Since 2019) and Forecasted Estimates (Till 2035)
20.6.11. Graphene Market in Spain: Historical Trends (Since 2019) and Forecasted Estimates (Till 2035)
20.6.12. Graphene Market in Sweden: Historical Trends (Since 2019) and Forecasted Estimates (Till 2035)
20.6.13. Graphene Market in Switzerland: Historical Trends (Since 2019) and Forecasted Estimates (Till 2035)
20.6.14. Graphene Market in the UK: Historical Trends (Since 2019) and Forecasted Estimates (Till 2035)
20.6.15. Graphene Market in Other European Countries: Historical Trends (Since 2019) and Forecasted Estimates (Till 2035)
20.7. Data Triangulation and Validation
21. MARKET OPPORTUNITIES FOR GRAPHENE IN ASIA
21.1. Chapter Overview
21.2. Key Assumptions and Methodology
21.3. Revenue Shift Analysis
21.4. Market Movement Analysis
21.5. Penetration-Growth (P-G) Matrix
21.6. Graphene Market in Asia: Historical Trends (Since 2019) and Forecasted Estimates (Till 2035)
21.6.1. Graphene Market in China: Historical Trends (Since 2019) and Forecasted Estimates (Till 2035)
21.6.2. Graphene Market in India: Historical Trends (Since 2019) and Forecasted Estimates (Till 2035)
21.6.3. Graphene Market in Japan: Historical Trends (Since 2019) and Forecasted Estimates (Till 2035)
21.6.4. Graphene Market in Singapore: Historical Trends (Since 2019) and Forecasted Estimates (Till 2035)
21.6.5. Graphene Market in South Korea: Historical Trends (Since 2019) and Forecasted Estimates (Till 2035)
21.6.6. Graphene Market in Other Asian Countries: Historical Trends (Since 2019) and Forecasted Estimates (Till 2035)
21.7. Data Triangulation and Validation
22. MARKET OPPORTUNITIES FOR GRAPHENE IN MIDDLE EAST AND NORTH AFRICA (MENA)
22.1. Chapter Overview
22.2. Key Assumptions and Methodology
22.3. Revenue Shift Analysis
22.4. Market Movement Analysis
22.5. Penetration-Growth (P-G) Matrix
22.6. Graphene Market in Middle East and North Africa (MENA): Historical Trends (Since 2019) and Forecasted Estimates (Till 2035)
22.6.1. Graphene Market in Egypt: Historical Trends (Since 2019) and Forecasted Estimates (Till 205)
22.6.2. Graphene Market in Iran: Historical Trends (Since 2019) and Forecasted Estimates (Till 2035)
22.6.3. Graphene Market in Iraq: Historical Trends (Since 2019) and Forecasted Estimates (Till 2035)
22.6.4. Graphene Market in Israel: Historical Trends (Since 2019) and Forecasted Estimates (Till 2035)
22.6.5. Graphene Market in Kuwait: Historical Trends (Since 2019) and Forecasted Estimates (Till 2035)
22.6.6. Graphene Market in Saudi Arabia: Historical Trends (Since 2019) and Forecasted Estimates (Till 2035)
22.6.7. Graphene Market in United Arab Emirates (UAE): Historical Trends (Since 2019) and Forecasted Estimates (Till 2035)
22.6.8. Graphene Market in Other MENA Countries: Historical Trends (Since 2019) and Forecasted Estimates (Till 2035)
22.7. Data Triangulation and Validation
23. MARKET OPPORTUNITIES FOR GRAPHENE IN LATIN AMERICA
23.1. Chapter Overview
23.2. Key Assumptions and Methodology
23.3. Revenue Shift Analysis
23.4. Market Movement Analysis
23.5. Penetration-Growth (P-G) Matrix
23.6. Graphene Market in Latin America: Historical Trends (Since 2019) and Forecasted Estimates (Till 2035)
23.6.1. Graphene Market in Argentina: Historical Trends (Since 2019) and Forecasted Estimates (Till 2035)
23.6.2. Graphene Market in Brazil: Historical Trends (Since 2019) and Forecasted Estimates (Till 2035)
23.6.3. Graphene Market in Chile: Historical Trends (Since 2019) and Forecasted Estimates (Till 2035)
23.6.4. Graphene Market in Colombia Historical Trends (Since 2019) and Forecasted Estimates (Till 2035)
23.6.5. Graphene Market in Venezuela: Historical Trends (Since 2019) and Forecasted Estimates (Till 2035)
23.6.6. Graphene Market in Other Latin American Countries: Historical Trends (Since 2019) and Forecasted Estimates (Till 2035)
23.7. Data Triangulation and Validation
24. MARKET OPPORTUNITIES FOR GRAPHENE IN REST OF THE WORLD
24.1. Chapter Overview
24.2. Key Assumptions and Methodology
24.3. Revenue Shift Analysis
24.4. Market Movement Analysis
24.5. Penetration-Growth (P-G) Matrix
24.6. Graphene Market in Rest of the World: Historical Trends (Since 2019) and Forecasted Estimates (Till 2035)
24.6.1. Graphene Market in Australia: Historical Trends (Since 2019) and Forecasted Estimates (Till 2035)
24.6.2. Graphene Market in New Zealand: Historical Trends (Since 2019) and Forecasted Estimates (Till 2035)