스마트 폴리머 시장 : 산업 동향과 세계 예측(-2035년) - 폴리머 유형, 자극 유형, 최종사용자, 지역별
Smart Polymers Market, Till 2035: Distribution by Type of Polymer, Type of Stimulus, Type of End User, and Geographical Regions: Industry Trends and Global Forecasts
상품코드:1796406
리서치사:Roots Analysis
발행일:On Demand Report
페이지 정보:영문 167 Pages
라이선스 & 가격 (부가세 별도)
한글목차
스마트 폴리머 시장 : 개요
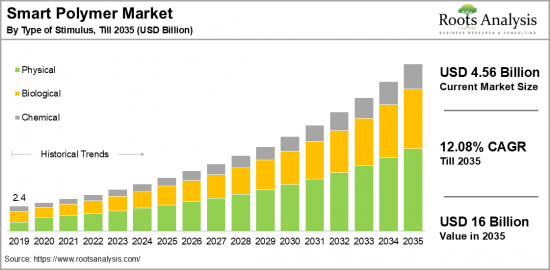
Roots Analysis에 따르면 세계의 스마트 폴리머 시장 규모는 현재 45억 6,000만 달러에서 예측 기간 중 CAGR 12.08%로 추이하며, 2035년에는 160억 달러로 성장할 것으로 예측됩니다.
스마트 폴리머 시장 기회: 분류
폴리머 유형
전기 활성 폴리머
자가 치유 폴리머
형상기억 폴리머
자극 유형
생물학적 자극
효소 반응성
자기 치유 폴리머
화학적 자극
pH 반응성
물리적 자극
광응답성
압력 반응성
열 반응성
최종사용자
항공우주
자동차
생명공학 및 의료
전기 및 전자
섬유
기타
지역
북미
미국
캐나다
멕시코
기타 북미 국가
유럽
오스트리아
벨기에
덴마크
프랑스
독일
아일랜드
이탈리아
네덜란드
노르웨이
러시아
스페인
스웨덴
스위스
영국
기타 유럽 국가
아시아
중국
인도
일본
싱가포르
한국
기타 아시아 국가
라틴아메리카
브라질
칠레
콜롬비아
베네수엘라
기타 라틴아메리카 국가
중동 및 북아프리카
이집트
이란
이라크
이스라엘
쿠웨이트
사우디아라비아
아랍에미리트
기타 중동 및 북아프리카 국가
세계 기타 지역
호주
뉴질랜드
기타 국가
스마트 폴리머 시장 : 성장과 동향
자극 반응성 고분자라고도 불리는 스마트 폴리머는 외부 자극에 따라 그 특성을 크게 가역적으로 변화, 조절할 수 있는 첨단 소재의 일종입니다. 이러한 자극에는 물리적(온도, 빛, 전기, 전기, 자기), 화학적(pH), 생물학적(효소 등) 자극이 포함됩니다. 특정 트리거에 따라 구조와 거동을 변화시킬 수 있는 능력을 가지고 있으므로 매우 다양한 용도에 대응할 수 있습니다. 예를 들어 생명공학 및 의료 분야에서는 약물전달 시스템, 조직공학용 비계, 세포배양 기질, 센서 등에 활용이 주목받고 있습니다.
이 산업의 성장을 지원하는 주요 요인 중 하나는 변화하는 환경 조건에 대응할 수 있는 첨단 소재에 대한 수요 증가입니다. 또한 스마트 폴리머와 3D 프린팅 기술의 융합은 커스터마이징과 혁신에 있으며, 전례 없는 기회를 창출하고 있습니다. 이러한 통합은 생산 효율을 향상시킬 뿐만 아니라, 제품 디자인 및 기능의 새로운 가능성을 열어주고 있습니다.
또한 각 산업이 보다 맞춤형 솔루션을 추구함에 따라 폴리머 시장의 성장이 가속화될 것으로 예측됩니다. 또한 생분해성 스마트 폴리머 및 지속가능한 폴리머에 대한 수요가 증가하고 있으며, 이는 업계 관계자들에게 많은 투자 기회를 창출하고 있습니다. 이러한 요인에 힘입어 스마트 폴리머 시장은 예측 기간 중 확대될 것으로 예측됩니다.
세계의 스마트 폴리머 시장을 조사했으며, 시장 개요, 배경, 시장 영향요인의 분석, 시장 규모 추이·예측, 각종 구분·지역별 상세 분석, 경쟁 구도, 주요 기업의 개요 등을 정리하여 전해드립니다.
목차
섹션 I : 리포트 개요
제1장 서문
제2장 조사 방법
제3장 시장 역학
제4장 거시경제 지표
섹션 II : 정성적 인사이트
제5장 개요
제6장 서론
제7장 규제 시나리오
섹션 III : 시장 개요
제8장 주요 기업의 종합적 데이터베이스
제9장 경쟁 구도
제10장 화이트 스페이스 분석
제11장 기업의 경쟁력 분석
제12장 스마트 폴리머 시장에서의 스타트업 에코시스템
섹션 IV : 기업 개요
제13장 기업 개요
챕터 개요
Airtex
Arkema
Autonomic Materials
BASF
Clariant
Covestro
Croda
DuPont
Eastman
Evonik
Huntsman
MedShape
Merck
Nanoshel
NEI
Nippon
Nouryon
SK Chemicals
Solvay
The Lubrizol
섹션 V : 시장 동향
제14장 메가트렌드 분석
제15장 미충족 요구 분석
제16장 특허 분석
제17장 최근 동향
섹션 VI : 시장 기회 분석
제18장 세계의 스마트 폴리머 시장
제19장 폴리머 유형별 시장 기회
제20장 자극 유형별 시장 기회
제21장 최종사용자별 시장 기회
제22장 북미에서 스마트 폴리머의 시장 기회
제23장 유럽에서 스마트 폴리머의 시장 기회
제24장 아시아에서 스마트 폴리머의 시장 기회
제25장 중동·북아프리카에서 스마트 폴리머의 시장 기회
제26장 라틴아메리카에서 스마트 폴리머의 시장 기회
제27장 세계의 기타 지역에서 스마트 폴리머의 시장 기회
제28장 시장 집중 분석 : 주요 기업의 분포
제29장 인접 시장 분석
섹션 VII : 전략 툴
제30장 주요 승리 전략
제31장 Porter's Five Forces 분석
제32장 SWOT 분석
제33장 밸류체인 분석
제34장 ROOTS 전략 제안
섹션 VIII : 기타 독점적 인사이트
제35장 1차 조사로부터의 인사이트
제36장 보고서 결론
섹션 IX : 부록
제37장 표형식 데이터
제38장 기업·단체 리스트
제39장 커스터마이즈 기회
제40장 ROOTS 서브스크립션 서비스
제41장 저자 상세
KSA
영문 목차
영문목차
Smart Polymers Market Overview
As per Roots Analysis, the global smart polymers market size is estimated to grow from USD 4.56 billion in the current year to USD 16 billion by 2035, at a CAGR of 12.08% during the forecast period, till 2035.
The opportunity for smart polymers market has been distributed across the following segments:
Type of Polymer
Electroactive Polymers
Self-Healing Polymers
Shape Memory Polymers
Type of Stimulus
Biological
Enzymes-Responsive
Self-Healing Polymer
Chemical
pH-Responsive
Physical
Photo-Responsive
Pressure-Responsive
Thermo-Responsive
Type of Stimulus
Aerospace
Automotive
Biotechnology & Medicine
Electrical & Electronics
Textile
Others
Geographical Regions
North America
US
Canada
Mexico
Other North American countries
Europe
Austria
Belgium
Denmark
France
Germany
Ireland
Italy
Netherlands
Norway
Russia
Spain
Sweden
Switzerland
UK
Other European countries
Asia
China
India
Japan
Singapore
South Korea
Other Asian countries
Latin America
Brazil
Chile
Colombia
Venezuela
Other Latin American countries
Middle East and North Africa
Egypt
Iran
Iraq
Israel
Kuwait
Saudi Arabia
UAE
Other MENA countries
Rest of the World
Australia
New Zealand
Other countries
SMART POLYMERS MARKET: GROWTH AND TRENDS
Smart polymers, also known as stimuli-responsive polymers, are a type of advanced material capable of enduring and adjusting to considerable reversible changes in their characteristics in reaction to various external stimuli. These stimuli may encompass different types such as physical (temperature, light, electric, or magnetic), chemical (pH), and biological (enzymes and others). The ability of these polymers to modify their structure and behavior based on specific triggers makes them highly versatile for a wide range of applications. For example, the potential applications of smart polymers in the fields of biotechnology and medicine are notable, including their use in drug delivery systems, tissue engineering scaffolds, cell culture supports, sensors, and more.
A primary driver of the growth in this industry is the increasing demand for advanced materials that can respond to changing environmental conditions. Moreover, the fusion of 3D printing technology with smart polymers is generating unprecedented opportunities for customization and innovation within the smart polymer market. This integration not only improves production efficiency but also paves the way for new possibilities in product design and functionality.
As various industries look for more tailored solutions, the dynamics of growth in the polymer market are expected to accelerate. Additionally, there is a growing demand for biodegradable smart polymers and sustainable polymers that is creating several investment opportunities for industry stakeholders. Overall, driven by these factors, the smart polymers market is expected to increase during the forecast period.
SMART POLYMERS MARKET: KEY SEGMENTS
Market Share by Type of Polymer
Based on type of polymer, the global smart polymers market is segmented into electroactive polymers, self-healing polymers, and shape memory polymers. According to our estimates, currently, shape memory polymers segment captures the majority share of the market. This can be attributed to their versatility and extensive range of uses.
However, self-healing polymers segment is expected to grow at a relatively higher CAGR during the forecast period, driven by emerging applications in the automotive, aerospace, and construction industries, where their self-repairing capabilities increase market demand. Additionally, electroactive polymers are also becoming popular, especially in electronics, robotics, and sensor technologies, as they can alter their shape or size in response to electrical stimuli.
Market Share by Type of Stimulus
Based on type of stimulus, the smart polymers market is segmented into biological, chemical and physical. According to our estimates, currently, physical stimuli responsive polymers captures the majority of the market. This can be attributed to their extensive applications in biomedical, automotive, textile, and electronics sectors, where temperature-responsive polymers, being the most prevalent type of physical stimuli polymer, are extensively utilized.
However, biological stimuli polymers segment is expected to grow at a relatively higher CAGR during the forecast period. Within this sector, self-healing polymers are a significant factor propelling the market growth, due to their ability to repair damage such as cracks or cuts autonomously without the need for human intervention or external repair.
Market Share by Type of End User
Based on type of end user, the smart polymers market is segmented into aerospace, automotive, biotechnology & medicine, electrical & electronics, textile, and others. According to our estimates, currently, biotechnology and medicine captures the majority of the market. This can be attributed to the significant application of temperature-responsive and pH-responsive polymers in drug delivery systems, allowing medication to be released at specific times or locations. The growing use of smart polymers in healthcare, particularly for medical devices and implants, also contributes to the market's expansion.
However, automotive sector is expected to grow at a relatively higher CAGR during the forecast period. This can be liked to the fact that smart polymers provide enhanced durability, improved performance, and increased safety through lightweight materials in vehicles.
Market Share by Geographical Regions
Based on geographical regions, the smart polymers market is segmented into North America, Europe, Asia, Latin America, Middle East and North Africa, and the rest of the world. According to our estimates, currently, North America captures the majority share of the market. However, market in Asia Pacific is expected to grow at a higher CAGR during the forecast period. This is due to substantial growth in the industrial and manufacturing sectors, particularly in China, Japan, and South Korea. Additionally, the growth in the automotive sector and the rising application of smart polymers in the textiles industry are contributing to market advancement. Further, the increasing emphasis on innovation and research and development in fields such as nanotechnology, biomedical engineering, and energy-efficient materials is expected to further support market growth in the region.
Example Players in Smart Polymers Market
Airtex
Arkema
Autonomic Material
BASF
Clariant
Covestro
Croda
DuPont
Eastman Chemical
Evonik
Huntsman
MedShap
Merck
Nanoshel
NEI
Nippon
Nouryon
SK Chemicals
SMP
Solvay
Spintech
The Lubrizol
SMART POLYMERS MARKET: RESEARCH COVERAGE
The report on the smart polymers market features insights on various sections, including:
Market Sizing and Opportunity Analysis: An in-depth analysis of the smart polymers market, focusing on key market segments, including [A] type of polymer, [B] type of stimulus, [C] type of end user, and [D] geographical regions
Competitive Landscape: A comprehensive analysis of the companies engaged in the smart polymers market, based on several relevant parameters, such as [A] year of establishment, [B] company size, [C] location of headquarters and [D] ownership structure.
Company Profiles: Elaborate profiles of prominent players engaged in the smart polymers market, providing details on [A] location of headquarters, [B] company size, [C] company mission, [D] company footprint, [E] management team, [F] contact details, [G] financial information, [H] operating business segments, [I] service / product portfolio, [J] moat analysis, [K] recent developments, and an informed future outlook.
Megatrends: An evaluation of ongoing megatrends in the smart polymers industry.
Patent Analysis: An insightful analysis of patents filed / granted in the smart polymers domain, based on relevant parameters, including [A] type of patent, [B] patent publication year, [C] patent age and [D] leading players.
Porter's Five Forces Analysis: An analysis of five competitive forces prevailing in the smart polymers market, including threats of new entrants, bargaining power of buyers, bargaining power of suppliers, threats of substitute products and rivalry among existing competitors.
Recent Developments: An overview of the recent developments made in the smart polymers market, along with analysis based on relevant parameters, including [A] year of initiative, [B] type of initiative, [C] geographical distribution and [D] most active players.
SWOT Analysis: An insightful SWOT framework, highlighting the strengths, weaknesses, opportunities and threats in the domain. Additionally, it provides Harvey ball analysis, highlighting the relative impact of each SWOT parameter.
Value Chain Analysis: A comprehensive analysis of the value chain, providing information on the different phases and stakeholders involved in the smart polymers market.
KEY QUESTIONS ANSWERED IN THIS REPORT
How many companies are currently engaged in smart polymers market?
Which are the leading companies in this market?
What factors are likely to influence the evolution of this market?
What is the current and future market size?
What is the CAGR of this market?
How is the current and future market opportunity likely to be distributed across key market segments?
REASONS TO BUY THIS REPORT
The report provides a comprehensive market analysis, offering detailed revenue projections of the overall market and its specific sub-segments. This information is valuable to both established market leaders and emerging entrants.
Stakeholders can leverage the report to gain a deeper understanding of the competitive dynamics within the market. By analyzing the competitive landscape, businesses can make informed decisions to optimize their market positioning and develop effective go-to-market strategies.
The report offers stakeholders a comprehensive overview of the market, including key drivers, barriers, opportunities, and challenges. This information empowers stakeholders to stay abreast of market trends and make data-driven decisions to capitalize on growth prospects.
ADDITIONAL BENEFITS
Complimentary Excel Data Packs for all Analytical Modules in the Report
15% Free Content Customization
Detailed Report Walkthrough Session with Research Team
Free Updated report if the report is 6-12 months old or older
TABLE OF CONTENTS
SECTION I: REPORT OVERVIEW
1. PREFACE
1.1. Introduction
1.2. Market Share Insights
1.3. Key Market Insights
1.4. Report Coverage
1.5. Key Questions Answered
1.6. Chapter Outlines
2. RESEARCH METHODOLOGY
2.1. Chapter Overview
2.2. Research Assumptions
2.3. Database Building
2.3.1. Data Collection
2.3.2. Data Validation
2.3.3. Data Analysis
2.4. Project Methodology
2.4.1. Secondary Research
2.4.1.1. Annual Reports
2.4.1.2. Academic Research Papers
2.4.1.3. Company Websites
2.4.1.4. Investor Presentations
2.4.1.5. Regulatory Filings
2.4.1.6. White Papers
2.4.1.7. Industry Publications
2.4.1.8. Conferences and Seminars
2.4.1.9. Government Portals
2.4.1.10. Media and Press Releases
2.4.1.11. Newsletters
2.4.1.12. Industry Databases
2.4.1.13. Roots Proprietary Databases
2.4.1.14. Paid Databases and Sources
2.4.1.15. Social Media Portals
2.4.1.16. Other Secondary Sources
2.4.2. Primary Research
2.4.2.1. Introduction
2.4.2.2. Types
2.4.2.2.1. Qualitative
2.4.2.2.2. Quantitative
2.4.2.3. Advantages
2.4.2.4. Techniques
2.4.2.4.1. Interviews
2.4.2.4.2. Surveys
2.4.2.4.3. Focus Groups
2.4.2.4.4. Observational Research
2.4.2.4.5. Social Media Interactions
2.4.2.5. Stakeholders
2.4.2.5.1. Company Executives (CXOs)
2.4.2.5.2. Board of Directors
2.4.2.5.3. Company Presidents and Vice Presidents
2.4.2.5.4. Key Opinion Leaders
2.4.2.5.5. Research and Development Heads
2.4.2.5.6. Technical Experts
2.4.2.5.7. Subject Matter Experts
2.4.2.5.8. Scientists
2.4.2.5.9. Doctors and Other Healthcare Providers
2.4.2.6. Ethics and Integrity
2.4.2.6.1. Research Ethics
2.4.2.6.2. Data Integrity
2.4.3. Analytical Tools and Databases
3. MARKET DYNAMICS
3.1. Forecast Methodology
3.1.1. Top-Down Approach
3.1.2. Bottom-Up Approach
3.1.3. Hybrid Approach
3.2. Market Assessment Framework
3.2.1. Total Addressable Market (TAM)
3.2.2. Serviceable Addressable Market (SAM)
3.2.3. Serviceable Obtainable Market (SOM)
3.2.4. Currently Acquired Market (CAM)
3.3. Forecasting Tools and Techniques
3.3.1. Qualitative Forecasting
3.3.2. Correlation
3.3.3. Regression
3.3.4. Time Series Analysis
3.3.5. Extrapolation
3.3.6. Convergence
3.3.7. Forecast Error Analysis
3.3.8. Data Visualization
3.3.9. Scenario Planning
3.3.10. Sensitivity Analysis
3.4. Key Considerations
3.4.1. Demographics
3.4.2. Market Access
3.4.3. Reimbursement Scenarios
3.4.4. Industry Consolidation
3.5. Robust Quality Control
3.6. Key Market Segmentations
3.7. Limitations
4. MACRO-ECONOMIC INDICATORS
4.1. Chapter Overview
4.2. Market Dynamics
4.2.1. Time Period
4.2.1.1. Historical Trends
4.2.1.2. Current and Forecasted Estimates
4.2.2. Currency Coverage
4.2.2.1. Overview of Major Currencies Affecting the Market
4.2.2.2. Impact of Currency Fluctuations on the Industry
4.2.3. Foreign Exchange Impact
4.2.3.1. Evaluation of Foreign Exchange Rates and Their Impact on Market
4.2.3.2. Strategies for Mitigating Foreign Exchange Risk
4.2.4. Recession
4.2.4.1. Historical Analysis of Past Recessions and Lessons Learnt
4.2.4.2. Assessment of Current Economic Conditions and Potential Impact on the Market
4.2.5. Inflation
4.2.5.1. Measurement and Analysis of Inflationary Pressures in the Economy
4.2.5.2. Potential Impact of Inflation on the Market Evolution
4.2.6. Interest Rates
4.2.6.1. Overview of Interest Rates and Their Impact on the Market
4.2.6.2. Strategies for Managing Interest Rate Risk
4.2.7. Commodity Flow Analysis
4.2.7.1. Type of Commodity
4.2.7.2. Origins and Destinations
4.2.7.3. Values and Weights
4.2.7.4. Modes of Transportation
4.2.8. Global Trade Dynamics
4.2.8.1. Import Scenario
4.2.8.2. Export Scenario
4.2.9. War Impact Analysis
4.2.9.1. Russian-Ukraine War
4.2.9.2. Israel-Hamas War
4.2.10. COVID Impact / Related Factors
4.2.10.1. Global Economic Impact
4.2.10.2. Industry-specific Impact
4.2.10.3. Government Response and Stimulus Measures
4.2.10.4. Future Outlook and Adaptation Strategies
4.2.11. Other Indicators
4.2.11.1. Fiscal Policy
4.2.11.2. Consumer Spending
4.2.11.3. Gross Domestic Product (GDP)
4.2.11.4. Employment
4.2.11.5. Taxes
4.2.11.6. R&D Innovation
4.2.11.7. Stock Market Performance
4.2.11.8. Supply Chain
4.2.11.9. Cross-Border Dynamics
SECTION II: QUALITATIVE INSIGHTS
5. EXECUTIVE SUMMARY
6. INTRODUCTION
6.1. Chapter Overview
6.2. Overview of Smart Polymer Market
6.2.1. Type of Polymer
6.2.2. Type of Stimulus
6.2.3. Type of End User
6.3. Future Perspective
7. REGULATORY SCENARIO
SECTION III: MARKET OVERVIEW
8. COMPREHENSIVE DATABASE OF LEADING PLAYERS
9. COMPETITIVE LANDSCAPE
9.1. Chapter Overview
9.2. Smart Polymer: Overall Market Landscape
9.2.1. Analysis by Year of Establishment
9.2.2. Analysis by Company Size
9.2.3. Analysis by Location of Headquarters
9.2.4. Analysis by Ownership Structure
10. WHITE SPACE ANALYSIS
11. COMPANY COMPETITIVENESS ANALYSIS
12. STARTUP ECOSYSTEM IN THE SMART POLYMER MARKET
12.1. Smart Polymer: Market Landscape of Startups
12.1.1. Analysis by Year of Establishment
12.1.2. Analysis by Company Size
12.1.3. Analysis by Company Size and Year of Establishment
12.1.4. Analysis by Location of Headquarters
12.1.5. Analysis by Company Size and Location of Headquarters
12.1.6. Analysis by Ownership Structure
12.2. Key Findings
SECTION IV: COMPANY PROFILES
13. COMPANY PROFILES
13.1. Chapter Overview
13.2. Airtex*
13.2.1. Company Overview
13.2.2. Company Mission
13.2.3. Company Footprint
13.2.4. Management Team
13.2.5. Contact Details
13.2.6. Financial Performance
13.2.7. Operating Business Segments
13.2.8. Service / Product Portfolio (project specific)
13.2.9. MOAT Analysis
13.2.10. Recent Developments and Future Outlook
13.3. Arkema
13.4. Autonomic Materials
13.5. BASF
13.6. Clariant
13.7. Covestro
13.8. Croda
13.9. DuPont
13.10. Eastman
13.11. Evonik
13.12. Huntsman
13.13. MedShape
13.14. Merck
13.15. Nanoshel
13.16. NEI
13.17. Nippon
13.18. Nouryon
13.19. SK Chemicals
13.20. Solvay
13.21. The Lubrizol
SECTION V: MARKET TRENDS
14. MEGA TRENDS ANALYSIS
15. UNMEET NEED ANALYSIS
16. PATENT ANALYSIS
17. RECENT DEVELOPMENTS
17.1. Chapter Overview
17.2. Recent Funding
17.3. Recent Partnerships
17.4. Other Recent Initiatives
SECTION VI: MARKET OPPORTUNITY ANALYSIS
18. GLOBAL SMART POLYMER MARKET
18.1. Chapter Overview
18.2. Key Assumptions and Methodology
18.3. Trends Disruption Impacting Market
18.4. Demand Side Trends
18.5. Supply Side Trends
18.6. Global Smart Polymer Market, Historical Trends (Since 2019) and Forecasted Estimates (Till 2035)
18.7. Multivariate Scenario Analysis
18.7.1. Conservative Scenario
18.7.2. Optimistic Scenario
18.8. Investment Feasibility Index
18.9. Key Market Segmentations
19. MARKET OPPORTUNITIES BASED ON TYPE OF POLYMER
19.1. Chapter Overview
19.2. Key Assumptions and Methodology
19.3. Revenue Shift Analysis
19.4. Market Movement Analysis
19.5. Penetration-Growth (P-G) Matrix
19.6. Smart Polymer Market for Electroactive Polymers: Historical Trends (Since 2019) and Forecasted Estimates (Till 2035)
19.7. Smart Polymer Market for Self-Healing Polymers: Historical Trends (Since 2019) and Forecasted Estimates (Till 2035)
19.8. Smart Polymer Market for Shape Memory Polymers: Historical Trends (Since 2019) and Forecasted Estimates (Till 2035)
19.9. Data Triangulation and Validation
19.9.1. Secondary Sources
19.9.2. Primary Sources
19.9.3. Statistical Modeling
20. MARKET OPPORTUNITIES BASED ON TYPE OF STIMULUS
20.1. Chapter Overview
20.2. Key Assumptions and Methodology
20.3. Revenue Shift Analysis
20.4. Market Movement Analysis
20.5. Penetration-Growth (P-G) Matrix
20.6. Smart Polymer Market for Biological Historical Trends (Since 2019) and Forecasted Estimates (Till 2035)
20.7. Smart Polymer Market for Chemical: Historical Trends (Since 2019) and Forecasted Estimates (Till 2035)
20.8. Smart Polymer Market for Physical: Historical Trends (Since 2019) and Forecasted Estimates (Till 2035)
20.9. Data Triangulation and Validation
20.9.1. Secondary Sources
20.9.2. Primary Sources
20.9.3. Statistical Modeling
21. MARKET OPPORTUNITIES BASED ON TYPE OF END USER
21.1. Chapter Overview
21.2. Key Assumptions and Methodology
21.3. Revenue Shift Analysis
21.4. Market Movement Analysis
21.5. Penetration-Growth (P-G) Matrix
21.6. Smart Polymer Market for Aerospace: Historical Trends (Since 2019) and Forecasted Estimates (Till 2035)
21.7. Smart Polymer Market for Automotive: Historical Trends (Since 2019) and Forecasted Estimates (Till 2035)
21.8. Smart Polymer Market for Biotechnology & Medicine: Historical Trends (Since 2019) and Forecasted Estimates (Till 2035)
21.9. Smart Polymer Market for Electrical & Electronics: Historical Trends (Since 2019) and Forecasted Estimates (Till 2035)
21.10. Smart Polymer Market for Textile: Historical Trends (Since 2019) and Forecasted Estimates (Till 2035)
21.11. Smart Polymer Market for Others: Historical Trends (Since 2019) and Forecasted Estimates (Till 2035)
21.12. Data Triangulation and Validation
21.12.1. Secondary Sources
21.12.2. Primary Sources
21.12.3. Statistical Modeling
22. MARKET OPPORTUNITIES FOR SMART POLYMERS IN NORTH AMERICA
22.1. Chapter Overview
22.2. Key Assumptions and Methodology
22.3. Revenue Shift Analysis
22.4. Market Movement Analysis
22.5. Penetration-Growth (P-G) Matrix
22.6. Smart Polymer Market in North America: Historical Trends (Since 2019) and Forecasted Estimates (Till 2035)
22.6.1. Smart Polymer Market in the US: Historical Trends (Since 2019) and Forecasted Estimates (Till 2035)
22.6.2. Smart Polymer Market in Canada: Historical Trends (Since 2019) and Forecasted Estimates (Till 2035)
22.6.3. Smart Polymer Market in Mexico: Historical Trends (Since 2019) and Forecasted Estimates (Till 2035)
22.6.4. Smart Polymer Market in Other North American Countries: Historical Trends (Since 2019) and Forecasted Estimates (Till 2035)
22.7. Data Triangulation and Validation
23. MARKET OPPORTUNITIES FOR SMART POLYMERS IN EUROPE
23.1. Chapter Overview
23.2. Key Assumptions and Methodology
23.3. Revenue Shift Analysis
23.4. Market Movement Analysis
23.5. Penetration-Growth (P-G) Matrix
23.6. Smart Polymer Market in Europe: Historical Trends (Since 2019) and Forecasted Estimates (Till 2035)
23.6.1. Smart Polymer Market in Austria: Historical Trends (Since 2019) and Forecasted Estimates (Till 2035)
23.6.2. Smart Polymer Market in Belgium: Historical Trends (Since 2019) and Forecasted Estimates (Till 2035)
23.6.3. Smart Polymer Market in Denmark: Historical Trends (Since 2019) and Forecasted Estimates (Till 2035)
23.6.4. Smart Polymer Market in France: Historical Trends (Since 2019) and Forecasted Estimates (Till 2035)
23.6.5. Smart Polymer Market in Germany: Historical Trends (Since 2019) and Forecasted Estimates (Till 2035)
23.6.6. Smart Polymer Market in Ireland: Historical Trends (Since 2019) and Forecasted Estimates (Till 2035)
23.6.7. Smart Polymer Market in Italy: Historical Trends (Since 2019) and Forecasted Estimates (Till 2035)
23.6.8. Smart Polymer Market in Netherlands: Historical Trends (Since 2019) and Forecasted Estimates (Till 2035)
23.6.9. Smart Polymer Market in Norway: Historical Trends (Since 2019) and Forecasted Estimates (Till 2035)
23.6.10. Smart Polymer Market in Russia: Historical Trends (Since 2019) and Forecasted Estimates (Till 2035)
23.6.11. Smart Polymer Market in Spain: Historical Trends (Since 2019) and Forecasted Estimates (Till 2035)
23.6.12. Smart Polymer Market in Sweden: Historical Trends (Since 2019) and Forecasted Estimates (Till 2035)
23.6.13. Smart Polymer Market in Sweden: Historical Trends (Since 2019) and Forecasted Estimates (Till 2035)
23.6.14. Smart Polymer Market in Switzerland: Historical Trends (Since 2019) and Forecasted Estimates (Till 2035)
23.6.15. Smart Polymer Market in the UK: Historical Trends (Since 2019) and Forecasted Estimates (Till 2035)
23.6.16. Smart Polymer Market in Other European Countries: Historical Trends (Since 2019) and Forecasted Estimates (Till 2035)
23.7. Data Triangulation and Validation
24. MARKET OPPORTUNITIES FOR SMART POLYMERS IN ASIA
24.1. Chapter Overview
24.2. Key Assumptions and Methodology
24.3. Revenue Shift Analysis
24.4. Market Movement Analysis
24.5. Penetration-Growth (P-G) Matrix
24.6. Smart Polymer Market in Asia: Historical Trends (Since 2019) and Forecasted Estimates (Till 2035)
24.6.1. Smart Polymer Market in China: Historical Trends (Since 2019) and Forecasted Estimates (Till 2035)
24.6.2. Smart Polymer Market in India: Historical Trends (Since 2019) and Forecasted Estimates (Till 2035)
24.6.3. Smart Polymer Market in Japan: Historical Trends (Since 2019) and Forecasted Estimates (Till 2035)
24.6.4. Smart Polymer Market in Singapore: Historical Trends (Since 2019) and Forecasted Estimates (Till 2035)
24.6.5. Smart Polymer Market in South Korea: Historical Trends (Since 2019) and Forecasted Estimates (Till 2035)
24.6.6. Smart Polymer Market in Other Asian Countries: Historical Trends (Since 2019) and Forecasted Estimates (Till 2035)
24.7. Data Triangulation and Validation
25. MARKET OPPORTUNITIES FOR SMART POLYMERS IN MIDDLE EAST AND NORTH AFRICA (MENA)
25.1. Chapter Overview
25.2. Key Assumptions and Methodology
25.3. Revenue Shift Analysis
25.4. Market Movement Analysis
25.5. Penetration-Growth (P-G) Matrix
25.6. Smart Polymer Market in Middle East and North Africa (MENA): Historical Trends (Since 2019) and Forecasted Estimates (Till 2035)
25.6.1. Smart Polymer Market in Egypt: Historical Trends (Since 2019) and Forecasted Estimates (Till 205)
25.6.2. Smart Polymer Market in Iran: Historical Trends (Since 2019) and Forecasted Estimates (Till 2035)
25.6.3. Smart Polymer Market in Iraq: Historical Trends (Since 2019) and Forecasted Estimates (Till 2035)
25.6.4. Smart Polymer Market in Israel: Historical Trends (Since 2019) and Forecasted Estimates (Till 2035)
25.6.5. Smart Polymer Market in Kuwait: Historical Trends (Since 2019) and Forecasted Estimates (Till 2035)
25.6.6. Smart Polymer Market in Saudi Arabia: Historical Trends (Since 2019) and Forecasted Estimates (Till 2035)
25.6.7. Neuromorphic Computing Marke in United Arab Emirates (UAE): Historical Trends (Since 2019) and Forecasted Estimates (Till 2035)
25.6.8. Smart Polymer Market in Other MENA Countries: Historical Trends (Since 2019) and Forecasted Estimates (Till 2035)
25.7. Data Triangulation and Validation
26. MARKET OPPORTUNITIES FOR SMART POLYMERS IN LATIN AMERICA
26.1. Chapter Overview
26.2. Key Assumptions and Methodology
26.3. Revenue Shift Analysis
26.4. Market Movement Analysis
26.5. Penetration-Growth (P-G) Matrix
26.6. Smart Polymer Market in Latin America: Historical Trends (Since 2019) and Forecasted Estimates (Till 2035)
26.6.1. Smart Polymer Market in Argentina: Historical Trends (Since 2019) and Forecasted Estimates (Till 2035)
26.6.2. Smart Polymer Market in Brazil: Historical Trends (Since 2019) and Forecasted Estimates (Till 2035)
26.6.3. Smart Polymer Market in Chile: Historical Trends (Since 2019) and Forecasted Estimates (Till 2035)
26.6.4. Smart Polymer Market in Colombia Historical Trends (Since 2019) and Forecasted Estimates (Till 2035)
26.6.5. Smart Polymer Market in Venezuela: Historical Trends (Since 2019) and Forecasted Estimates (Till 2035)
26.6.6. Smart Polymer Market in Other Latin American Countries: Historical Trends (Since 2019) and Forecasted Estimates (Till 2035)
26.7. Data Triangulation and Validation
27. MARKET OPPORTUNITIES FOR SMART POLYMERS IN REST OF THE WORLD
27.1. Chapter Overview
27.2. Key Assumptions and Methodology
27.3. Revenue Shift Analysis
27.4. Market Movement Analysis
27.5. Penetration-Growth (P-G) Matrix
27.6. Smart Polymer Market in Rest of the World: Historical Trends (Since 2019) and Forecasted Estimates (Till 2035)
27.6.1. Smart Polymer Market in Australia: Historical Trends (Since 2019) and Forecasted Estimates (Till 2035)
27.6.2. Smart Polymer Market in New Zealand: Historical Trends (Since 2019) and Forecasted Estimates (Till 2035)
27.6.3. Smart Polymer Market in Other Countries
27.7. Data Triangulation and Validation
28. MARKET CONCENTRATION ANALYSIS: DISTRIBUTION BY LEADING PLAYERS