E-House 시장 : 산업 동향과 세계 예측(-2035년) - E-House 유형별, 구성요소별, 전압 유형별, 용도별, E-House 규모별, 재료 유형별, 지역별
E-House Market, Till 2035: Distribution by Type of E-House, Type of Component, Type of Voltage, Applications, E-house size, Type of Material and Geographical Regions: Industry Trends and Global Forecasts
상품코드:1771417
리서치사:Roots Analysis
발행일:On Demand Report
페이지 정보:영문 188 Pages
라이선스 & 가격 (부가세 별도)
한글목차
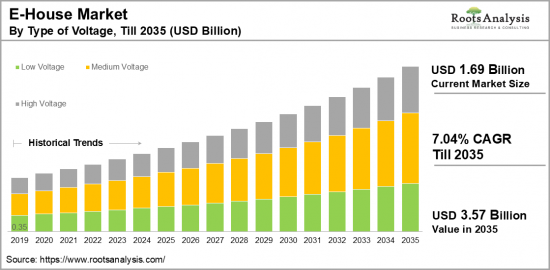
전 세계 E-House 시장 규모는 2035년까지 예측 기간 동안 7.04%의 CAGR로 현재 16억 9,000만 달러에서 2035년에는 35억 7,000만 달러로 성장할 것으로 예상됩니다.
E-House 시장 기회 : 부문별
E-House 유형별
고정식 E-House
이동식 변전소
구성요소별
버스웨이
제어반
HVAC 시스템(난방, 환기, 공조)
개폐기
변압기
UPS(무정전전원장치)
기타
전압 유형별
저압(1KV 미만)
중압(1KV-35KV)
고압(35KV 이상)
용도별
유틸리티
산업용
화학
광업 및 광물
석유 및 가스
기타
E-House 규모별
소규모
중규모
대규모
재료 유형별
컴포지트
콘크리트
스틸
특징 유형별
맞춤형
모듈형
스마트형
지역별
북미
미국
캐나다
멕시코
기타 북미 국가
유럽
오스트리아
벨기에
덴마크
프랑스
독일
아일랜드
이탈리아
네덜란드
노르웨이
러시아
스페인
스웨덴
스위스
영국
기타 유럽 국가
아시아
중국
인도
일본
싱가포르
한국
기타 아시아 국가
라틴아메리카
브라질
칠레
콜롬비아
베네수엘라
기타 라틴아메리카 국가
중동 및 북아프리카
이집트
이란
이라크
이스라엘
쿠웨이트
사우디아라비아
아랍에미리트
기타 중동 및 북아프리카 국가
세계 기타 지역
호주
뉴질랜드
기타 국가
E-House 시장 : 성장과 동향
지속가능하고 에너지 효율적인 전력 솔루션에 대한 수요가 증가함에 따라 E-House 시장에 새로운 가능성이 열리고 있으며, E-House는 첨단 기술, 재생에너지 및 에너지 절약 시스템을 원활하게 통합하여 친환경적인 생활 환경을 구현하는 구조물입니다. 이러한 구조는 컴팩트한 모듈형부터 라이프스타일과 개별 요구에 맞게 설계할 수 있는 대규모 맞춤형 구조까지 다양한 형태가 있습니다.
E-House는 일반적으로 재생에너지와 기존 전력망과의 연결을 결합하여 활용함으로써 안정적이고 지속가능한 전력 공급을 보장하고, 경우에 따라서는 전력망에 의존하지 않는 독립적인 운영을 가능하게 합니다. 또한, E-House는 신속한 도입이 가능한 프로젝트 솔루션으로 다양한 과제에 대응하면서 지속가능성 목표 달성에 기여할 수 있습니다.
지멘스 및 ABB와 같은 기업들은 다양한 산업 및 용도의 전력 분배 요구를 충족하는 모듈형 플러그 앤 플레이 솔루션을 제공함으로써 보다 친환경적이고 진보된 미래로 나아가는 큰 발걸음을 내딛고 있습니다. 또한, 태양광 및 풍력과 같은 재생에너지의 통합을 포함한 E-House 분야의 지속적인 기술 혁신은 산업계에 보다 깨끗하고 지속가능한 대안을 제공하고 있습니다. 또한, 에너지 소비를 최적화하고 전력망의 안정성을 향상시키기 위한 첨단 모니터링 및 제어 시스템 등의 기능도 향후 도입될 것으로 예상되며, 이는 E-House의 전반적인 성능을 더욱 향상시킬 것으로 기대됩니다. 이러한 지속적인 기술 혁신과 도입의 진전으로 인해 E-House 시장은 예측 기간 동안 괄목할 만한 성장을 이룰 것으로 예상됩니다.
세계의 E-House 시장을 조사했으며, 시장 개요와 배경, 시장 영향요인 분석, 시장 규모 추정 및 예측, 각종 부문별·지역별 상세 분석, 경쟁 상황, 주요 기업 개요 등의 정보를 정리하여 전해드립니다.
목차
제1장 서문
제2장 조사 방법
제3장 경제적 및 기타 프로젝트 특유의 고려사항
제4장 거시경제 지표
제5장 주요 요약
제6장 소개
제7장 경쟁 구도
제8장 기업 개요
분석 개요
Abb
CR Technology Systems
Delta Star
Dijitalist Marketing
Eaton
EKOS Eclectic
Electroinnova
General Electric
LS Electric
Meidensha
Powell Industries
Schneider Electric
Siemens
TGOOD
Unit Electrical Engineering
WEG
제9장 밸류체인 분석
제10장 SWOT 분석
제11장 세계의 E-House 시장
제12장 E-House 유형별 시장 기회
제13장 구성요소별 시장 기회
제14장 전압 유형별 시장 기회
제15장 용도별 시장 기회
제16장 E-House 규모별 시장 기회
제17장 재료 유형별 시장 기회
제18장 기능 유형별 시장 기회
제19장 북미의 E-House 시장 기회
제20장 유럽의 E-House 시장 기회
제21장 아시아의의 E-House 시장 기회
제22장 중동 및 북아프리카의 E-House 시장 기회
제23장 라틴아메리카의 E-House 시장 기회
제24장 세계 기타 지역의 E-House 시장 기회
제25장 표형식 데이터
제26장 기업·단체 리스트
제27장 맞춤화의 기회
제28장 ROOTS 구독 서비스
제29장 저자 상세
ksm
영문 목차
영문목차
E-House Market Overview
As per Roots Analysis, the global e-house market size is estimated to grow from USD 1.69 billion in the current year to USD 3.57 billion by 2035, at a CAGR of 7.04% during the forecast period, till 2035.
The opportunity for e-house market has been distributed across the following segments:
Type of E-House
Fixed E-House
Mobile Substation
Type of Component
Busway
Control Panel
HVAC System (Heating, Ventilation, and Air Conditioning)
Switchgear
Transformer
UPS
Others
Type of Voltage
Low (Less than 1KV)
Medium (1KV- 35 KV)
High (More than 35 KV)
Type of Applications
Utilities
Industrial
Chemicals
Mining & Minerals
Oil & Gas
Others
E-House Size
Small
Medium
Large
Type of Material
Composite
Concrete
Steel
Type of Feature
Customized
Modular
Smart
Geographical Regions
North America
US
Canada
Mexico
Other North American countries
Europe
Austria
Belgium
Denmark
France
Germany
Ireland
Italy
Netherlands
Norway
Russia
Spain
Sweden
Switzerland
UK
Other European countries
Asia
China
India
Japan
Singapore
South Korea
Other Asian countries
Latin America
Brazil
Chile
Colombia
Venezuela
Other Latin American countries
Middle East and North Africa
Egypt
Iran
Iraq
Israel
Kuwait
Saudi Arabia
UAE
Other MENA countries
Rest of the World
Australia
New Zealand
Other countries
E-HOUSE MARKET: GROWTH AND TRENDS
The increasing need for sustainable and energy-efficient power solutions has created new possibilities for the e-house market. E-Houses, commonly referred to as electronic houses, seamlessly integrate cutting-edge technology, renewable energy, and energy-efficient systems to foster an environmentally friendly living experience. These structures vary in form, from compact modular designs to larger fully customizable options, accommodating various lifestyles and preferences.
E-houses generally harness a blend of renewable energy sources and traditional grid connections, ensuring a dependable and sustainable power supply, often enabling them to function independently from the grid. In addition, E-Houses provide a quick project solution, facilitating rapid implementation and addressing diverse project challenges while promoting sustainability objectives.
Companies like Siemens and ABB offer these modular, plug-and-play solutions tailored to meet the specific power distribution requirements of various industries and applications, marking a significant move towards a more environmentally friendly and advanced future. Moreover, continuous technological advancements in the E-house sector, including the integration of renewable energy sources like solar and wind, present industries with the opportunity to adopt cleaner and more sustainable options. Further, features such as sophisticated monitoring and control systems aimed at optimizing energy consumption and improving grid stability are anticipated to be incorporated, enhancing the overall performance of E-houses. With continuous innovation and adoption, the e-houses market is projected to experience significant growth during the forecast period.
E-HOUSE MARKET: KEY SEGMENTS
Market Share by Type of E-House
Based on type of e-house, the global e-house market is segmented into fixed E-House and mobile substation. According to our estimates, currently, mobile substation segment captures the majority share of the market. Additionally, this segment is anticipated to witness a relatively higher CAGR during the forecast period, owing to its high flexibility in transportation and ease of installation.
Market Share by Type of Component
Based on type of component, the e-house market is segmented into busway, control panel, HVAC system, switchgear, transformer, ups and others. According to our estimates, currently, switchgear segment captures the majority of the market. This can be attributed to its essential function in e-house, which is to protect electrical infrastructure from damage caused by inconsistent power supply. However, UPS segment is projected to experience the highest growth rate among the various components due to its role in providing uninterrupted power supply for industrial applications.
Market Share by Type of Voltage
Based on type of voltage, the e-house market is segmented into low voltage, medium voltage and high voltage. According to our estimates, currently, medium voltage segment captures the majority share of the market. This growth can be attributed to the increasing use of e-house across various sectors, such as mining, oil and gas, renewable energy, and utilities. It is important to note that medium voltage e-houses are most commonly found in these industries and can significantly contribute to market growth.
Market Share by Applications
Based on applications, the e-house market is segmented into industrial and utilities (chemicals, mining & minerals, oil & gas and others). According to our estimates, currently, industrial segment captures the majority share of the market. This can be attributed to the significant need for a reliable power supply in several industries, including oil and gas, mining, and manufacturing.
Market Share by E-House Size
Based on e-house size, the e-house market is segmented into small, medium and large. According to our estimates, currently, medium e-house captures the majority share of the market. This can be attributed to the fact that medium e-houses are adaptable and commonly utilized, as they can serve a diverse array of utilities and industrial needs.
Market Share by Type of Material
Based on type of material, the e-house market is segmented into composite, concrete and steel. According to our estimates, currently, steel segment captures the majority share of the market and is projected to experience the highest compound annual growth rate (CAGR) during the forecast period. This trend is linked to its exceptional structural integrity and durability, which are crucial for e-houses to endure extreme environmental conditions and heavy loads. Additionally, the scalability of steel is noteworthy, allowing for easy adjustments in size and complexity of the e-house as needed.
Market Share by Type of Feature
Based on type of feature, the e-house market is segmented into customized, modular and smart. According to our estimates, currently, modular segment captures the majority share of the market. This can be attributed to the fact that modular solution provides multiple benefits, such as efficient space utilization, adaptability, shorter construction timelines, and cost efficiency.
Market Share by Geographical Regions
Based on geographical regions, the e-house market is segmented into North America, Europe, Asia, Latin America, Middle East and North Africa, and the rest of the world. According to our estimates, currently, Asia captures the majority share of the market. The key driver of growth in this region is attributed to the swift industrialization and urbanization occurring in countries like China and India. Additionally, the increasing demand for electricity is a significant contributing factor.
Example Players in E-house Market
ABB
CR Technology Systems
Delta Star
Dijitalist Marketing
Eaton
EKOS Eclectic
Electroinnova
General Electric
LS Electric
Meidensha
Powell Industries
Schneider Electric
Siemens
TGOOD
Unit Electrical Engineering
WEG
E-HOUSE MARKET: RESEARCH COVERAGE
The report on the e-house market features insights on various sections, including:
Market Sizing and Opportunity Analysis: An in-depth analysis of the e-house market, focusing on key market segments, including [A] type of e-house, [B] type of component, [C] type of voltage, [D] applications, [E] E-house size, [F] type of material and [G] geographical regions.
Competitive Landscape: A comprehensive analysis of the companies engaged in the e-house market, based on several relevant parameters, such as [A] year of establishment, [B] company size, [C] location of headquarters and [D] ownership structure.
Company Profiles: Elaborate profiles of prominent players engaged in the e-house market, providing details on [A] location of headquarters, [B] company size, [C] company mission, [D] company footprint, [E] management team, [F] contact details, [G] financial information, [H] operating business segments, [I] service / product portfolio, [J] moat analysis, [K] recent developments, and an informed future outlook.
SWOT Analysis: An insightful SWOT framework, highlighting the strengths, weaknesses, opportunities and threats in the domain. Additionally, it provides Harvey ball analysis, highlighting the relative impact of each SWOT parameter.
KEY QUESTIONS ANSWERED IN THIS REPORT
How many companies are currently engaged in e-house market?
Which are the leading companies in this market?
What factors are likely to influence the evolution of this market?
What is the current and future market size?
What is the CAGR of this market?
How is the current and future market opportunity likely to be distributed across key market segments?
REASONS TO BUY THIS REPORT
The report provides a comprehensive market analysis, offering detailed revenue projections of the overall market and its specific sub-segments. This information is valuable to both established market leaders and emerging entrants.
Stakeholders can leverage the report to gain a deeper understanding of the competitive dynamics within the market. By analyzing the competitive landscape, businesses can make informed decisions to optimize their market positioning and develop effective go-to-market strategies.
The report offers stakeholders a comprehensive overview of the market, including key drivers, barriers, opportunities, and challenges. This information empowers stakeholders to stay abreast of market trends and make data-driven decisions to capitalize on growth prospects.
ADDITIONAL BENEFITS
Complimentary Excel Data Packs for all Analytical Modules in the Report
15% Free Content Customization
Detailed Report Walkthrough Session with Research Team
Free Updated report if the report is 6-12 months old or older
TABLE OF CONTENTS
1. PREFACE
1.1. Introduction
1.2. Market Share Insights
1.3. Key Market Insights
1.4. Report Coverage
1.5. Key Questions Answered
1.6. Chapter Outlines
2. RESEARCH METHODOLOGY
2.1. Chapter Overview
2.2. Research Assumptions
2.3. Database Building
2.3.1. Data Collection
2.3.2. Data Validation
2.3.3. Data Analysis
2.4. Project Methodology
2.4.1. Secondary Research
2.4.1.1. Annual Reports
2.4.1.2. Academic Research Papers
2.4.1.3. Company Websites
2.4.1.4. Investor Presentations
2.4.1.5. Regulatory Filings
2.4.1.6. White Papers
2.4.1.7. Industry Publications
2.4.1.8. Conferences and Seminars
2.4.1.9. Government Portals
2.4.1.10. Media and Press Releases
2.4.1.11. Newsletters
2.4.1.12. Industry Databases
2.4.1.13. Roots Proprietary Databases
2.4.1.14. Paid Databases and Sources
2.4.1.15. Social Media Portals
2.4.1.16. Other Secondary Sources
2.4.2. Primary Research
2.4.2.1. Introduction
2.4.2.2. Types
2.4.2.2.1. Qualitative
2.4.2.2.2. Quantitative
2.4.2.3. Advantages
2.4.2.4. Techniques
2.4.2.4.1. Interviews
2.4.2.4.2. Surveys
2.4.2.4.3. Focus Groups
2.4.2.4.4. Observational Research
2.4.2.4.5. Social Media Interactions
2.4.2.5. Stakeholders
2.4.2.5.1. Company Executives (CXOs)
2.4.2.5.2. Board of Directors
2.4.2.5.3. Company Presidents and Vice Presidents
2.4.2.5.4. Key Opinion Leaders
2.4.2.5.5. Research and Development Heads
2.4.2.5.6. Technical Experts
2.4.2.5.7. Subject Matter Experts
2.4.2.5.8. Scientists
2.4.2.5.9. Doctors and Other Healthcare Providers
2.4.2.6. Ethics and Integrity
2.4.2.6.1. Research Ethics
2.4.2.6.2. Data Integrity
2.4.3. Analytical Tools and Databases
3. ECONOMIC AND OTHER PROJECT SPECIFIC CONSIDERATIONS
3.1. Forecast Methodology
3.1.1. Top-Down Approach
3.1.2. Bottom-Up Approach
3.1.3. Hybrid Approach
3.2. Market Assessment Framework
3.2.1. Total Addressable Market (TAM)
3.2.2. Serviceable Addressable Market (SAM)
3.2.3. Serviceable Obtainable Market (SOM)
3.2.4. Currently Acquired Market (CAM)
3.3. Forecasting Tools and Techniques
3.3.1. Qualitative Forecasting
3.3.2. Correlation
3.2.3. Regression
3.3.4. Time Series Analysis
3.3.5. Extrapolation
3.3.6. Convergence
3.3.7. Forecast Error Analysis
3.3.8. Data Visualization
3.3.9. Scenario Planning
3.3.10. Sensitivity Analysis
3.4. Key Considerations
3.4.1. Demographics
3.4.2. Market Access
3.4.3. Reimbursement Scenarios
3.4.4. Industry Consolidation
3.5. Robust Quality Control
3.6. Key Market Segmentations
3.7 Limitations
4. MACRO-ECONOMIC INDICATORS
4.1. Chapter Overview
4.2. Market Dynamics
4.2.1. Time Period
4.2.1.1. Historical Trends
4.2.1.2. Current and Forecasted Estimates
4.2.2. Currency Coverage
4.2.2.1. Overview of Major Currencies Affecting the Market
4.2.2.2. Impact of Currency Fluctuations on the Industry
4.2.3. Foreign Exchange Impact
4.2.3.1. Evaluation of Foreign Exchange Rates and Their Impact on Market
4.2.3.2. Strategies for Mitigating Foreign Exchange Risk
4.2.4. Recession
4.2.4.1. Historical Analysis of Past Recessions and Lessons Learnt
4.2.4.2. Assessment of Current Economic Conditions and Potential Impact on the Market
4.2.5. Inflation
4.2.5.1. Measurement and Analysis of Inflationary Pressures in the Economy
4.2.5.2. Potential Impact of Inflation on the Market Evolution
4.2.6. Interest Rates
4.2.6.1. Overview of Interest Rates and Their Impact on the Market
4.2.6.2. Strategies for Managing Interest Rate Risk
4.2.7. Commodity Flow Analysis
4.2.7.1. Type of Commodity
4.2.7.2. Origins and Destinations
4.2.7.3. Values and Weights
4.2.7.4. Modes of Transportation
4.2.8. Global Trade Dynamics
4.2.8.1. Import Scenario
4.2.8.2. Export Scenario
4.2.9. War Impact Analysis
4.2.9.1. Russian-Ukraine War
4.2.9.2. Israel-Hamas War
4.2.10. COVID Impact / Related Factors
4.2.10.1. Global Economic Impact
4.2.10.2. Industry-specific Impact
4.2.10.3. Government Response and Stimulus Measures
4.2.10.4. Future Outlook and Adaptation Strategies
4.2.11. Other Indicators
4.2.11.1. Fiscal Policy
4.2.11.2. Consumer Spending
4.2.11.3. Gross Domestic Product (GDP)
4.2.11.4. Employment
4.2.11.5. Taxes
4.2.11.6. R&D Innovation
4.2.11.7. Stock Market Performance
4.2.11.8. Supply Chain
4.2.11.9. Cross-Border Dynamics
5. EXECUTIVE SUMMARY
6. INTRODUCTION
6.1. Chapter Overview
6.2. Overview of E-House
6.2.1. E-House Size
6.2.2. Type of Component
6.2.3. Type of Voltage
6.2.4. Applications
6.2.5. Type of Materials
6.2.6. Type of Features
6.3. Future Perspective
7. COMPETITIVE LANDSCAPE
7.1. Chapter Overview
7.2. E-House: Overall Market Landscape
7.2.1. Analysis by Year of Establishment
7.2.2. Analysis by Company Size
7.2.3. Analysis by Location of Headquarters
7.2.4. Analysis by Ownership Structure
8. COMPANY PROFILES
8.1. Chapter Overview
8.1.1. Abb*
8.1.2. Company Overview
8.1.3. Company Mission
8.1.4. Company Footprint
8.1.5. Management Team
8.1.6. Contact Details
8.1.7. Financial Performance
8.1.8. Operating Business Segments
8.1.9. Service / Product Portfolio (project specific)
8.1.10. MOAT Analysis
8.1.11. Recent Developments and Future Outlook
information in the public domain
8.2. CR Technology Systems
8.3. Delta Star
8.4. Dijitalist Marketing
8.5. Eaton
8.6. EKOS Eclectic
8.7. Electroinnova
8.8. General Electric
8.9. LS Electric
8.10. Meidensha
8.11. Powell Industries
8.12. Schneider Electric
8.13. Siemens
8.14. TGOOD
8.15. Unit Electrical Engineering
8.16. WEG
9. VALUE CHAIN ANALYSIS
10. SWOT ANALYSIS
11. GLOBAL E-HOUSE MARKET
11.1. Chapter Overview
11.2. Key Assumptions and Methodology
11.3. Trends Disruption Impacting Market
11.4. Global E-House Market, Historical Trends (Since 2019) and Forecasted Estimates (Till 2035)
11.5. Multivariate Scenario Analysis
11.5.1. Conservative Scenario
11.5.2. Optimistic Scenario
11.6. Key Market Segmentations
12. MARKET OPPORTUNITIES BASED ON TYPE OF E-HOUSE
12.1. Chapter Overview
12.2. Key Assumptions and Methodology
12.3. Revenue Shift Analysis
12.4. Market Movement Analysis
12.5. Penetration-Growth (P-G) Matrix
12.6. E-House Market for Fixed E-House: Historical Trends (Since 2019) and Forecasted Estimates (Till 2035)
12.7. E-House Market for Mobile Substation: Historical Trends (Since 2019) and Forecasted Estimates (Till 2035)
12.8. Data Triangulation and Validation
13. MARKET OPPORTUNITIES BASED ON TYPE OF COMPONENT
13.1. Chapter Overview
13.2. Key Assumptions and Methodology
13.3. Revenue Shift Analysis
13.4. Market Movement Analysis
13.5. Penetration-Growth (P-G) Matrix
13.6. E-House Market for Busway: Historical Trends (Since 2019) and Forecasted Estimates (Till 2035)
13.7. E-House Market for Control Panel: Historical Trends (Since 2019) and Forecasted Estimates (Till 2035)
13.8. E-House Market for HVAC System: Historical Trends (Since 2019) and Forecasted Estimates (Till 2035)
13.9. E-House Market for Switchgear: Historical Trends (Since 2019) and Forecasted Estimates (Till 2035)
13.10. E-House Market for Transformer: Historical Trends (Since 2019) and Forecasted Estimates (Till 2035)
13.11. E-House Market for UPS: Historical Trends (Since 2019) and Forecasted Estimates (Till 2035)
13.12. E-House Market for Others: Historical Trends (Since 2019) and Forecasted Estimates (Till 2035)
13.13. Data Triangulation and Validation
14. MARKET OPPORTUNITIES BASED ON TYPE OF VOLTAGE
14.1. Chapter Overview
14.2. Key Assumptions and Methodology
14.3. Revenue Shift Analysis
14.4. Market Movement Analysis
14.5. Penetration-Growth (P-G) Matrix
14.6. E-House Market for Low: Historical Trends (Since 2019) and Forecasted Estimates (Till 2035)
14.7. E-House Market for Medium: Historical Trends (Since 2019) and Forecasted Estimates (Till 2035)
14.8. E-House Market for High: Historical Trends (Since 2019) and Forecasted Estimates (Till 2035)
14.9. Data Triangulation and Validation
15. MARKET OPPORTUNITIES BASED ON TYPE OF APPLICATIONS
15.1. Chapter Overview
15.2. Key Assumptions and Methodology
15.3. Revenue Shift Analysis
15.4. Market Movement Analysis
15.5. Penetration-Growth (P-G) Matrix
15.6. E-House Market for Utilities: Historical Trends (Since 2019) and Forecasted Estimates (Till 2035)
15.7. E-House Market for Industries: Historical Trends (Since 2019) and Forecasted Estimates (Till 2035)
15.8. Data Triangulation and Validation
16. MARKET OPPORTUNITIES BASED ON E-HOUSE SIZE
16.1. Chapter Overview
16.2. Key Assumptions and Methodology
16.3. Revenue Shift Analysis
16.4. Market Movement Analysis
16.5. Penetration-Growth (P-G) Matrix
16.6. E-House Market for Small Size: Historical Trends (Since 2019) and Forecasted Estimates (Till 2035)
16.7. E-House Market for Medium Size: Historical Trends (Since 2019) and Forecasted Estimates (Till 2035)
16.8. E-House Market for Large Size: Historical Trends (Since 2019) and Forecasted Estimates (Till 2035)
16.9. Data Triangulation and Validation
17. MARKET OPPORTUNITIES BASED ON TYPE OF MATERIAL
17.1. Chapter Overview
17.2. Key Assumptions and Methodology
17.3. Revenue Shift Analysis
17.4. Market Movement Analysis
17.5. Penetration-Growth (P-G) Matrix
17.6. E-House Market for Composite: Historical Trends (Since 2019) and Forecasted Estimates (Till 2035)
17.7. E-House Market for Concrete: Historical Trends (Since 2019) and Forecasted Estimates (Till 2035)
17.8. E-House Market for Steel: Historical Trends (Since 2019) and Forecasted Estimates (Till 2035)
17.9. Data Triangulation and Validation
18. MARKET OPPORTUNITIES BASED ON TYPE OF FEATURE
18.1. Chapter Overview
18.2. Key Assumptions and Methodology
18.3. Revenue Shift Analysis
18.4. Market Movement Analysis
18.5. Penetration-Growth (P-G) Matrix
18.6. E-House Market for Customized: Historical Trends (Since 2019) and Forecasted Estimates (Till 2035)
18.7. E-House Market for Modular: Historical Trends (Since 2019) and Forecasted Estimates (Till 2035)
18.8. E-House Market for Smart: Historical Trends (Since 2019) and Forecasted Estimates (Till 2035)
18.9. Data Triangulation and Validation
19 MARKET OPPORTUNITIES FOR E-HOUSE IN NORTH AMERICA
19.1. Chapter Overview
19.2. Key Assumptions and Methodology
19.3. Revenue Shift Analysis
19.4. Market Movement Analysis
19.5. Penetration-Growth (P-G) Matrix
19.6. E-House Market in North America: Historical Trends (Since 2019) and Forecasted Estimates (Till 2035)
19.6.1. E-House Market in the US: Historical Trends (Since 2019) and Forecasted Estimates (Till 2035)
19.6.2. E-House Market in Canada: Historical Trends (Since 2019) and Forecasted Estimates (Till 2035)
19.6.3. E-House Market in Mexico: Historical Trends (Since 2019) and Forecasted Estimates (Till 2035)
19.6.4. E-House Market in Other North American Countries: Historical Trends (Since 2019) and Forecasted Estimates (Till 2035)
19.7. Data Triangulation and Validation
20. MARKET OPPORTUNITIES FOR E-HOUSE IN EUROPE
20.1. Chapter Overview
20.2. Key Assumptions and Methodology
20.3. Revenue Shift Analysis
20.4. Market Movement Analysis
20.5. Penetration-Growth (P-G) Matrix
20.6. E-House Market in Europe: Historical Trends (Since 2019) and Forecasted Estimates (Till 2035)
20.6.1. E-House Market in the Austria: Historical Trends (Since 2019) and Forecasted Estimates (Till 2035)
20.6.2. E-House Market in Belgium: Historical Trends (Since 2019) and Forecasted Estimates (Till 2035)
20.6.3. E-House Market in Denmark: Historical Trends (Since 2019) and Forecasted Estimates (Till 2035)
20.6.4. E-House Market in France: Historical Trends (Since 2019) and Forecasted Estimates (Till 2035)
20.6.5. E-House Market in Germany: Historical Trends (Since 2019) and Forecasted Estimates (Till 2035)
20.6.6. E-House Market in Ireland: Historical Trends (Since 2019) and Forecasted Estimates (Till 2035)
20.6.7. E-House Market in Italy: Historical Trends (Since 2019) and Forecasted Estimates (Till 2035)
20.6.8. E-House Market in Netherlands: Historical Trends (Since 2019) and Forecasted Estimates (Till 2035)
20.6.9. E-House Market in Norway: Historical Trends (Since 2019) and Forecasted Estimates (Till 2035)
20.6.10. E-House Market in Russia: Historical Trends (Since 2019) and Forecasted Estimates (Till 2035)
20.6.11. E-House Market in Spain: Historical Trends (Since 2019) and Forecasted Estimates (Till 2035)
20.6.12. E-House Market in Sweden: Historical Trends (Since 2019) and Forecasted Estimates (Till 2035)
20.6.13. E-House Market in Switzerland: Historical Trends (Since 2019) and Forecasted Estimates (Till 2035)
20.6.14. E-House Market in the UK: Historical Trends (Since 2019) and Forecasted Estimates (Till 2035)
20.6.15. E-House Market in Other European Countries: Historical Trends (Since 2019) and Forecasted Estimates (Till 2035)
20.7. Data Triangulation and Validation
21. MARKET OPPORTUNITIES FOR E-HOUSE IN ASIA
21.1. Chapter Overview
21.2. Key Assumptions and Methodology
21.3. Revenue Shift Analysis
21.4. Market Movement Analysis
21.5. Penetration-Growth (P-G) Matrix
21.6. E-House Market in Asia: Historical Trends (Since 2019) and Forecasted Estimates (Till 2035)
21.6.1. E-House Market in China: Historical Trends (Since 2019) and Forecasted Estimates (Till 2035)
21.6.2. E-House Market in India: Historical Trends (Since 2019) and Forecasted Estimates (Till 2035)
21.6.3. E-House Market in Japan: Historical Trends (Since 2019) and Forecasted Estimates (Till 2035)
21.6.4. E-House Market in Singapore: Historical Trends (Since 2019) and Forecasted Estimates (Till 2035)
21.6.5. E-House Market in South Korea: Historical Trends (Since 2019) and Forecasted Estimates (Till 2035)
21.6.6. E-House Market in Other Asian Countries: Historical Trends (Since 2019) and Forecasted Estimates (Till 2035)
21.7. Data Triangulation and Validation
22. MARKET OPPORTUNITIES FOR E-HOUSE IN MIDDLE EAST AND NORTH AFRICA
22.1. Chapter Overview
22.2. Key Assumptions and Methodology
22.3. Revenue Shift Analysis
22.4. Market Movement Analysis
22.5. Penetration-Growth (P-G) Matrix
22.6. E-House Market in Middle East and North Africa (MENA): Historical Trends (Since 2019) and Forecasted Estimates (Till 2035)
22.6.1. E-House Market in Egypt: Historical Trends (Since 2019) and Forecasted Estimates (Till 205)
22.6.2. E-House Market in Iran: Historical Trends (Since 2019) and Forecasted Estimates (Till 2035)
22.6.3. E-House Market in Iraq: Historical Trends (Since 2019) and Forecasted Estimates (Till 2035)
22.6.4. E-House Market in Israel: Historical Trends (Since 2019) and Forecasted Estimates (Till 2035)
22.6.5. E-House Market in Kuwait: Historical Trends (Since 2019) and Forecasted Estimates (Till 2035)
22.6.6. E-House Market in Saudi Arabia: Historical Trends (Since 2019) and Forecasted Estimates (Till 2035)
22.6.7. E-House Market in United Arab Emirates (UAE): Historical Trends (Since 2019) and Forecasted Estimates (Till 2035)
22.6.8. E-House Market in Other MENA Countries: Historical Trends (Since 2019) and Forecasted Estimates (Till 2035)
22.7. Data Triangulation and Validation
23. MARKET OPPORTUNITIES FOR E-HOUSE IN LATIN AMERICA
23.1. Chapter Overview
23.2. Key Assumptions and Methodology
23.3. Revenue Shift Analysis
23.4. Market Movement Analysis
23.5. Penetration-Growth (P-G) Matrix
23.6. E-House Market in Latin America: Historical Trends (Since 2019) and Forecasted Estimates (Till 2035)
23.6.1. E-House Market in Argentina: Historical Trends (Since 2019) and Forecasted Estimates (Till 2035)
23.6.2. E-House Market in Brazil: Historical Trends (Since 2019) and Forecasted Estimates (Till 2035)
23.6.3. E-House Market in Chile: Historical Trends (Since 2019) and Forecasted Estimates (Till 2035)
23.6.4. E-House Market in Colombia Historical Trends (Since 2019) and Forecasted Estimates (Till 2035)
23.6.5. E-House Market in Venezuela: Historical Trends (Since 2019) and Forecasted Estimates (Till 2035)
23.6.6. E-House Market in Other Latin American Countries: Historical Trends (Since 2019) and Forecasted Estimates (Till 2035)
23.7. Data Triangulation and Validation
24. MARKET OPPORTUNITIES FOR E-HOUSE IN REST OF THE WORLD
24.1. Chapter Overview
24.2. Key Assumptions and Methodology
24.3. Revenue Shift Analysis
24.4. Market Movement Analysis
24.5. Penetration-Growth (P-G) Matrix
24.6. E-House Market in Rest of the World: Historical Trends (Since 2019) and Forecasted Estimates (Till 2035)
24.6.1. E-House Market in Australia: Historical Trends (Since 2019) and Forecasted Estimates (Till 2035)
24.6.2. E-House Market in New Zealand: Historical Trends (Since 2019) and Forecasted Estimates (Till 2035)