탄소발자국 관리 시장 : 산업 동향과 세계 예측(-2035년) - 구성요소별, 전개 방식별, 조직 규모별, 업계별, 지역별
Carbon Footprint Management Market, Till 2035: Distribution by Type of Component, Type of Deployment, Organization Size, Type of Vertical, and Geographical Regions: Industry Trends and Global Forecast
상품코드:1771410
리서치사:Roots Analysis
발행일:On Demand Report
페이지 정보:영문 198 Pages
라이선스 & 가격 (부가세 별도)
한글목차
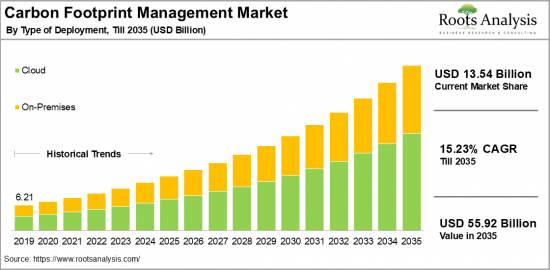
세계 탄소발자국 관리 시장 규모는 2035년까지 예측 기간 동안 15.23%의 CAGR로 현재 135억 4,000만 달러에서 2035년에는 559억 2,000만 달러로 성장할 것으로 예상됩니다.
탄소발자국 관리 시장 기회 : 부문별
구성요소별
솔루션
서비스
전개 유형별
클라우드
온프레미스
조직 규모별
법인기업
중견기업
중소기업
산업별
에너지 유틸리티
금융 서비스
정부기관
IT 및 통신
제조
주거 및 상업용 건물
교통 및 물류
지역별
북미
미국
캐나다
멕시코
기타 북미 국가
유럽
오스트리아
벨기에
덴마크
프랑스
독일
아일랜드
이탈리아
네덜란드
노르웨이
러시아
스페인
스웨덴
스위스
영국
기타 유럽 국가
아시아
중국
인도
일본
싱가포르
한국
기타 아시아 국가
라틴아메리카
브라질
칠레
콜롬비아
베네수엘라
기타 라틴아메리카 국가
중동 및 북아프리카
이집트
이란
이라크
이스라엘
쿠웨이트
사우디아라비아
아랍에미리트
기타 중동 및 북아프리카 국가
세계 기타 지역
호주
뉴질랜드
기타 국가
탄소발자국 관리 시장 : 성장과 동향
탄소발자국이라는 용어는 일상적인 인간 활동에 의해 배출되는 온실가스의 총량을 의미합니다. 탄소발자국을 측정하기 위해 고안된 첨단 소프트웨어와 도구를 활용하여 기술적으로 관리할 수 있습니다. 이러한 관리 솔루션에는 온실가스 배출량 추적, 감축, 상쇄 등의 프로세스가 포함됩니다. 또한, 이러한 종합적인 솔루션은 기업, 정부 및 개인이 기후 변화 대응에 참여할 수 있도록 지원하며, 감축 목표 설정, 전략 실행, 진행 상황 모니터링 및 보고 등을 가능하게 합니다.
그 결과, 탄소발자국 관리 시장은 전 세계적으로 괄목할 만한 성장세를 보이고 있습니다. 유엔 보고서에 따르면, 전체 온실가스 배출량의 약 82%를 차지하는 107개국이 법과 국가 기후행동계획 등의 정책을 통해 탄소 배출량 제로 목표를 설정하고 있습니다.
이는 주로 정부의 정책이 탄소 배출량에 큰 영향을 미치기 때문이며, 재생에너지 도입 촉진, 배출 기준 도입, 지속가능한 노력의 추진 등을 통해 배출량 감축이 이루어지기 때문입니다. 또한, 유엔환경계획(UNEP)은 각국에 2030년까지 온실가스 배출량을 42% 감축할 것을 촉구하고 있습니다.
이는 정부의 정책이 탄소 배출량에 큰 영향을 미치는 것이 주요 이유입니다. 규제와 정책을 통해 재생에너지 촉진, 배출 기준 설정, 다양한 산업에서 지속가능한 관행의 육성 등을 통해 감축 효과를 기대할 수 있습니다. 또한, 유엔환경계획(UNEP)은 각국이 2030년까지 온실가스 배출량을 42% 감축하는 것을 목표로 삼아야 한다고 권고하고 있습니다.
이러한 배경에서 각국 정부는 이러한 목표를 달성하기 위해 기후 변화 완화 전략을 시행하고 있으며, 온실가스 배출량 관리에 집중하고 있는 것으로 나타났습니다. 또한, 탄소 추적을 위한 디지털 도구 및 AI와 같은 기술 도입에 대한 관심 증가, 탄소 회계 서비스에 대한 수요 증가는 탄소발자국 관리 시장의 성장을 촉진하는 주요 요인으로 작용하고 있습니다.
세계의 탄소발자국 관리 시장을 조사했으며, 시장 개요와 배경, 시장 영향요인 분석, 시장 규모 추정과 예측, 각종 부문별·지역별 상세 분석, 경쟁 상황, 주요 기업 개요 등의 정보를 정리하여 전해드립니다.
목차
섹션 I : 보고서 개요
제1장 서문
제2장 조사 방법
제3장 시장 역학
제4장 거시경제 지표
섹션 II : 정성적 인사이트
제5장 주요 요약
제6장 소개
제7장 규제 시나리오
섹션 III : 시장 개요
제8장 주요 기업의 종합적 데이터베이스
제9장 경쟁 구도
제10장 화이트 스페이스 분석
제11장 기업 경쟁력 분석
제12장 탄소발자국 관리 시장의 스타트업 생태계
섹션 IV : 기업 개요
제13장 기업 개요
분석 개요
Accuvio
Carbon Footprint
Carbon Trust
Dakota Software
Eco Tack
Enablon
EnergyCap
ENGIE
Enviance
Envirsoft
ESP
IBM
Intelex
Isometrix
Locus Technologies
NativeEnergy
ProcessMap
Salesforce
SAP
Schneider
Trinity
섹션 V : 시장 동향
제14장 메가트렌드 분석
제15장 미충족 수요 분석
제16장 특허 분석
제17장 최근 동향
섹션 VI : 시장 기회 분석
제18장 세계의 탄소발자국 관리 시장
제19장 구성요소별 시장 기회
제20장 전개 방식별 시장 기회
제21장 조직 규모별 시장 기회
제22장 업종별 시장 기회
제23장 북미의 탄소발자국 관리 시장 기회
제24장 유럽의 탄소발자국 관리 시장 기회
제25장 아시아의 탄소발자국 관리 시장 기회
제26장 중동 및 북아프리카의 탄소발자국 관리 시장 기회
제27장 라틴아메리카의 탄소발자국 관리 시장 기회
제28장 세계 기타 지역의 탄소발자국 관리 시장 기회
제29장 인접 시장 분석
섹션 VII : 전략 툴
제30장 승리의 열쇠가 되는 전략
제31장 Porter's Five Forces 분석
제32장 SWOT 분석
제33장 밸류체인 분석
제34장 ROOTS의 전략 제안
섹션 VIII : 기타 독점적 인사이트
제35장 1차 조사를 통한 인사이트
제36장 보고서 결론
섹션 IX : 부록
제37장 표형식 데이터
제38장 기업·단체 리스트
제39장 맞춤화의 기회
제40장 ROOTS 구독 서비스
제41장 저자 상세
ksm
영문 목차
영문목차
Carbon Footprint Management Market Overview
As per Roots Analysis, the global carbon footprint management market size is estimated to grow from USD 13.54 billion in the current year to USD 55.92 billion by 2035, at a CAGR of 15.23% during the forecast period, till 2035.
The opportunity for carbon footprint management market has been distributed across the following segments:
Type of Component
Solution
Service
Type of Deployment
Cloud
On-Premises
Organization Size
Corporate Enterprises
Mid-Tier Enterprises
Small Business
Type of Vertical
Energy Utilities
Financial Service
Government
IT and Telecom
Manufacturing
Residential and Commercial Buildings
Transportation and Logistics
Geographical Regions
North America
US
Canada
Mexico
Other North American countries
Europe
Austria
Belgium
Denmark
France
Germany
Ireland
Italy
Netherlands
Norway
Russia
Spain
Sweden
Switzerland
UK
Other European countries
Asia
China
India
Japan
Singapore
South Korea
Other Asian countries
Latin America
Brazil
Chile
Colombia
Venezuela
Other Latin American countries
Middle East and North Africa
Egypt
Iran
Iraq
Israel
Kuwait
Saudi Arabia
UAE
Other MENA countries
Rest of the World
Australia
New Zealand
Other countries
CARBON FOOTPRINT MANAGEMENT MARKET: GROWTH AND TRENDS
The term "carbon footprint" refers to the overall quantity of greenhouse gases produced by everyday human activities. Through the use of technology, this can be managed with advanced software and tools designed for measuring carbon footprints. These management solutions encompass tracking, reducing, and offsetting greenhouse gas emissions. Additionally, these comprehensive solutions help businesses, governments, and individuals participate in combating climate change by establishing reduction targets, implementing strategies, and monitoring as well as reporting on progress.
Consequently, the market for carbon footprint management is experiencing significant growth worldwide. A report from the UN indicates that approximately 107 countries, responsible for about 82% of greenhouse gas emissions, have committed to net-zero targets either through legislation or policies, such as national climate action plans.
This is largely because government policies have a considerable impact on carbon emissions; regulations and incentives can lead to reductions by promoting renewable energy, imposing emission standards, and fostering sustainable practices across various industries. Additionally, the UN Environmental Program (UNEP) suggests that nations should aim to reduce greenhouse gas emissions by 42% by the year 2030.
As a result, governments are implementing climate change mitigation strategies to achieve these objectives, indicating a focus on managing greenhouse gas emissions. Moreover, the increasing emphasis on the integration of technology, including digital tools and AI for carbon tracking, as well as the rising demand for carbon accounting services, are key drivers for the growth of carbon footprint management market during the forecast period.
CARBON FOOTPRINT MANAGEMENT MARKET: KEY SEGMENTS
Market Share by Type of Component
Based on type of component, the global carbon footprint management market is segmented into solutions and service. According to our estimates, currently, the service segment captures the majority share of the market. This can be attributed to the increasing demand for consulting training alongside the need for cost-effective operational and implementation support.
However, the solutions segment is expected to grow at a relatively higher CAGR during the forecast period. This growth can be attributed to fact that these tools assist organizations in efficiently monitoring, analyzing, and reporting their carbon emissions. Additionally, software solutions facilitate real-time emissions tracking across different operations, offering valuable insights for minimizing carbon emissions and aiding in compliance with regulatory reporting requirements.
Market Share by Type of Deployment
Based on type of deployment, the carbon footprint management market is segmented into cloud and on-premises. According to our estimates, currently, lithium captures the majority of the market. Additionally, this segment is likely to grow at a higher CAGR during the forecast period. This can be attributed to the widespread adoption of cloud-based carbon footprint management software and services.
These solutions offer secure and cost-effective tools for tracking carbon emissions and reliable support. Further, their flexibility, scalability, and ease of implementation is fueling the expansion of this market
Market Share by Organization Size
Based on organization size, the carbon footprint management market is segmented into corporate enterprises, mid-tier enterprises, and small businesses. According to our estimates, currently, corporate enterprise segment captures the majority share of the market. This can be attributed to their complicated operations, extensive emissions, and growing demands from investors. Carbon management solutions are essential for their operations in fulfilling ESG requirements.
However, small businesses segment is expected to experience the highest compound annual growth rate (CAGR) during the forecast period, owing to the strict regulatory compliance and government pressure that urge companies to invest in carbon offset initiatives and adopt effective practices for minimizing carbon emissions.
Market Share by Type of Vertical
Based on type of vertical, the carbon footprint management market is segmented into energy utilities, financial services, government, IT and telecom, manufacturing, residential and commercial buildings, and transportation and logistics. According to our estimates, currently, energy and utilities segment captures the majority share of the market. However, the manufacturing sector is expected to grow at a higher compound annual growth rate (CAGR) during the forecast period.
Market Share by Geographical Regions
Based on geographical regions, the carbon footprint management market is segmented into North America, Europe, Asia, Latin America, Middle East and North Africa, and the rest of the world. According to our estimates, currently, North America captures the majority share of the market. However, the market in Asia is expected to grow at a higher compound annual growth rate (CAGR) during the forecast period. This can be attributed to the rapid industrial development and urbanization in the region, which have resulted in high carbon emissions. To mitigate emissions, developing nations are increasingly investing in carbon footprint management solutions and services.
Example Players in Carbon Footprint Management Market
Accuvio
Carbon Footprint
Carbon Trust
Dakota Software
Eco Tack
Enablon
EnergyCap
ENGIE
Enviance
Envirsoft
ESP
IBM
Intelex
Isometrix
Locus Technologies
NativeEnergy
ProcessMap
Salesforce
SAP
Schneider
Trinity
CARBON FOOTPRINT MANAGEMENT MARKET: RESEARCH COVERAGE
The report on the carbon footprint management market features insights on various sections, including:
Market Sizing and Opportunity Analysis: An in-depth analysis of the carbon footprint management market, focusing on key market segments, including [A] type of component, [B] type of deployment, [C] organization size, [D] type of vertical, and [E] geographical regions.
Competitive Landscape: A comprehensive analysis of the companies engaged in the carbon footprint management market, based on several relevant parameters, such as [A] year of establishment, [B] company size, [C] location of headquarters and [D] ownership structure.
Company Profiles: Elaborate profiles of prominent players engaged in the carbon footprint management market, providing details on [A] location of headquarters, [B] company size, [C] company mission, [D] company footprint, [E] management team, [F] contact details, [G] financial information, [H] operating business segments, [I] service / product portfolio, [J] moat analysis, [K] recent developments, and an informed future outlook.
Megatrends: An evaluation of ongoing megatrends in the carbon footprint management industry.
Patent Analysis: An insightful analysis of patents filed / granted in the carbon footprint management domain, based on relevant parameters, including [A] type of patent, [B] patent publication year, [C] patent age and [D] leading players.
Recent Developments: An overview of the recent developments made in the carbon footprint management market, along with analysis based on relevant parameters, including [A] year of initiative, [B] type of initiative, [C] geographical distribution and [D] most active players.
Porter's Five Forces Analysis: An analysis of five competitive forces prevailing in the carbon footprint management market, including threats of new entrants, bargaining power of buyers, bargaining power of suppliers, threats of substitute products and rivalry among existing competitors.
SWOT Analysis: An insightful SWOT framework, highlighting the strengths, weaknesses, opportunities and threats in the domain. Additionally, it provides Harvey ball analysis, highlighting the relative impact of each SWOT parameter.
Value Chain Analysis: A comprehensive analysis of the value chain, providing information on the different phases and stakeholders involved in the carbon footprint management domain.
KEY QUESTIONS ANSWERED IN THIS REPORT
How many companies are currently engaged in carbon footprint management market?
Which are the leading companies in this market?
What factors are likely to influence the evolution of this market?
What is the current and future market size?
What is the CAGR of this market?
How is the current and future market opportunity likely to be distributed across key market segments?
REASONS TO BUY THIS REPORT
The report provides a comprehensive market analysis, offering detailed revenue projections of the overall market and its specific sub-segments. This information is valuable to both established market leaders and emerging entrants.
Stakeholders can leverage the report to gain a deeper understanding of the competitive dynamics within the market. By analyzing the competitive landscape, businesses can make informed decisions to optimize their market positioning and develop effective go-to-market strategies.
The report offers stakeholders a comprehensive overview of the market, including key drivers, barriers, opportunities, and challenges. This information empowers stakeholders to stay abreast of market trends and make data-driven decisions to capitalize on growth prospects.
ADDITIONAL BENEFITS
Complimentary Excel Data Packs for all Analytical Modules in the Report
15% Free Content Customization
Detailed Report Walkthrough Session with Research Team
Free Updated report if the report is 6-12 months old or older
TABLE OF CONTENTS
SECTION I: REPORT OVERVIEW
1. PREFACE
1.1. Introduction
1.2. Market Share Insights
1.3. Key Market Insights
1.4. Report Coverage
1.5. Key Questions Answered
1.6. Chapter Outlines
2. RESEARCH METHODOLOGY
2.1. Chapter Overview
2.2. Research Assumptions
2.3. Database Building
2.3.1. Data Collection
2.3.2. Data Validation
2.3.3. Data Analysis
2.4. Project Methodology
2.4.1. Secondary Research
2.4.1.1. Annual Reports
2.4.1.2. Academic Research Papers
2.4.1.3. Company Websites
2.4.1.4. Investor Presentations
2.4.1.5. Regulatory Filings
2.4.1.6. White Papers
2.4.1.7. Industry Publications
2.4.1.8. Conferences and Seminars
2.4.1.9. Government Portals
2.4.1.10. Media and Press Releases
2.4.1.11. Newsletters
2.4.1.12. Industry Databases
2.4.1.13. Roots Proprietary Databases
2.4.1.14. Paid Databases and Sources
2.4.1.15. Social Media Portals
2.4.1.16. Other Secondary Sources
2.4.2. Primary Research
2.4.2.1. Introduction
2.4.2.2. Types
2.4.2.2.1. Qualitative
2.4.2.2.2. Quantitative
2.4.2.3. Advantages
2.4.2.4. Techniques
2.4.2.4.1. Interviews
2.4.2.4.2. Surveys
2.4.2.4.3. Focus Groups
2.4.2.4.4. Observational Research
2.4.2.4.5. Social Media Interactions
2.4.2.5. Stakeholders
2.4.2.5.1. Company Executives (CXOs)
2.4.2.5.2. Board of Directors
2.4.2.5.3. Company Presidents and Vice Presidents
2.4.2.5.4. Key Opinion Leaders
2.4.2.5.5. Research and Development Heads
2.4.2.5.6. Technical Experts
2.4.2.5.7. Subject Matter Experts
2.4.2.5.8. Scientists
2.4.2.5.9. Doctors and Other Healthcare Providers
2.4.2.6. Ethics and Integrity
2.4.2.6.1. Research Ethics
2.4.2.6.2. Data Integrity
2.4.3. Analytical Tools and Databases
3. MARKET DYNAMICS
3.1. Forecast Methodology
3.1.1. Top-Down Approach
3.1.2. Bottom-Up Approach
3.1.3. Hybrid Approach
3.2. Market Assessment Framework
3.2.1. Total Addressable Market (TAM)
3.2.2. Serviceable Addressable Market (SAM)
3.2.3. Serviceable Obtainable Market (SOM)
3.2.4. Currently Acquired Market (CAM)
3.3. Forecasting Tools and Techniques
3.3.1. Qualitative Forecasting
3.3.2. Correlation
3.3.3. Regression
3.3.4. Time Series Analysis
3.3.5. Extrapolation
3.3.6. Convergence
3.3.7. Forecast Error Analysis
3.3.8. Data Visualization
3.3.9. Scenario Planning
3.3.10. Sensitivity Analysis
3.4. Key Considerations
3.4.1. Demographics
3.4.2. Market Access
3.4.3. Reimbursement Scenarios
3.4.4. Industry Consolidation
3.5. Robust Quality Control
3.6. Key Market Segmentations
3.7. Limitations
4. MACRO-ECONOMIC INDICATORS
4.1. Chapter Overview
4.2. Market Dynamics
4.2.1. Time Period
4.2.1.1. Historical Trends
4.2.1.2. Current and Forecasted Estimates
4.2.2. Currency Coverage
4.2.2.1. Overview of Major Currencies Affecting the Market
4.2.2.2. Impact of Currency Fluctuations on the Industry
4.2.3. Foreign Exchange Impact
4.2.3.1. Evaluation of Foreign Exchange Rates and Their Impact on Market
4.2.3.2. Strategies for Mitigating Foreign Exchange Risk
4.2.4. Recession
4.2.4.1. Historical Analysis of Past Recessions and Lessons Learnt
4.2.4.2. Assessment of Current Economic Conditions and Potential Impact on the Market
4.2.5. Inflation
4.2.5.1. Measurement and Analysis of Inflationary Pressures in the Economy
4.2.5.2. Potential Impact of Inflation on the Market Evolution
4.2.6. Interest Rates
4.2.6.1. Overview of Interest Rates and Their Impact on the Market
4.2.6.2. Strategies for Managing Interest Rate Risk
4.2.7. Commodity Flow Analysis
4.2.7.1. Type of Commodity
4.2.7.2. Origins and Destinations
4.2.7.3. Values and Weights
4.2.7.4. Modes of Transportation
4.2.8. Global Trade Dynamics
4.2.8.1. Import Scenario
4.2.8.2. Export Scenario
4.2.9. War Impact Analysis
4.2.9.1. Russian-Ukraine War
4.2.9.2. Israel-Hamas War
4.2.10. COVID Impact / Related Factors
4.2.10.1. Global Economic Impact
4.2.10.2. Industry-specific Impact
4.2.10.3. Government Response and Stimulus Measures
4.2.10.4. Future Outlook and Adaptation Strategies
4.2.11. Other Indicators
4.2.11.1. Fiscal Policy
4.2.11.2. Consumer Spending
4.2.11.3. Gross Domestic Product (GDP)
4.2.11.4. Employment
4.2.11.5. Taxes
4.2.11.6. R&D Innovation
4.2.11.7. Stock Market Performance
4.2.11.8. Supply Chain
4.2.11.9. Cross-Border Dynamics
SECTION II: QUALITATIVE INSIGHTS
5. EXECUTIVE SUMMARY
6. INTRODUCTION
6.1. Chapter Overview
6.2. Overview of Carbon Footprint Management Market