보체 억제제 시장 : 업계 동향과 세계 예측 - 적응 질환별, 치료 영역별, 분자 유형별, 표적 경로별, 치료 유형별, 투여 경로별, 주요 지역별
Complement Inhibitors Market: Industry Trends and Global Forecasts - Distribution by Target Disease Indication, Therapeutic Area, Type of Molecule, Target Pathway, Type of Therapy, Route of Administration, Key Geographical Regions
상품코드:1771289
리서치사:Roots Analysis
발행일:2025년 07월
페이지 정보:영문 131 Pages
라이선스 & 가격 (부가세 별도)
한글목차
세계 보체 억제제 시장 : 개요
세계 보체 억제제 시장 규모는 2035년까지 예측 기간 동안 15%의 연평균 복합 성장률(CAGR)로 확대되어 현재 91억 달러에서 2035년까지 78억 달러로 성장할 것으로 예측됩니다.
시장 세분화에서는 시장 규모 및 기회 분석을 다음과 같은 매개 변수로 구분합니다.
적응증 질환
비정형 용혈성 요독증 증후군
심장이식 거부반응
한랭응집소병
COVID-19
전신성 중증 근무력증
길랑-바레 증후군
유전성 혈관성 부종
시신경 척수염
발작성 야간 헤모글로빈뇨증
치료 영역
심혈관 질환
유전성 질환
혈액 및 혈관 질환
감염성 질환
신경 질환
신경근 질환
분자 유형
생물학적 제제
저분자
목표 경로
대체 경로
고전 경로
렉틴 경로
종단 경로
치료 유형
단독요법
병용요법
투여 경로
정맥 투여
경구
피하
주요 지역
북미
유럽
아시아태평양
세계 보체 억제제 시장 : 성장 및 동향
19세기에 면역 체계의 일부로 발견된 보체계는 조직 복구 및 항상성 유지에 관여하여 여러 감염에 대한 방어의 최전선을 담당하고 있습니다. 이 완전한 과정은 주로 간에서 생성되는 수용체 및 조절인자를 포함한 여러 수용성 및 표면 결합성 보체 성분을 포함하는 복잡하고 고도로 조절된 단백질의 집합체와 관련이 있습니다. 보체 치료제의 기반이 되는 이들 단백질은 여러 면역세포와 상호 작용하여 항체의 작용을 보완합니다. 또한, 보체는 세포사멸 세포의 제거를 촉진하고 세포의 생존을 조절하여 건강한 생물의 항상성 유지에 기여합니다. 그러나 보체의 활성화가 불충분할 경우 병원균이 증식하고, 보체계 인자의 억제가 일어나 결국 질병에 이르게 될 수 있습니다. 그 결과, 보체의 활성화를 억제하는 치료제가 개발되어 조직의 염증을 억제하고 외래 항원과 자가 항원 모두에 대한 적응 면역반응을 조절하는 데 도움을 주고 있습니다.
임상 연구 장려, 신규 제약 기업의 진입, 질병에 대한 초점 확대, 혁신적인 방식으로 C5를 넘어서는 것에 대한 열망 증가에 힘입어 보체 억제제 시장은 향후 10년동안 더 많은 의약품 후보가 승인 및 출시되어 의약품 시장에서 더 많은 점유율을 차지할 것으로 예측됩니다.
세계 보체 억제제 시장 : 주요 인사이트
이 보고서는 세계 보체 억제제 시장의 현황을 조사하고 업계 내 잠재적인 성장 기회를 파악합니다. 본 보고서의 주요 조사 결과는 다음과 같습니다.
전 세계 여러 제약회사에서 여러 질환의 치료를 위해 보완체계를 표적으로 하는 190개 이상의 치료제 후보물질이 연구되고 있습니다.
보체 치료제의 대부분(-80%)은 현재 임상시험 중이고, 파이프라인 후보물질의 75% 이상이 생물학적 제제, 특히 단클론 항체입니다.
북미가 허브로 부상하고 있으며, 약 50%의 개발 기업이 존재합니다. 시장은 현재 중견기업(전체 이해관계자 수의 37%)이 주도하고 있습니다. 흥미롭게도, 진출기업의 15%는 여러 치료 영역에서 이러한 치료제를 개발하는 대형 제약사들입니다.
현재까지 850건 이상의 보체치료제 관련 임상시험이 등록되어 있으며, 이들 임상시험의 대부분(53%)은 유럽을 기반으로 한 다양한 임상기관에서 진행되고 있습니다.
임상 연구 활동은 등록된 시험 수로 볼 때, 일정 기간 동안 CAGR 21%로 증가한 것으로 보고되고 있습니다. 등록된 총 임상시험 수 중 약 60%가 이미 종료되었으며, 24%의 임상시험은 참가자를 모집하고 있습니다.
보체치료제에 초점을 맞춘 다양한 논문들이 저명한 저자별 영향력 있는 학술지에 발표되고 있습니다.
최근 몇 년 동안 보체치료학 관련 논문 수가 점차 증가하고 있으며, 일정 기간 동안 1,460건의 연구 논문이 발표되었습니다.
차세대 보체치료제에 초점을 맞춘 논문의 40% 이상이 2019년 이후 발표된 논문입니다.
Frontiers in Immunology는 가장 인기 있는 저널로, 감염질환(21%)과 신장질환(16%)에 초점을 맞춘 논문이 대부분을 차지합니다.
새로운 보체 치료제의 혁신을 위한 지속적인 연구 노력을 지원하기 위해 8억 달러 이상의 보조금이 다양한 기관에 수여되었습니다. 보조금의 약 20%는 국립암연구소(National Cancer Institute)가 지원했습니다.
보체 치료제 관련 특허 출원 건수가 증가하고 있는 것은 이해관계자들의 관심이 높아지고 있으며, 이 분야에 대한 광범위한 연구개발 노력이 이루어지고 있음을 보여줍니다.
보체치료제 관련 특허는 이 분야에서 3,490건 이상 출원/등록되었습니다. 이 숫자는 이 분야에서 끊임없이 이루어지고 있는 연구개발 노력에 기인합니다.
보체 치료제 관련 특허 출원의 60% 이상은 다양한 업계 진입자들이 출원하고 있으며, AbbVie와 Alexion Pharmaceuticals를 예로 들 수 있습니다.
이는 주로 최근 출원된 특허의 인용 건수가 적기 때문입니다.
최대 45% 이상의 파트너십이 제품 개발 및 상용화를 목적으로 체결되었습니다. 또한, 대부분의 계약은 북미에 기반을 둔 기업(66%)이 체결한 것으로 나타났습니다.
이 분야의 기회를 발견한 여러 투자자들은 총 74건의 펀딩을 통해 총 142억 달러를 투자했습니다.
이 분야에 종사하는 기업의 약 40%는 주로 세컨더리 제공 제품을 통해 자금을 조달하고 있습니다. 또한, 자금 조달 사례의 70%가 북미에 본사를 둔 기업들에 의해 이루어졌습니다.
대형 제약사들은 자체 제품 개발부터 전략적 투자까지 다양한 노력을 기울이고 있습니다.
유망한 개발 파이프라인과 유망한 임상 연구 성과로 인해 보완 치료제 시장은 향후 10년간 연평균 15% 이상 성장할 것으로 예측됩니다.
이 기회는 다양한 표적 경로, 치료제의 유형, 투여 경로, 주요 지리적 지역에 잘 분산되어 있는 것으로 보입니다.
보체 억제제 시장 진출기업 사례
Amgen
CSL Behring
Innovent Biologics
Novartis
Regeneron
Roche
Sanofi
Takeda
UCB
1차 조사 개요
본 조사에서 제시된 의견과 통찰력은 여러 이해관계자와의 논의를 통해 도출된 것입니다. 이 보고서에는 다음과 같은 업계 관계자들과의 인터뷰에 대한 자세한 기록이 포함되어 있습니다.
의사, A사
혈액종양내과 전문의, B사
C사 수석 과학 컨설턴트
신장내과 임상의사 및 과학자, D사
신장내과 교수, E사
세계의 보체 억제제(Complement Inhibitors) 시장에 대해 조사했으며, 시장 개요와 함께 적응증별/치료 영역별/분자 유형별/표적 경로별/치료 유형별/투여 경로별 동향, 지역별 동향, 시장 진출기업 프로파일 등의 정보를 전해드립니다.
목차
제1장 서문
제2장 주요 요약
제3장 서론
보체계 개요
보체계에 관여하는 면역 세포
보체계 특징
보체계 기능
항상성과 스트레스 상태에서 보체의 역할
보체계 활성화
주요 보체 단백질 공급원
고전적 경로에서 보체 단백질의 기능
보체계 경로
조절 장애로 인한 보완 시스템의 결과
보체 단백질 결함에 관련된 질환
보체 치료제의 유형
보체 치료제의 한계
차세대 보체 치료제의 미래
제4장 차세대 보체 치료제 : 시장 구도
분석 조사 방법과 주요 파라미터
차세대 보체 치료제 : 개발 파이프라인
차세대 보체 치료제 : 특별 지정 약제 리스트
차세대 보체 치료제 : 개발 상황
제5장 기업 개요
Amgen
CSL Behring
Innovent Biologics
Novartis
Regeneron
Roche
Sanofi
Takeda
UCB
제6장 임상시험 분석
분석 조사 방법과 주요 파라미터
차세대 보체 치료제 : 임상시험 리스트
제7장 출판물 분석
분석 조사 방법과 주요 파라미터
차세대 보체 치료제 : 출판물 리스트
제8장 보조금 분석
분석 조사 방법과 주요 파라미터
제9장 특허 분석
분석 조사 방법과 주요 파라미터
차세대 보체 치료제 : 특허 리스트
제10장 파트너십 및 협업
차세대 보체 치료제 : 제휴·협력 리스트
제11장 자금조달과 투자 분석
차세대 보체 치료제 : 자금조달과 투자 리스트
제12장 대형 제약회사
분석 조사 방법과 주요 파라미터
파라미터 스코어 링
대형 제약회사 : 매출에 관한 정보
제13장 시장 규모 평가와 기회 분석
예측 조사 방법과 주요 파라미터
2035년까지 세계의 차세대 보체 치료제 시장
2035년까지 시판약을 대상으로 한 세계의 차세대 보체 치료제 시장
시판 의약품 제품별 판매 예측
Berinert (CSL Behring)
EMPAVELI(Apellis Pharmaceuticals)
ORLADEYO(BioCryst Pharmaceuticals)
Ruconest (Pharming)
Soliris (Alexion Pharmaceuticals)
Takhzyro (Takeda)
Ultomiris (Alexion Pharmaceuticals)
2035년까지 제III상 의약품 차세대 보체 치료제 세계 시장
제III상 의약품 제품별 판매 예측
Narsoplimab (Omeros)
REGN3918(Regeneron)
RG6107(Ruconest)
rVA576(Akari Therapeutics)
SAR445088(Sanofi)
Soliris (Alexion Pharmaceuticals)
Sutimlimab (Bioverativ)
Vilobelimab (InflaRx)
Zilucoplan (UCB)
요약 : 제III상 약제
제14장 전문가 의견
제15장 부록 1 : 도표
제16장 부록 2 : 기업 및 단체 리스트
LSH
영문 목차
영문목차
GLOBAL COMPLEMENT INHIBITORS MARKET: OVERVIEW
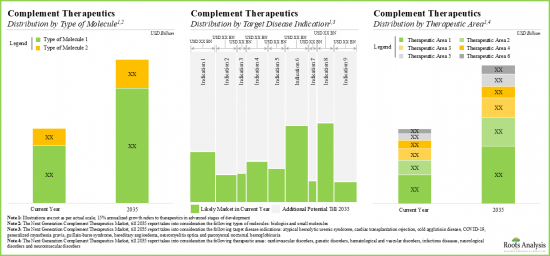
As per Roots Analysis, the global complement inhibitors market is estimated to grow from USD 9.1 billion in the current year to USD 7.8 billion by 2035, at a CAGR of 15% during the forecast period, till 2035.
The market sizing and opportunity analysis has been segmented across the following parameters:
Target Disease Indication
Atypical Hemolytic Uremic Syndrome
Cardiac Transplantation Rejection
Cold Agglutinin Disease
COVID-19
Generalized Myasthenia Gravis
Guillain-Barre Syndrome
Hereditary Angioedema
Neuromyelitis Optica
Paroxysmal Nocturnal Hemoglobinuria
Therapeutic Area
Cardiovascular Disorders
Genetic Disorders
Hematological and Vascular Disorders
Infectious Diseases
Neurological Disorders
Neuromuscular Disorders
Type of Molecule
Biologic
Small Molecule
Target Pathway
Alternate Pathway
Classical Pathway
Lectin Pathway
Terminal Pathway
Type of Therapy
Monotherapy
Combination Therapy
Route of Administration
Intravenous
Oral
Subcutaneous
Key Geographical Regions
North America
Europe
Asia-Pacific
GLOBAL COMPLEMENT INHIBITORS MARKET: GROWTH AND TRENDS
Complement system was discovered in the 19th century as a part of immune system, responsible for tissue repair and homeostasis, thereby providing first line of defense against multiple infections. This complete process is in association with a complex and highly regulated assembly of proteins which involve several soluble and surface-bound complement components, including receptors and regulators, which are primarily generated by the liver. These proteins, making the base for complement therapeutics, interact with multiple immune cells and complement the action of antibodies, which are in turn responsible for killing the infectious agents. Additionally, the complement system contributes to maintaining homeostasis in healthy organisms by facilitating the clearance of apoptotic cells and regulating cell survival. However, when complement activation is insufficient, pathogens can proliferate, and the suppression of complement regulators may occur, ultimately leading to disease. Consequently, therapeutics targeting the complement system have been developed to inhibit its activation, which helps reduce tissue inflammation and modulate the adaptive immune response to both foreign and self-antigens.
Driven by encouraging clinical research efforts, new pharmaceutical entrants, broadening of disease focus, and a rising desire to get beyond C5 with some innovative ways, the complement inhibitors market is expected to capture a significant share in the pharmaceutical market with more drug candidates getting approved and marketed over the coming decade.
GLOBAL COMPLEMENT INHIBITORS MARKET: KEY INSIGHTS
The report delves into the current state of global complement inhibitors market and identifies potential growth opportunities within industry. Some key findings from the report include:
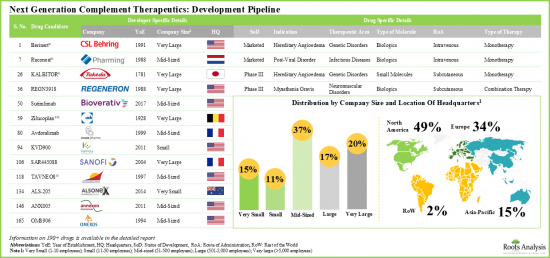
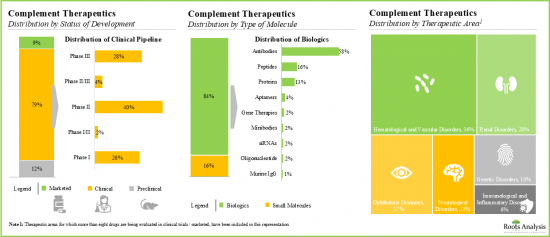
Over 190 therapeutic candidates, targeting complement system for the treatment of multiple disease indications, are being investigated by various pharmaceutical companies across the globe.
Majority (~80%) of complement therapeutics are currently being evaluated in clinical trials; more than 75% of the pipeline candidates are biologics, specifically monoclonal antibodies.
North America has emerged as the hub, featuring the presence of approximately 50% developers. The market is currently dominated by the presence of mid-sized players (37% of the total number of stakeholders). Interestingly, 15% of the players are big pharma companies engaged in the development of such therapeutics for multiple therapeutic areas.
850+ clinical trials related to complement therapeutics have been registered till date; majority (53%) of these trials were / are being conducted across various clinical sites based in Europe.
The clinical research activity, in terms of number of trials registered, is reported to have increased at a CAGR of 21%, during the given period. Of the total number of trials registered, close to 60% have already been completed, while 24% of the studies are actively recruiting participants.
A variety of articles focused on complement therapeutics have been published by eminent authors in high-impact journals.
Over the years, there has been a gradual rise in the number of publications related to complement therapeutics; 1,460 research articles were published during the given time period.
More than 40% of the articles focused on next generation complement therapeutics were published post-2019.
Frontiers in Immunology emerged to be the most popular journal with majority of the publications focused on infectious diseases (21%) and renal disorders (16%).
Grants worth over USD 800 million have been awarded to various organizations in order to support the ongoing research efforts for innovation of novel complement therapeutics. Around 20% of the grants were funded by the National Cancer Institute.
The increasing number of patents being filed for complement therapeutics is indicative of the rising interest of stakeholders and extensive R&D efforts being undertaken in this field.
Over 3,490 patents related to complement therapeutics have been filed / granted in this domain; this number can be attributed to the incessant R&D efforts being made in this domain.
More than 60% of the patent applications have been filed for complement therapeutics by various industry players; examples include AbbVie and Alexion Pharmaceuticals.
Only 4% of the patents have a significantly higher relative valuation; this is primarily because of the low number of citations of the patents filed recently.
Maximum, over 45% of the partnerships were signed for product development and commercialization purposes. Further, majority of the agreements were signed by players based in North America (66%).
Several investors, having realized the opportunity within this segment, have collectively invested a sum of ~USD 14.2 billion, across 74 funding instances.
Around 40% of the companies engaged in this domain primarily received funding through secondary offerings. Further, 70% of the funding instances were reported by players headquartered in North America.
Big pharma players have undertaken a variety of initiatives, ranging from proprietary product development to strategic investments.
With a promising development pipeline and encouraging clinical research outcomes, the complement therapeutics market is anticipated to grow at an annualized rate of more than 15%, over the next decade.
The opportunity is likely to be well distributed across various target pathways, types of therapies, routes of administration and key geographical regions.
Example Players in the Complement Inhibitors Market
Amgen
CSL Behring
Innovent Biologics
Novartis
Regeneron
Roche
Sanofi
Takeda
UCB
PRIMARY RESEARCH OVERVIEW
The opinions and insights presented in this study were influenced by discussions conducted with multiple stakeholders. The research report features detailed transcripts of interviews conducted with the following industry stakeholders:
Physician, Company A
Hematologist Oncologist, Company B
Senior Scientific Consultant, Company C
Nephrology Clinician-Scientist, Company D
Professor of Nephrology, Company E
GLOBAL COMPLEMENT INHIBITORS MARKET: RESEARCH COVERAGE
Market Sizing and Opportunity Analysis: The report features an in-depth analysis of the global complement inhibitors market, focusing on key market segments, including [A] target disease indication, [B] therapeutic area, [C] type of molecule, [D] target pathway, [E] type of therapy, [F] route of administration and [G] key geographical regions.
Market Landscape: A comprehensive evaluation of next generation complement therapeutics, considering various parameters, such as [A] status of development, [B] type of molecule, [C] type of drug, [D] biological target, [E] target pathway, [F] mechanism of action, [G] target disease indication(s), [H] therapeutic area(s), [I] route of administration, [J] type of therapy and [K] dosing frequency. Additionally, the section includes a comprehensive evaluation of players developing next generation complement therapeutics based on parameters, such as [A] year of establishment, [B] company size and [D] location of headquarters.
Company Profiles: In-depth profiles of companies engaged in the development of next generation complement therapeutics, focusing on [A] company overview, [B] financial information (if available), [C] product portfolio and [D] recent developments and an informed future outlook.
Clinical Trial Analysis: A comprehensive analysis of clinical studies of various next generation complement therapeutics, examining factors, such as [A] current trial status, [B] trial registration year, [C] trial phase, [D] enrolled patient population, [E] type of sponsor / collaborator, [F] type of study, [G] study design, [H] leading industry and non-industry players, [I] key indication(s), [J] popular therapeutics area(s), [K] type of treatment, [L] type of drug, [M] emerging focus areas and [N] regional distribution of trials.
Publication Analysis: An insightful analysis of more than 1,450 peer-reviewed, scientific articles related to research on next generation complement therapeutics, based on various relevant parameters, such as [A] year of publication, [B] emerging focus areas, [C] top authors, [D] key research journals, [E] popular indication(s) and [F] therapeutic area(s).
Grant Analysis: A detailed analysis of grants awarded to various research institutes for the projects related to next generation complement therapeutics, based on various relevant parameters, such as [A] year of grant awarded, [B] amount awarded, [C] funding institute center, [D] support period, [E] type of grant, [F] activity code while highlighting popular recipient organizations, [F] popular NIH departments, [G] study section, [H] type of recipient organization, [I] emerging focus areas of the grants, [J] purpose of grant awarded, [K] prominent program officers and [L] location of recipient organizations.
Patent Analysis: An insightful analysis of patents filed / granted for next generation complement therapeutics, based on various relevant parameters, such as [A] patent publication year, [B] type of patent, [C] geographical location, [D] CPC symbols, [E] type of applicant, [F] patent age, [G] emerging focus areas, [H] leading industry and non-industry players (in terms of number of patents granted / filed), [I] patent characteristics, [J] patent benchmarking and [K] patent valuation.
Partnerships and Collaborations: A comprehensive analysis of deals inked by stakeholders in this domain, based on several relevant parameters, such as [A] year of partnership, [B] type of partnership, [C] biological target, [D] target pathway, [E] emerging focus area, [F] type of partner, [G] popular disease indication, [H] therapeutic area and [I] geographical distribution of partnership activity.
Funding and Investments: An in-depth analysis of the fundings raised by companies engaged in complement inhibitors market, based on relevant parameters, such as [A] year of funding, [B] amount invested, [C] type of funding, [D] geographical analysis, [E] most active players and [F] most active investors.
Big Pharma Players: A comprehensive analysis of big pharma players engaged in the field of complement inhibitors market, based on several relevant parameters, such as [A] number of therapeutics under development, [B] type of molecule, [C] status of development, [D] number of therapeutic areas, [E] number of partnerships, [F] number of patents and [G] years of experience.
KEY QUESTIONS ANSWERED IN THIS REPORT
How many companies are currently engaged in this market?
Which are the leading companies in this market?
What factors are likely to influence the evolution of this market?
What is the current and future market size?
What is the CAGR of this market?
How is the current and future market opportunity likely to be distributed across key market segments?
REASONS TO BUY THIS REPORT
The report provides a comprehensive market analysis, offering detailed revenue projections of the overall market and its specific sub-segments. This information is valuable to both established market leaders and emerging entrants.
Stakeholders can leverage the report to gain a deeper understanding of the competitive dynamics within the market. By analyzing the competitive landscape, businesses can make informed decisions to optimize their market positioning and develop effective go-to-market strategies.
The report offers stakeholders a comprehensive overview of the market, including key drivers, barriers, opportunities, and challenges. This information empowers stakeholders to stay abreast of market trends and make data-driven decisions to capitalize on growth prospects.
ADDITIONAL BENEFITS
Complimentary Excel Data Packs for all Analytical Modules in the Report
15% Free Content Customization
Detailed Report Walkthrough Session with Research Team
Free Updated report if the report is 6-12 months old or older
TABLE OF CONTENTS
1. PREFACE
1.1. Scope of the Report
1.2. Research Methodology
1.2.1. Research Assumptions
1.2.2. Project Methodology
1.2.3. Forecast Methodology
1.2.4. Robust Quality Control
1.2.5. Key Considerations
1.2.5.1. Demographics
1.2.5.2. Economic Factors
1.2.5.3. Government Regulations
1.2.5.4. Supply Chain
1.2.5.5. COVID Impact / Related Factors
1.2.5.6. Market Access
1.2.5.7. Healthcare Policies
1.2.5.8. Industry Consolidation
1.3 Key Questions Answered
1.4. Chapter Outlines
2. EXECUTIVE SUMMARY
3. INTRODUCTION
3.1. Overview of Complement System
3.2. Immune Cells Involved in Complement System
3.3. Characteristics of Complement System
3.4. Functions of Complement System
3.5. Role of Complement in Homeostasis and Stress Conditions
3.6. Activation of Complement System
3.6.1. Steps in Complement Activation
3.7. Sources of Key Complement Proteins
3.8. Functions of Complement Proteins of Classical Pathway
3.9. Pathways of Complement System
3.9.1. Classical Pathway
3.9.2. Lectin Pathway
3.9.3. Alternative Pathway
3.9.4. Terminal Pathway
3.10. Consequences of a Dysregulated Complement System
3.11. Diseases related to Defects in Complement Proteins
3.12. Types of Complement Therapeutics
3.13. Limitations of Complement Therapeutics
3.14. Future of Next Generation Complement Therapeutics
4. NEXT GENERATION COMPLEMENT THERAPEUTICS: MARKET LANDSCAPE
4.1. Analysis Methodology and Key Parameters
4.2. Next Generation Complement Therapeutics: Development Pipeline
4.2.1. Analysis by Status of Development
4.2.2. Analysis by Type of Molecule
4.2.3. Analysis by Status of Development and Type of Molecule
4.2.4. Analysis by Type of Drug
4.2.5. Analysis by Biological Target
4.2.6. Analysis by Target Pathway
4.2.7. Analysis by Mechanism of Action
4.2.8. Analysis by Mechanism of Action and Target Pathway
4.2.9. Analysis by Target Disease Indication(s)
4.2.10. Analysis by Status of Development and Target Disease Indication(s)
4.2.11. Analysis by Therapeutic Area
4.2.12. Analysis by Therapeutic Area and Type of Molecule
4.2.13. Analysis by Route of Administration
4.2.14. Analysis by Type of Therapy
4.2.15. Analysis by Dosing Frequency
4.2.16. Grid Analysis: Type of Therapy, Type of Molecule, Route of Administration and Mechanism of Action
4.3. Next Generation Complement Therapeutics: List of Drugs with Special Designations
4.3.1. Analysis by Special Designation
4.4. Next Generation Complement Therapeutics: Developer Landscape
4.4.1. Analysis by Year of Establishment
4.4.2. Analysis by Company Size
4.4.3. Analysis by Region of Headquarters
4.4.4. Analysis by Company Size and Region of Headquarters
4.4.5. Leading Players: Analysis by Number of Therapeutics
5. COMPANY PROFILES
5.1. Amgen
5.1.1. Company Overview
5.1.2. Financial Information
5.1.3. Product Portfolio
5.1.4. Recent Developments and Future Outlook
5.2. CSL Behring
5.2.1. Company Overview
5.2.2. Financial Information
5.2.3. Product Portfolio
5.2.4. Recent Developments and Future Outlook
5.3. Innovent Biologics
5.3.1. Company Overview
5.3.2. Financial Information
5.3.3. Product Portfolio
5.3.4. Recent Developments and Future Outlook
5.4. Novartis
5.4.1. Company Overview
5.4.2. Financial Information
5.4.3. Product Portfolio
5.4.4. Recent Developments and Future Outlook
5.5. Regeneron
5.5.1. Company Overview
5.5.2. Financial Information
5.5.3. Product Portfolio
5.5.4. Recent Developments and Future Outlook
5.6. Roche
5.6.1. Company Overview
5.6.2. Financial Information
5.6.3. Product Portfolio
5.6.4. Recent Developments and Future Outlook
5.7. Sanofi
5.7.1. Company Overview
5.7.2. Financial Information
5.7.3. Product Portfolio
5.7.4. Recent Developments and Future Outlook
5.8. Takeda
5.8.1. Company Overview
5.8.2. Financial Information
5.8.3. Product Portfolio
5.8.4. Recent Developments and Future Outlook
5.9. UCB
5.9.1. Company Overview
5.9.2. Financial Information
5.9.3. Product Portfolio
5.9.4. Recent Developments and Future Outlook
6. CLINICAL TRIAL ANALYSIS
6.1. Analysis Methodology and Key Parameters
6.2. Next Generation Complement Therapeutics: List of Clinical Trials
6.2.1. Analysis by Trial Status
6.2.2. Cumulative Analysis by Trial Registration Year
6.2.3. Analysis by Trial Registration Year and Status
6.2.4. Analysis by Trial Phase
6.2.5. Analysis by Trial Phase and Patients Enrolled
6.2.6. Analysis by Trial Registration Year and Patients Enrolled
6.2.7. Analysis by Type of Sponsor / Collaborator
6.2.8. Analysis by Type of Study
6.2.9. Analysis by Study Design
6.2.10. Most Active Industry Players: Analysis by Number of Trials
6.2.11. Most Active Non-Industry Players: Analysis by Number of Trials
6.2.12. Analysis by Disease Indication
6.2.13. Most Popular Therapeutic Areas: Analysis by Number of Trials
6.2.14. Analysis by Type of Treatment
6.2.15. Analysis by Type of Drug
6.2.16. Word Cloud Analysis: Emerging Focus Areas
6.2.17. Analysis by Top Indications and Phase of the Trial
6.2.18. Analysis by Top Indications and Leading Industry Players
6.2.19. Analysis by Trial Location
6.2.20. Analysis by Geography and Trial Status
7. PUBLICATION ANALYSIS
7.1. Analysis Methodology and Key Parameters
7.2. Next Generation Complement Therapeutics: List of Publications
7.2.1. Analysis by Year of Publication
7.2.2. Word Cloud Analysis: Emerging Focus Areas
7.2.3. Top Authors: Analysis by Number of Publications
7.2.4. Key Journals based on Number of Publications
7.2.5. Key Journals based on Impact Factor
7.2.6. Popular Indications based on Number of Publications
7.2.7. Popular Therapeutic Areas based on Number of Publications
8. GRANT ANALYSIS
8.1. Analysis Methodology and Key Parameters
8.1.1. Analysis by Year of Grants Awarded
8.1.2. Analysis by Amount Awarded
8.1.3. Analysis by Funding Institute Center
8.1.4. Analysis by Support Period
8.1.5. Analysis by Funding Institute Center and Support Period
8.1.6. Analysis by Type of Grant
8.1.7. Analysis by Activity Code
8.1.8. Popular Recipient Organizations: Analysis by Number of Grants
8.1.9. Popular Recipient Organizations: Analysis by Amount Awarded
8.1.10. Popular NIH Departments: Analysis by Number of Grants
8.1.11. Analysis by Study Section
8.1.12. Analysis by Type of Recipient Organization
8.1.13. Word Cloud Analysis: Emerging Focus Areas
8.1.14. Analysis by Purpose of Grant
8.1.15. Prominent Program Officers: Analysis by Number of Grants
8.1.16. Analysis by Location of Recipient Organizations
9. PATENT ANALYSIS
9.1. Analysis Methodology and Key Parameters
9.2. Next Generation Complement Therapeutics: List of Patents
9.2.1. Analysis by Patent Publication Year
9.2.2. Analysis of Year-wise Granted Patents
9.2.3. Analysis by Type of Patent
9.2.4. Analysis by Granted Patents and Patent Applications
9.2.5. Analysis by Geography
9.2.6. Analysis by CPC Symbols
9.2.7. Analysis by Type of Applicant
9.2.8. Analysis of Patents by Age
9.2.9. Word Cloud Analysis: Emerging Focus Areas
9.2.10. Leading Industry Players: Analysis by Number of Patents
9.2.11. Leading Non-Industry Players: Analysis by Number of Patents
9.2.12. Leading Individual Assignees: Analysis by Number of Patents
9.2.13. Leading Players: Benchmarking by Patent Characteristics (CPC Symbols)
9.2.14. Patent Valuation: Analysis Methodology and Parameters
9.2.15. Patent Valuation: Analysis by Relative Valuation
10. PARTNERSHIPS AND COLLABORATIONS
10.1. Next Generation Complement Therapeutics: List of Partnerships and Collaborations
10.1.1. Analysis by Year-wise Trend of Partnership
10.1.2. Analysis by Type of Partnership
10.1.3. Analysis by Year and Type of Partnership
10.1.4. Most Popular Drug: Analysis by Number of Partnerships
10.1.5. Analysis by Biological Target
10.1.6. Analysis by Target Pathway
10.1.7. Word Cloud Analysis: Emerging Focus Areas
10.1.8. Analysis by Drug and Type of Partnership
10.1.9. Analysis by Type of Partner
10.1.10. Analysis by Popular Disease Indication
10.1.11. Analysis by Popular Disease Indication and Type of Partnership
10.1.12. Analysis by Therapeutic Area
10.1.13. Analysis by Therapeutic Area and Type of Partnership
10.1.14. Regional Analysis of Partnerships
10.1.15. Intercontinental and Intracontinental Agreements
11. FUNDING AND INVESTMENT ANALYSIS
11.1. Next Generation Complement Therapeutics: List of Funding and Investments
11.1.1. Cumulative Year-wise Trend
11.1.2. Analysis by Amount Invested per Year
11.1.3. Analysis by Type of Funding and Year of Establishment
11.1.4. Analysis of Instances by Type of Funding
11.1.5. Analysis of Amount Invested by Type of Funding
11.1.6. Analysis by Year, Type of Funding and Amount Invested
11.1.7. Most Active Investors: Analysis by Number of Instances
11.1.8. Most Active Players: Analysis by Number of Funding Instances
11.1.9. Most Active Players: Analysis by Amount Raised
11.1.10. Analysis of Amount by Drug
11.1.11. Analysis of Number of Instances by Drug
11.1.12. Summary of Investments
12. BIG PHARMA PLAYERS
12.1. Analysis Methodology and Key Parameters
12.2. Scoring of Parameters
12.3. Big Pharma Players: Information on Revenues Generated
12.3.1. Analysis by Supplier Strength
12.3.2. Analysis by Portfolio Strength
12.3.3. Analysis by Portfolio Diversity
12.3.4. Benchmarking: Spider Web Analysis
12.3.5. Benchmarking: Harvey Ball Analysis
12.3.6. Benchmarking: Wind Rose Chart
13. MARKET SIZING AND OPPORTUNITY ANALYSIS
13.1. Forecast Methodology and Key Parameters
13.2. Global Next Generation Complement Therapeutics Market, Till 2035
13.3. Global Next Generation Complement Therapeutics Market for Marketed Drugs, Till 2035
13.3.1. Next Generation Complement Therapeutics Market for Marketed Drugs, Till 2035: Distribution by Target Disease Indication
13.3.1.1. Next Generation Complement Therapeutics Market for Paroxysmal Nocturnal Hemoglobinuria, Till 2035
13.3.1.2. Next Generation Complement Therapeutics Market for Hereditary Angioedema, Till 2035
13.3.2. Next Generation Complement Therapeutics Market for Marketed Drugs, Till 2035: Distribution by Type of Molecule
13.3.2.1. Next Generation Complement Therapeutics Market for Biologics, Till 2035
13.3.2.2. Next Generation Complement Therapeutics Market for Small Molecules, Till 2035
13.3.3. Next Generation Complement Therapeutics Market for Marketed Drugs, Till 2035: Distribution by Target Pathway
13.3.3.1. Next Generation Complement Therapeutics Market for Terminal Pathway, Till 2035
13.3.3.2. Next Generation Complement Therapeutics Market for Classical Pathway, Till 2035
13.3.3.3. Next Generation Complement Therapeutics Market for Alternate Pathway, Till 2035
13.3.3.4. Next Generation Complement Therapeutics Market for Lectin Pathway, Till 2035
13.3.4. Next Generation Complement Therapeutics Market for Marketed Drugs, Till 2035: Distribution by Type of Therapy
13.3.4.1. Next Generation Complement Therapeutics Market for Monotherapy, Till 2035
13.3.4.2. Next Generation Complement Therapeutics Market for Combination Therapy, Till 2035
13.3.5. Next Generation Complement Therapeutics Market for Marketed Drugs, Till 2035: Distribution by Route of Administration
13.3.5.1. Next Generation Complement Therapeutics Market for Intravenous Drugs, Till 2035
13.3.5.2. Next Generation Complement Therapeutics Market for Subcutaneous Drugs, Till 2035
13.3.5.3. Next Generation Complement Therapeutics Market for Oral Drugs, Till 2035
13.4. Product-wise Sales Forecast for Marketed Drugs
13.4.1. Berinert (CSL Behring)
13.4.1.1. Sales Forecast (USD Billion)
13.4.2. EMPAVELI (Apellis Pharmaceuticals)
13.4.2.1. Sales Forecast (USD Billion)
13.4.3. ORLADEYO (BioCryst Pharmaceuticals)
13.4.3.1. Sales Forecast (USD Billion)
13.4.4. Ruconest (Pharming)
13.4.4.1. Sales Forecast (USD Billion)
13.4.5. Soliris (Alexion Pharmaceuticals)
13.4.5.1. Sales Forecast (USD Billion)
13.4.6. Takhzyro (Takeda)
13.4.6.1. Sales Forecast (USD Billion)
13.4.7. Ultomiris (Alexion Pharmaceuticals)
13.4.7.1. Sales Forecast (USD Billion)
13.5. Global Next Generation Complement Therapeutics Market for Phase III Drugs, Till 2035
13.5.1. Next Generation Complement Therapeutics Market for Phase III Drugs, Till 2035: Distribution by Target Disease Indication
13.5.1.1. Next Generation Complement Therapeutics Market for Atypical Hemolytic Uremic Syndrome, Till 2035
13.5.1.2. Next Generation Complement Therapeutics Market for Cardiac Transplantation Rejection, Till 2035
13.5.1.3. Next Generation Complement Therapeutics Market for Cold Agglutinin Disease, Till 2035
13.5.1.4. Next Generation Complement Therapeutics Market for COVID-19, Till 2035
13.5.1.5. Next Generation Complement Therapeutics Market for Guillain-Barre Syndrome, Till 2035
13.5.1.6. Next Generation Complement Therapeutics Market for Generalized Myasthenia Gravis, Till 2035
13.5.1.7. Next Generation Complement Therapeutics Market for Neuromyelitis Optica, Till 2035
13.5.1.8. Next Generation Complement Therapeutics Market for Paroxysmal Nocturnal Hemoglobinuria, Till 2035
13.5.2. Next Generation Complement Therapeutics Market for Phase III Drugs, Till 2035: Distribution by Therapeutic Area
13.5.2.1. Next Generation Complement Therapeutics Market for Cardiovascular Disorders, Till 2035
13.5.2.2. Next Generation Complement Therapeutics Market for Hematological and Vascular Disorders, Till 2035
13.5.2.3. Next Generation Complement Therapeutics Market for Infectious Diseases, Till 2035
13.5.2.4. Next Generation Complement Therapeutics Market for Neurological Disorders, Till 2035
13.5.2.5. Next Generation Complement Therapeutics Market for Neuromuscular Disorders, Till 2035
13.5.2.6. Next Generation Complement Therapeutics Market for Genetic Disorders, Till 2035
13.5.3. Next Generation Complement Therapeutics Market for Phase III Drugs, Till 2035: Distribution by Target Pathway
13.5.3.1. Next Generation Complement Therapeutics Market for Terminal Pathway, Till 2035
13.5.3.2. Next Generation Complement Therapeutics Market for Lectin Pathway, Till 2035
13.5.3.3. Next Generation Complement Therapeutics Market for Classical Pathway, Till 2035
13.5.4. Next Generation Complement Therapeutics Market for Phase III Drugs, Till 2035: Distribution by Type of Therapy
13.5.4.1. Next Generation Complement Therapeutics Market for Monotherapy, Till 2035
13.5.4.2. Next Generation Complement Therapeutics Market for Combination Therapy, Till 2035
13.5.5. Next Generation Complement Therapeutics Market for Phase III Drugs, Till 2035: Distribution by Route of Administration
13.5.5.1. Next Generation Complement Therapeutics Market for Intravenous Drugs, Till 2035
13.5.5.2. Next Generation Complement Therapeutics Market for Subcutaneous Drugs, Till 2035
13.5.6. Next Generation Complement Therapeutics Market for Phase III Drugs, Till 2035: Distribution by Geography
13.5.6.1. Next Generation Complement Therapeutics Market in North America, Till 2035
13.5.6.1.1. Next Generation Complement Therapeutics Market in US, Till 2035
13.5.6.1.2. Next Generation Complement Therapeutics Market in Canada, Till 2035
13.5.6.2. Next Generation Complement Therapeutics Market in Europe, Till 2035
13.5.6.2.1. Next Generation Complement Therapeutics Market in UK, Till 2035
13.5.6.2.2. Next Generation Complement Therapeutics Market in Germany, Till 2035
13.5.6.2.3. Next Generation Complement Therapeutics Market in France, Till 2035
13.5.6.2.4. Next Generation Complement Therapeutics Market in Italy, Till 2035
13.5.6.2.5. Next Generation Complement Therapeutics Market in Spain, Till 2035
13.5.6.3. Next Generation Complement Therapeutics Market in Asia Pacific, Till 2035
13.5.6.3.1. Next Generation Complement Therapeutics Market in Australia, Till 2035
13.5.6.3.2. Next Generation Complement Therapeutics Market in Japan, Till 2035
13.5.6.3.3. Next Generation Complement Therapeutics Market in China, Till 2035
13.5.6.3.4. Next Generation Complement Therapeutics Market in India, Till 2035
13.6. Product-wise Sales Forecast for Phase III Drugs