그린 수소 시장 : 산업 동향과 예측(-2035년) - 기술별, 유통 채널별, 재생 자원별, 저장별, 용도별, 생산 규모별, 순도별, 최종사용자별, 지역별
Green Hydrogen Market: Industry Trends and Global Forecasts, Till 2035: Distribution by Technology, Distribution Channel, Renewable Sources, Storage, Applications, Production Scale, Purity Level, End Users and Geography
상품코드:1721379
리서치사:Roots Analysis
발행일:On Demand Report
페이지 정보:영문 212 Pages
라이선스 & 가격 (부가세 별도)
한글목차
그린 수소 시장 개요
세계 그린수소 시장 규모는 현재 15억 달러에서 2035년까지 1,253억 달러에 달할 것으로 예상되며, 2035년까지 예측 기간 동안 연평균 49.5%의 성장률을 보일 것으로 예측됩니다.
그린 수소 시장 : 성장과 동향
수소는 지구상에 존재하는 무색의 화학원소 중 하나로 자동차 추진력, 주택 난방용 발전, 비즈니스 지원 등 다양한 부문에서 활용되고 있습니다. 그러나 기존의 수소 생산 방식은 화석연료에 크게 의존하고 있어 온실가스 배출 등 환경적 리스크를 통해 기후 변화에 크게 기여하고 있습니다. 실제로 수소는 현재 전 세계 전체 CO2 배출량의 2% 이상을 차지하고 있습니다. 이러한 우려로 인해 그린수소, 블루수소 등 보다 깨끗한 대체 수소가 시장에 등장하고 있습니다.
그린수소는 풍력, 태양광, 수력 등 신재생에너지원을 이용한 물의 전기분해로 생산됩니다. 이 과정에서 물 분자를 수소와 산소로 분해하기 때문에 온실가스를 거의 배출하지 않습니다. 그린수소는 연료전지 전기자동차(FCEV)에 전력을 공급하는 수송용 연료로서의 역할 외에도 에너지 저장 솔루션으로도 활용될 수 있습니다. 따라서 그린 수소는 산업계에 이산화탄소 배출을 줄일 수 있는 효율적이고 깨끗한 대안을 제시합니다.
또한, 그린 수소 부문의 성장은 기후 변화 대응을 위한 파리 협정에 의해 촉진되고 있습니다. 이 협정에 서명한 국가들은 청정 에너지원의 채택을 통해 온실가스 배출을 줄이기 위해 노력하고 있습니다. 그 결과, 그린수소 활용을 지원하고 전 세계적으로 다양한 그린수소 이니셔티브의 발전을 장려할 수 있는 보다 유리한 규제 환경과 시장 상황이 조성되었습니다. 청정 에너지에 대한 수요 증가와 각국의 배출량 감축 노력으로 인해 그린 수소 시장은 향후 예측 기간 동안 크게 성장할 것으로 예측됩니다.
세계의 그린 수소 시장에 대해 조사했으며, 시장 규모 추정 및 기회 분석, 경쟁 구도, 기업 프로파일, SWOT 분석 등의 정보를 전해드립니다.
목차
제1장 프로젝트 배경
제2장 조사 방법
제3장 경제적 고려사항, 기타 프로젝트 특유의 고려사항
제4장 주요 요약
제5장 그린 수소 시장 : 메가트렌드 분석
제6장 서론
제7장 그린 수소 시장 : 밸류체인 분석
제8장 경쟁 구도 : 그린 수소 시장 주요 기업
제9장 그린 수소 시장 스타트업 에코시스템
제10장 특허 분석
제11장 수요 분석
제12장 공급 분석
제13장 그린 수소 시장 총소유 비용
제14장 시장 영향 분석 : 성장 촉진요인 및 억제요인, 기회, 과제
제15장 세계의 그린 수소 시장
제16장 그린 수소 시장 : 기술별
제17장 그린 수소 시장 : 유통 채널별
제18장 그린 수소 시장 : 재생 자원별
제19장 그린 수소 시장 : 저장별
제20장 그린 수소 시장 : 용도별
제21장 그린 수소 시장 : 생산 규모별
제22장 그린 수소 시장 : 순도별
제23장 그린 수소 시장 : 최종사용자별
제24장 북미의 그린 수소 시장
제25장 유럽의 그린 수소 시장
제26장 아시아태평양의 그린 수소 시장
제27장 라틴아메리카의 그린 수소 시장
제28장 중동 및 북아프리카의 그린 수소 시장
제29장 기업 개요
본 장의 개요
그린 수소 시장 주요 기업
Air Liquide
Air Liquide
Air Products
Bloom Energy
Cummins
Enapter
ENGIE
Green Hydrogen Systems
H&R Olwerke Schindler
ITM Power
Linde
Nel ASA
Plug Power
Siemens Energy
Toshiba Energy Systems & Solutions Corporation
Uniper
제30장 Porter의 Five Forces 분석
제31장 주요 인사이트
제32장 부록 1 : 표 형식 데이터
제33장 부록 2 : 기업 및 단체 리스트
LSH
영문 목차
영문목차
Green Hydrogen Market Overview
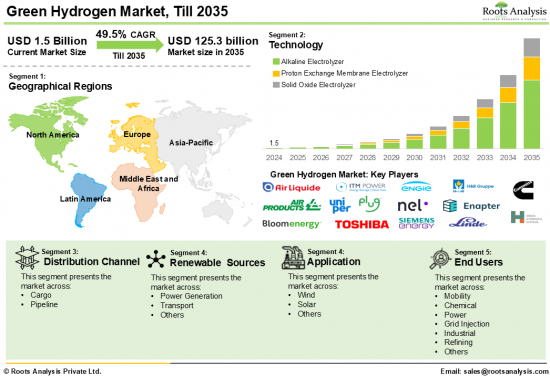
As per Roots Analysis, the global green hydrogen market size is estimated to grow from USD 1.5 billion in the current year to USD 125.3 billion by 2035, at a CAGR of 49.5% during the forecast period, till 2035.
The opportunity for green hydrogen market has been distributed across the following segments:
Technology
Alkaline Electrolyzer
Proton Exchange Membrane Electrolyzer
Solid Oxide Electrolyzer
Distribution Channel
Cargo
Pipeline
Renewable Sources
Wind
Solar
Hydrothermal
Power Thermal
Others
Storage
Compressed Gas
Liquid Hydrogen
Metal Hydrides
Underground Storage
Application
Fuel Cells
Power-to-Gas
Ammonia Production
Methanol Production
Refining
Production Scale
Small-scale (< 1 MW)
Medium-scale (1-10 MW)
Large-scale (> 10 MW)
Purity Level
Ultra-high Purity (99.999%+)
High Purity (99.99%+)
Standard Purity (99.9%+)
End Users
Mobility
Chemical
Power
Grid Injection
Industrial
Refining
Others
Geography
North America
Europe
Asia-Pacific
Latin America
Middle East and North Africa
GREEN HYDROGEN MARKET: GROWTH AND TRENDS
Hydrogen is among the colorless chemical elements found on the planet, utilized across a variety of sectors, including vehicle propulsion, electricity generation for residential heating, and supporting businesses. However, traditional hydrogen production methods heavily rely on fossil fuels, which significantly contribute to climate change through greenhouse gas emissions and other environmental risks. In fact, hydrogen currently accounts for more than 2% of the total global CO2 emissions. These concerns have led to the emergence of cleaner hydrogen alternatives in the market, such as green and blue hydrogen.
Green hydrogen is generated through the electrolysis of water using renewable energy sources like wind, solar, and hydroelectric power. This process involves splitting a water molecule into hydrogen and oxygen, resulting in minimal to no greenhouse gas emissions, thus providing numerous advantages in achieving carbon neutrality and reducing ecological impact. In addition to serving as a fuel for transportation, powering fuel cell electric vehicles (FCEVs), green hydrogen can also act as an energy storage solution. Therefore, it offers industries an efficient and cleaner option to decrease their carbon emissions.
Moreover, the growth of the green hydrogen sector has been expedited by the Paris Agreement aimed at combating climate change. Countries that have signed this agreement are dedicated to lowering greenhouse gas emissions through the adoption of cleaner energy sources. Consequently, it establishes a more favorable regulatory landscape and market conditions that can support the application of green hydrogen and encourage the development of various green hydrogen initiatives globally. With the rising demand for clean energy options and nations' commitment to reducing emissions, the green hydrogen market is expected to witness significant growth during the upcoming forecast period.
GREEN HYDROGEN MARKET: KEY SEGMENTS
Market Share by Technology
Based on technology, the global green hydrogen market is segmented into alkaline electrolyzer, proton exchange membrane electrolyzer (PEM) and solid oxide electrolyzer (SOEC). According to our estimates, currently, proton exchange membrane electrolyzers segment captures the majority share of the market. This can be attributed to the multiple benefits provided by PEM electrolyzers, including enhanced electrical efficiency and a rapid response time, enabling swift adjustments during variations in renewable energy supply.
Market Share by Distribution Channel
Based on distribution channel, the green hydrogen market is segmented into cargo and pipeline. According to our estimates, currently, pipelines segment captures the majority share of the market. This can be attributed to their economical nature and capability to transport substantial amounts of hydrogen over long distances efficiently. Additionally, the availability of hydrogen in multiple forms, such as liquid, gas, or processed variations (like methanol or ammonia), makes pipelines the most viable transportation option.
Market Share by Renewable Sources
Based on renewable sources, the green hydrogen market is segmented into wind, solar and others. According to our estimates, currently, solar renewable source segment captures the majority share of the market. This can be attributed to the declining costs of solar photovoltaic (PV) technology, owing to advancements in the PV sector, making it a more appealing choice for hydrogen generation. This financial feasibility is essential for the progress of green hydrogen, as production costs pose a significant challenge.
Market Share by Storage
Based on storage, the green hydrogen market is segmented into compressed gas, liquid hydrogen, metal hydrides and underground storage. According to our estimates, currently, liquid hydrogen segment captures the majority share of the market. This can be attributed to its high density and greater stability compared to other forms, which facilitate handling and transportation. Moreover, it can be stored in cryogenic tanks and transported using tanker trucks or ships. Additionally, for long-distance transport, liquid hydrogen is more cost-effective than gaseous hydrogen, as a liquid transport truck can accommodate more hydrogen than a gaseous tube trailer.
Market Share by Application
Based on application, the green hydrogen market is segmented into fuel cells, power-to-gas, ammonia production, methanol production and refining. According to our estimates, currently, fuel cells segment captures the majority share of the market. This is primarily because green hydrogen serves as a fuel in the automotive and transportation industries, offering an alternative to traditional fossil fuel-powered vehicles. Additionally, it can power fuel cell electric vehicles (FCEVs), providing a longer range and quicker refueling times compared to battery electric vehicles.
Market Share by Production Scale
Based on production scale, the green hydrogen market is segmented into small-scale (< 1 MW), medium-scale (1-10 MW) and large-scale (> 10 MW). According to our estimates, currently, large-scale (> 10 MW) hydrogen plants capture the majority share of the market. This can be attributed to the fact that these plants can provide energy for several industries, including transportation, chemicals, and power, while small-scale and medium-scale facilities generally cater to small communities with the potential to supply power to local grids.
Market Share by Purity Level
Based on purity level, the green hydrogen market is segmented into ultra-high purity (99.999%+), high purity (99.99%+) and standard purity (99.9%+). According to our estimates, currently, ultra-high purity green hydrogen captures the majority share of the market. This can be attributed to fact that high purity hydrogen is crucial for making a variety of industries more environmentally sustainable.
Moreover, the demand for these green hydrogen sources is on the rise across multiple sectors such as electronics, the semiconductor industry, chemical manufacturing, and energy production, as a means to combat climate change by lowering greenhouse gas emissions released into the atmosphere.
Market Share by End User
Based on end users, the green hydrogen market is segmented mobility, chemical, power, grid injection, industrial, refining, others. According to our estimates, currently, industrial end users captures the majority share of the market. This can be attributed to the fact that industries are encouraged to implement sustainable practices. Produced from renewable energy sources like wind and solar power, green hydrogen and its derivatives are emerging as promising solutions.
This aligns with sustainability initiatives in agriculture-based economies, contributing to market expansion. Additionally, since industrial end users are significant sources of greenhouse gas emissions, governments have put strict regulations in place to promote the adoption of sustainable packaging materials.
Example Players in Green Hydrogen Market
Air Liquide
Air Products
Bloom Energy
Cummins
Enapter
ENGIE
Green Hydrogen Systems
H&R Olwerke Schindler
ITM Power
Linde
Nel ASA
Plug Power
Siemens Energy
Toshiba Energy Systems & Solutions Corporation
Uniper
GREEN HYDROGEN MARKET: RESEARCH COVERAGE
The report on the green hydrogen market features insights on various sections, including:
Market Sizing and Opportunity Analysis: An in-depth analysis of the Green hydrogen market, focusing on key market segments, including [A] technology, [B] distribution channel, [C] renewable sources, [D] storage, [E] application, [F] production scale, [G] purity level, [H] end users [I] geography.
Competitive Landscape: A comprehensive analysis of the companies engaged in the Green hydrogen market, based on several relevant parameters, such as [A] year of establishment, [B] company size, [C] location of headquarters, [D] ownership structure, [E] technology, [F] distribution channel, [G] renewable sources, [H] applications, [I] production scale, [J] purity level, and [K] end users.
Company Profiles: Elaborate profiles of prominent players engaged in the Green hydrogen market, providing details on [A] location of headquarters, [B]company size, [C] company mission, [D] company footprint, [E] management team, [F] contact details, [G] financial information, [H] operating business segments, [I] Green hydrogen portfolio, [J] moat analysis, [K] recent developments, and an informed future outlook.
SWOT Analysis: An insightful SWOT framework, highlighting the strengths, weaknesses, opportunities and threats in the domain. Additionally, it provides Harvey ball analysis, highlighting the relative impact of each SWOT parameter.
KEY QUESTIONS ANSWERED IN THIS REPORT
How many companies are currently engaged in green hydrogen market?
Which are the leading companies in this market?
What is the significance of edge AI in the Green hydrogen market?
What factors are likely to influence the evolution of this market?
What is the current and future market size?
What is the CAGR of this market?
How is the current and future market opportunity likely to be distributed across key market segments?
Which type of Green hydrogen is expected to dominate the market?
REASONS TO BUY THIS REPORT
The report provides a comprehensive market analysis, offering detailed revenue projections of the overall market and its specific sub-segments. This information is valuable to both established market leaders and emerging entrants.
Stakeholders can leverage the report to gain a deeper understanding of the competitive dynamics within the market. By analyzing the competitive landscape, businesses can make informed decisions to optimize their market positioning and develop effective go-to-market strategies.
The report offers stakeholders a comprehensive overview of the market, including key drivers, barriers, opportunities, and challenges. This information empowers stakeholders to stay abreast of market trends and make data-driven decisions to capitalize on growth prospects.
ADDITIONAL BENEFITS
Complimentary Excel Data Packs for all Analytical Modules in the Report
10% Free Content Customization
Detailed Report Walkthrough Session with Research Team
Free Updated report if the report is 6-12 months old or older
TABLE OF CONTENTS
1. PROJECT BACKGROUND
1.1. Context
1.2. Project Objectives
2. RESEARCH METHODOLOGY
2.1. Chapter Overview
2.2. Research Assumptions
2.3. Project Methodology
2.4. Forecast Methodology
2.5. Robust Quality Control
2.6. Key Market Segmentations
2.7. Key Considerations
2.7.1. Demographics
2.7.2. Economic Factors
2.7.3. Government Regulations
2.7.4. Supply Chain
2.7.5. COVID Impact
2.7.6. Market Access
2.7.7. Industry Consolidation
3. ECONOMIC AND OTHER PROJECT SPECIFIC CONSIDERATIONS
3.1. Chapter Overview
3.2. Market Dynamics
3.2.1. Time Period
3.2.1.1. Historical Trends
3.2.1.2. Current and Forecasted Estimates
3.2.2. Currency Coverage and Foreign Exchange Rate
3.2.2.1. Major Currencies Affecting the Market
3.2.2.2. Factors affecting Currency Fluctuations and Foreign Exchange Rates
3.2.2.3. Impact of Foreign Exchange Rate Volatility on Market
3.2.2.4. Strategies For Mitigating Foreign Exchange Risk
3.2.3. Trade Policies
3.2.3.1. Impact of Trade Barriers on the Market
3.2.3.2. Strategies for Mitigating the Risks Associated with Trade Barriers
3.2.4. Recession
3.2.4.1. Historical Analysis of Past Recessions and Lessons Learnt
3.2.4.2. Assessment of Current Economic Conditions and Potential Impact on the Market
3.2.5. Inflation
3.2.5.1. Measurement and Analysis of Inflationary Pressures in the Economy
3.2.5.2. Potential Impact of Inflation on the Market Evolution
4. EXECUTIVE SUMMARY
4.1. Insights on Market Landscape of Leading Players in the Green Hydrogen Industry
4.2. Insights on Market Landscape of Startups in the Green Hydrogen Industry
4.3. Insights on Global Green Hydrogen Market
4.4. Insights on Global Green Hydrogen Market by Technology
4.5. Insights on Global Green Hydrogen Market by Distribution Channel
4.6. Insights on Global Green Hydrogen Market by Renewable Sources
4.7. Insights on Global Green Hydrogen Market by Applications
4.8. Insights on Global Green Hydrogen Market by Production Scale
4.9. Insights on Global Green Hydrogen Market by Purity Level
4.10. Insights on Global Green Hydrogen Market by End Users
4.11. Insights on Global Green Hydrogen Market by Geography
5. GREEN HYDROGEN MARKET: MEGATRENDS ANALYSIS
5.1 Megatrends in the Green Hydrogen Market
6. INTRODUCTION
6.1. Overview of the Green Hydrogen Industry
6.1.1. Technological Trends
6.2. COVID-19 impact on the Green Hydrogen Market
6.3. Challenges Prevailing in the Green Hydrogen Industry
6.4. Recent Developments in the Green Hydrogen Industry
6.5. Future Perspectives
7. GREEN HYDROGEN MARKET: VALUE CHAIN ANALYSIS
7.1. Brief Overview on Green Hydrogen Manufacturing Process and Stakeholders Involved
7.2. The Evolving Requirements of Stakeholders and Conclusion
8. COMPETITIVE LANDSCAPE: LEADING PLAYERS IN THE GREEN HYDROGEN MARKET
8.1. Green Hydrogen Market: Market Landscape of Leading Players
8.1.1. Analysis by Year of Establishment
8.1.2. Analysis by Company Size
8.1.3. Analysis by Company Size and Year of Establishment
8.1.4. Analysis by Location of Headquarters
8.1.5. Analysis by Company Size and Location of Headquarters
8.1.6. Analysis by Technology
8.1.7. Analysis by Distribution Channel
8.1.8. Analysis by Renewable Sources
8.1.9. Analysis by Applications
8.1.10. Analysis by Production Scale
8.1.11. Analysis by Purity Level
8.1.12. Analysis by End Users
9. STARTUP ECOSYSTEM IN THE GREEN HYDROGEN MARKET
9.1. Green Hydrogen Market: Market Landscape of Startups
9.1.1. Analysis by Year of Establishment
9.1.2. Analysis by Company Size
9.1.3. Analysis by Company Size and Year of Establishment
9.1.4. Analysis by Location of Headquarters
9.1.5. Analysis by Company Size and Location of Headquarters
9.1.6. Analysis by Technology
9.1.7. Analysis by Distribution Channel
9.1.8. Analysis by Renewable Sources
9.1.9. Analysis by Applications
9.1.10. Analysis by Production Scale
9.1.11. Analysis by Purity Level
9.1.12. Analysis by End Users
10. PATENT ANLYSIS
10.1. Chapter Overview
10.2. Scope and Methodology
10.3. Green Hydrogen Market: Patent Analysis
10.3.1. Analysis by Patent Publication Year
10.3.2. Analysis by Patent Application Year
10.3.3. Analysis of Granted Patents and Patent Applications by Publication Year
10.3.4. Analysis by Patent Jurisdiction
10.3.5. Analysis by CPC Symbols
10.3.6. Analysis by Type of Applicant
10.3.7. Leading Industry Players: Analysis by Number of Patents
10.3.8. Leading Non-Industry Players: Analysis by Number of Patents
10.3.9. Leading Individual Assignees: Analysis by Number of Patents
10.4. Green Hydrogen Market: Patent Benchmarking Analysis
10.4.1. Analysis by Patent Characteristics
10.5. Green Hydrogen Market: Patent Valuation
10.6. Leading Patents by Number of Citations
11. DEMAND ANALYSIS
11.1. Chapter Overview
11.2. Assumptions and Methodology
11.3. Global Annual Demand for Green Hydrogen, till 2035
11.3.1. Annual Commercial Demand for Green Hydrogen: Distribution by End User, till 2035
11.3.1.1. Annual Commercial Demand for Green Hydrogen by Mobility End User, till 2035
11.3.1.2. Annual Commercial Demand for Green Hydrogen by Chemical End User, till 2035
11.3.1.3. Annual Commercial Demand for Green Hydrogen by Power End User, till 2035
11.3.1.4. Annual Commercial Demand for Green Hydrogen by Grid Injection End User, till 2035
11.3.1.5. Annual Commercial Demand for Green Hydrogen by Industrial End User, till 2035
11.3.1.6. Annual Commercial Demand for Green Hydrogen by Refining End User, till 2035
11.3.1.7. Annual Commercial Demand for Green Hydrogen by Other End User, till 2035
11.3.2. Annual Commercial Demand for Green Hydrogen: Distribution by Geography, till 2035
11.3.2.1. Annual Commercial Demand for Green Hydrogen in North America, till 2035
11.3.2.2. Annual Commercial Demand for Green Hydrogen in Europe, till 2035
11.3.2.3. Annual Commercial Demand for Green Hydrogen in Asia-Pacific, till 2035
11.3.2.4. Annual Commercial Demand for Green Hydrogen in Latin America, till 2035
11.3.2.5. Annual Commercial Demand for Green Hydrogen in Middle East and North Africa, till 2035
12. SUPPLY ANALYSIS
12.1. Chapter Overview
12.2. Assumption and Methodology
12.3. Global Annual Supply of Green Hydrogen, till 2035
12.3.1. Annual Supply of Green Hydrogen: Distribution by End User, till 2035
12.3.1.1. Annual Supply of Green Hydrogen for Mobility End User, till 2035
12.3.1.2. Annual Supply of Green Hydrogen for Chemical End User, till 2035
12.3.1.3. Annual Supply of Green Hydrogen for Power End User, till 2035
12.3.1.4. Annual Supply of Green Hydrogen for Grid Injection End User, till 2035
12.3.1.5. Annual Supply of Green Hydrogen for Industrial End User, till 2035
12.3.1.6. Annual Supply of Green Hydrogen for Refining End User, till 2035
12.3.1.7. Annual Supply of Green Hydrogen for Other End User, till 2035
12.3.2. Annual Supply of Green Hydrogen: Distribution by Geography, till 2035
12.3.2.1. Annual Supply of Green Hydrogen in North America, till 2035
12.3.2.2. Annual Supply of Green Hydrogen in Europe, till 2035
12.3.2.3. Annual Supply of Green Hydrogen in Asia-Pacific, till 2035
12.3.2.4. Annual Supply of Green Hydrogen in Latin America, till 2035
12.3.2.5. Annual Supply of Green Hydrogen in Middle East and North Africa, till 2035
13. TOTAL COST OF OWNERSHIP IN GREEN HYDROGEN MARKET
13.1. Chapter Overview
13.2. Key Assumptions and Methodology
13.3. Output
14. MARKET IMPACT ANALYSIS: DRIVERS, RESTRAINTS, OPPORTUNITIES AND CHALLENGES
14.1. Chapter Overview
14.2. Market Drivers
14.3. Market Restraints
14.4. Market Opportunities
14.5. Market Challenges
14.6. Conclusion
15. GLOBAL GREEN HYDROGEN MARKET
15.1. Assumptions and Methodology
15.2. Global Green Hydrogen Market, Historical Trends (Since 2018) and Forecasted Estimates (Till 2035)
15.2.1. Scenario Analysis
15.2.1.1. Conservative Scenario
15.2.1.2. Optimistic Scenario
15.3. Global Green Hydrogen Market: Distribution by Geography, 2018, 2024 and 2035
15.4. Key Market Segmentations
16. GREEN HYDROGEN MARKET, BY TECHNOLOGY
16.1. Assumptions and Methodology
16.2. Green Hydrogen Market: Distribution by Technology, 2018, 2024 and 2035
16.2.1. Green Hydrogen Market for Alkaline Electrolyzer (Value, YoY Growth): Historical Trends (Since 2018) and Forecasted Estimates (Till 2035)
16.2.2. Green Hydrogen Market for Proton Exchange Membrane Electrolyzer (Value, YoY Growth): Historical Trends (Since 2018) and Forecasted Estimates (Till 2035)
16.2.3. Green Hydrogen Market for Solid Oxide Electrolyzer (Value, YoY Growth): Historical Trends (Since 2018) and Forecasted Estimates (Till 2035)
16.3. Data Triangulation and Validation
17. GREEN HYDROGEN MARKET, BY DISTRIBUTION CHANNEL
17.1. Assumptions and Methodology
17.2. Green Hydrogen Market: Distribution by Distribution Channel, 2018, 2024 and 2035
17.2.1. Green Hydrogen Market for Cargo (Value, YoY Growth): Historical Trends (Since 2018) and Forecasted Estimates (Till 2035)
17.2.2. Green Hydrogen Market for Pipeline (Value, YoY Growth): Historical Trends (Since 2018) and Forecasted Estimates (Till 2035)
17.3. Data Triangulation and Validation
18. GREEN HYDROGEN MARKET, BY RENEWABLE SOURCES
18.1. Assumptions and Methodology
18.2. Green Hydrogen Market: Distribution by Renewable Sources, 2018, 2024 and 2035
18.2.1. Green Hydrogen Market for Wind (Value, YoY Growth): Historical Trends (Since 2018) and Forecasted Estimates (Till 2035)
18.2.2. Green Hydrogen Market for Solar (Value, YoY Growth): Historical Trends (Since 2018) and Forecasted Estimates (Till 2035)
18.2.3. Green Hydrogen Market for Hydrothermal (Value, YoY Growth): Historical Trends (Since 2018) and Forecasted Estimates (Till 2035)
18.2.4. Green Hydrogen Market for Power Thermal (Value, YoY Growth): Historical Trends (Since 2018) and Forecasted Estimates (Till 2035
18.2.5. Green Hydrogen Market for Others (Value, YoY Growth): Historical Trends (Since 2018) and Forecasted Estimates (Till 2035)
18.3. Data Triangulation and Validation
19. GREEN HYDROGEN MARKET, BY STORAGE
19.1. Assumptions and Methodology
19.2. Green Hydrogen Market: Distribution by Storage, 2018, 2024 and 2035
19.2.1. Green Hydrogen Market for Compressed Gas (Value, YoY Growth): Historical Trends (Since 2018) and Forecasted Estimates (Till 2035)
19.2.2. Green Hydrogen Market for Liquid Hydrogen (Value, YoY Growth): Historical Trends (Since 2018) and Forecasted Estimates (Till 2035)
19.2.3. Green Hydrogen Market for Metal Hydrides (Value, YoY Growth): Historical Trends (Since 2018) and Forecasted Estimates (Till 2035)
19.2.4. Green Hydrogen Market for Underground Storage (Value, YoY Growth): Historical Trends (Since 2018) and Forecasted Estimates (Till 2035)
19.3. Data Triangulation and Validation
20. GREEN HYDROGEN MARKET, BY APPLICATIONS
20.1. Assumptions and Methodology
20.2. Green Hydrogen Market: Distribution by Applications, 2018, 2024 and 2035
20.2.1. Green Hydrogen Market for Fuel Cells (Value, YoY Growth): Historical Trends (Since 2018) and Forecasted Estimates (Till 2035)
20.2.2. Green Hydrogen Market for Power-to-Gas (Value, YoY Growth): Historical Trends (Since 2018) and Forecasted Estimates (Till 2035)
20.2.3. Green Hydrogen Market for Ammonia Production (Value, YoY Growth): Historical Trends (Since 2018) and Forecasted Estimates (Till 2035)
20.2.4. Green Hydrogen Market for Methanol Production (Value, YoY Growth): Historical Trends (Since 2018) and Forecasted Estimates (Till 2035)
20.2.5. Green Hydrogen Market for Refining (Value, YoY Growth): Historical Trends (Since 2018) and Forecasted Estimates (Till 2035)
20.3. Data Triangulation and Validation
21. GREEN HYDROGEN MARKET, BY PRODUCTION SCALE
21.1. Assumptions and Methodology
21.2. Green Hydrogen Market: Distribution by Production Scale, 2018, 2024 and 2035
21.2.1. Green Hydrogen Market for Small-scale (< 1 MW) (Value, YoY Growth): Historical Trends (Since 2018) and Forecasted Estimates (Till 2035)
21.2.2. Green Hydrogen Market for Medium-scale (1-10 MW) (Value, YoY Growth): Historical Trends (Since 2018) and Forecasted Estimates (Till 2035)
21.2.3. Green Hydrogen Market for Large-scale (> 10 MW) (Value, YoY Growth): Historical Trends (Since 2018) and Forecasted Estimates (Till 2035)
21.3. Data Triangulation and Validation
22. GREEN HYDROGEN MARKET, BY PURITY LEVEL
22.1. Assumptions and Methodology
22.2. Green Hydrogen Market: Distribution by Purity Level, 2018, 2024 and 2035
22.2.1. Green Hydrogen Market for Ultra-high Purity (99.999%+) (Value, YoY Growth): Historical Trends (Since 2018) and Forecasted Estimates (Till 2035)
22.2.2. Green Hydrogen Market for High Purity (99.99%+) (Value, YoY Growth): Historical Trends (Since 2018) and Forecasted Estimates (Till 2035)
22.2.3. Green Hydrogen Market for Standard Purity (99.9%+) (Value, YoY Growth): Historical Trends (Since 2018) and Forecasted Estimates (Till 2035)
22.3. Data Triangulation and Validation
23. GREEN HYDROGEN MARKET, BY END USERS
23.1. Assumptions and Methodology
23.2. Green Hydrogen Market: Distribution by Type of End Users, 2018, 2024 and 2035
23.2.1. Green Hydrogen Market for Mobility (Value, YoY Growth): Historical Trends (Since 2018) and Forecasted Estimates (Till 2035)
23.2.2. Green Hydrogen Market for Chemical (Value, YoY Growth): Historical Trends (Since 2018) and Forecasted Estimates (Till 2035)
23.2.3. Green Hydrogen Market for Power (Value, YoY Growth): Historical Trends (Since 2018) and Forecasted Estimates (Till 2035)
23.2.4. Green Hydrogen Market for Grid Injection (Value, YoY Growth): Historical Trends (Since 2018) and Forecasted Estimates (Till 2035)
23.2.5. Green Hydrogen Market for Industrial (Value, YoY Growth): Historical Trends (Since 2018) and Forecasted Estimates (Till 2035)
23.2.6. Green Hydrogen Market for Refining (Value, YoY Growth): Historical Trends (Since 2018) and Forecasted Estimates (Till 2035)
23.2.7. Green Hydrogen Market for Others (Value, YoY Growth): Historical Trends (Since 2018) and Forecasted Estimates (Till 2035)
23.3. Data Triangulation and Validation
24. NORTH AMERICA GREEN HYDROGEN MARKET
24.1. Assumptions and Methodology
24.2. North America Green Hydrogen Market: Distribution by Technology, 2018, 2024 and 2035
24.2.1. North America Green Hydrogen Market for Alkaline Electrolyzer (Value, YoY Growth): Historical Trends (Since 2018) and Forecasted Estimates (Till 2035)
24.2.2. North America Green Hydrogen Market for Proton Exchange Membrane Electrolyzer (Value, YoY Growth): Historical Trends (Since 2018) and Forecasted Estimates (Till 2035)
24.2.3. North America Green Hydrogen Market for Solid Oxide Electrolyzer (Value, YoY Growth): Historical Trends (Since 2018) and Forecasted Estimates (Till 2035)
24.3. North America Green Hydrogen Market: Distribution by Distribution Channel, 2018, 2024 and 2035
24.3.1. North America Green Hydrogen Market for Cargo (Value, YoY Growth): Historical Trends (Since 2018) and Forecasted Estimates (Till 2035)
24.3.2. North America Green Hydrogen Market for Pipeline (Value, YoY Growth): Historical Trends (Since 2018) and Forecasted Estimates (Till 203
24.4. North America Green Hydrogen Market: Distribution by Renewable Sources, 2018, 2024 and 2035
24.4.1. North America Green Hydrogen Market for Wind (Value, YoY Growth): Historical Trends (Since 2018) and Forecasted Estimates (Till 2035)
24.4.2. North America Green Hydrogen Market for Solar (Value, YoY Growth): Historical Trends (Since 2018) and Forecasted Estimates (Till 2035)
24.4.3. North America Green Hydrogen Market for Hydrothermal (Value, YoY Growth): Historical Trends (Since 2018) and Forecasted Estimates (Till 2035)
24.4.4. North America Green Hydrogen Market for Power Thermal (Value, YoY Growth): Historical Trends (Since 2018) and Forecasted Estimates (Till 2035
24.4.5. North America Green Hydrogen Market for Others (Value, YoY Growth): Historical Trends (Since 2018) and Forecasted Estimates (Till 2035)
24.5. North America Green Hydrogen Market: Distribution by Storage, 2018, 2024 and 2035
24.5.1. North America Green Hydrogen Market for Compressed Gas (Value, YoY Growth): Historical Trends (Since 2018) and Forecasted Estimates (Till 2035)
24.5.2. North America Green Hydrogen Market for Liquid Hydrogen (Value, YoY Growth): Historical Trends (Since 2018) and Forecasted Estimates (Till 2035)
24.5.3. North America Green Hydrogen Market for Metal Hydrides (Value, YoY Growth): Historical Trends (Since 2018) and Forecasted Estimates (Till 2035)
24.5.4. North America Green Hydrogen Market for Underground Storage (Value, YoY Growth): Historical Trends (Since 2018) and Forecasted Estimates (Till 2035)
24.6. North America Green Hydrogen Market: Distribution by Applications, 2018, 2024 and 2035
24.6.1. North America Green Hydrogen Market for Fuel Cells (Value, YoY Growth): Historical Trends (Since 2018) and Forecasted Estimates (Till 2035)
24.6.2. North America Green Hydrogen Market for Power-to-Gas (Value, YoY Growth): Historical Trends (Since 2018) and Forecasted Estimates (Till 2035)
24.6.3. North America Green Hydrogen Market for Ammonia Production (Value, YoY Growth): Historical Trends (Since 2018) and Forecasted Estimates (Till 2035)
24.6.4. North America Green Hydrogen Market for Methanol Production (Value, YoY Growth): Historical Trends (Since 2018) and Forecasted Estimates (Till 2035)
24.6.5. North America Green Hydrogen Market for Refining (Value, YoY Growth): Historical Trends (Since 2018) and Forecasted Estimates (Till 2035)
24.7. North America Green Hydrogen Market: Distribution by Production Scale, 2018, 2024 and 2035
24.7.1. North America Green Hydrogen Market for Small-scale (< 1 MW) (Value, YoY Growth): Historical Trends (Since 2018) and Forecasted Estimates (Till 2035)
24.7.2. North America Green Hydrogen Market for Medium-scale (1-10 MW) (Value, YoY Growth): Historical Trends (Since 2018) and Forecasted Estimates (Till 2035)
24.7.3. North America Green Hydrogen Market for Large-scale (> 10 MW) (Value, YoY Growth): Historical Trends (Since 2018) and Forecasted Estimates (Till 2035)
24.8. North America Green Hydrogen Market: Distribution by Purity Level, 2018, 2024 and 2035
24.8.1. North America Green Hydrogen Market for Ultra-high Purity (99.999%+) (Value, YoY Growth): Historical Trends (Since 2018) and Forecasted Estimates (Till 2035)
24.8.2. North America Green Hydrogen Market for High Purity (99.99%+) (Value, YoY Growth): Historical Trends (Since 2018) and Forecasted Estimates (Till 2035)
24.8.3. North America Green Hydrogen Market for Standard Purity (99.9%+) (Value, YoY Growth): Historical Trends (Since 2018) and Forecasted Estimates (Till 2035)
24.9. North America Green Hydrogen Market: Distribution by Type of End Users, 2018, 2024 and 2035
24.9.1. North America Green Hydrogen Market for Mobility (Value, YoY Growth): Historical Trends (Since 2018) and Forecasted Estimates (Till 2035)
24.9.2. North America Green Hydrogen Market for Chemical (Value, YoY Growth): Historical Trends (Since 2018) and Forecasted Estimates (Till 2035)
24.9.3. North America Green Hydrogen Market for Power (Value, YoY Growth): Historical Trends (Since 2018) and Forecasted Estimates (Till 2035)
24.9.4. North America Green Hydrogen Market for Grid Injection (Value, YoY Growth): Historical Trends (Since 2018) and Forecasted Estimates (Till 2035)
24.9.5. North America Green Hydrogen Market for Industrial (Value, YoY Growth): Historical Trends (Since 2018) and Forecasted Estimates (Till 2035)
24.9.6. North America Green Hydrogen Market for Refining (Value, YoY Growth): Historical Trends (Since 2018) and Forecasted Estimates (Till 2035)
24.9.7. North America Green Hydrogen Market for Others (Value, YoY Growth): Historical Trends (Since 2018) and Forecasted Estimates (Till 2035)
24.10. Green Hydrogen Market in the US (Value, YoY Growth): Historical Trends (Since 2018) and Forecasted Estimates (Till 2035)
24.11. Green Hydrogen Market in Canada (Value, YoY Growth): Historical Trends (Since 2018) and Forecasted Estimates (Till 2035)
24.12. Data Triangulation and Validation
25. EUROPE GREEN HYDROGEN MARKET
25.1. Assumptions and Methodology
25.2. Europe Green Hydrogen Market: Distribution by Technology, 2018, 2024 and 2035
25.2.1. Europe Green Hydrogen Market for Alkaline Electrolyzer (Value, YoY Growth): Historical Trends (Since 2018) and Forecasted Estimates (Till 2035)
25.2.2. Europe Green Hydrogen Market for Proton Exchange Membrane Electrolyzer (Value, YoY Growth): Historical Trends (Since 2018) and Forecasted Estimates (Till 2035)
25.2.3. Europe Green Hydrogen Market for Solid Oxide Electrolyzer (Value, YoY Growth): Historical Trends (Since 2018) and Forecasted Estimates (Till 2035)
25.3. Europe Green Hydrogen Market: Distribution by Distribution Channel, 2018, 2024 and 2035
25.3.1. Europe Green Hydrogen Market for Cargo (Value, YoY Growth): Historical Trends (Since 2018) and Forecasted Estimates (Till 2035)
25.3.2. Europe Green Hydrogen Market for Pipeline (Value, YoY Growth): Historical Trends (Since 2018) and Forecasted Estimates (Till 203
25.4. Europe Green Hydrogen Market: Distribution by Renewable Sources, 2018, 2024 and 2035
25.4.1. Europe Green Hydrogen Market for Wind (Value, YoY Growth): Historical Trends (Since 2018) and Forecasted Estimates (Till 2035)
25.4.2. Europe Green Hydrogen Market for Solar (Value, YoY Growth): Historical Trends (Since 2018) and Forecasted Estimates (Till 2035)
25.4.3. Green Hydrogen Market for Hydrothermal (Value, YoY Growth): Historical Trends (Since 2018) and Forecasted Estimates (Till 2035)
25.4.4. Green Hydrogen Market for Power Thermal (Value, YoY Growth): Historical Trends (Since 2018) and Forecasted Estimates (Till 2035
25.4.5. Green Hydrogen Market for Others (Value, YoY Growth): Historical Trends (Since 2018) and Forecasted Estimates (Till 2035)
25.5. Europe Green Hydrogen Market: Distribution by Storage, 2018, 2024 and 2035
25.5.1. Europe Green Hydrogen Market for Compressed Gas (Value, YoY Growth): Historical Trends (Since 2018) and Forecasted Estimates (Till 2035)
25.5.2. Europe Green Hydrogen Market for Liquid Hydrogen (Value, YoY Growth): Historical Trends (Since 2018) and Forecasted Estimates (Till 2035)
25.5.3. Europe Green Hydrogen Market for Metal Hydrides (Value, YoY Growth): Historical Trends (Since 2018) and Forecasted Estimates (Till 2035)
25.5.4. Europe Green Hydrogen Market for Underground Storage (Value, YoY Growth): Historical Trends (Since 2018) and Forecasted Estimates (Till 2035)
25.6. Europe Green Hydrogen Market: Distribution by Applications, 2018, 2024 and 2035
25.6.1. Europe Green Hydrogen Market for Fuel Cells (Value, YoY Growth): Historical Trends (Since 2018) and Forecasted Estimates (Till 2035)
25.6.2. Europe Green Hydrogen Market for Power-to-Gas (Value, YoY Growth): Historical Trends (Since 2018) and Forecasted Estimates (Till 2035)
25.6.3. Europe Green Hydrogen Market for Ammonia Production (Value, YoY Growth): Historical Trends (Since 2018) and Forecasted Estimates (Till 2035)
25.6.4. Europe Green Hydrogen Market for Methanol Production (Value, YoY Growth): Historical Trends (Since 2018) and Forecasted Estimates (Till 2035)
25.6.5. Europe Green Hydrogen Market for Refining (Value, YoY Growth): Historical Trends (Since 2018) and Forecasted Estimates (Till 2035)
25.7. Europe Green Hydrogen Market: Distribution by Production Scale, 2018, 2024 and 2035
25.7.1. Europe Green Hydrogen Market for Small-scale (< 1 MW) (Value, YoY Growth): Historical Trends (Since 2018) and Forecasted Estimates (Till 2035)
25.7.2. Europe Green Hydrogen Market for Medium-scale (1-10 MW) (Value, YoY Growth): Historical Trends (Since 2018) and Forecasted Estimates (Till 2035)
25.7.3. Europe Green Hydrogen Market for Large-scale (> 10 MW) (Value, YoY Growth): Historical Trends (Since 2018) and Forecasted Estimates (Till 2035)
25.8. Europe Green Hydrogen Market: Distribution by Purity Level, 2018, 2024 and 2035
25.8.1. Europe Green Hydrogen Market for Ultra-high Purity (99.999%+) (Value, YoY Growth): Historical Trends (Since 2018) and Forecasted Estimates (Till 2035)
25.8.2. Europe Green Hydrogen Market for High Purity (99.99%+) (Value, YoY Growth): Historical Trends (Since 2018) and Forecasted Estimates (Till 2035)
25.8.3. Europe Green Hydrogen Market for Standard Purity (99.9%+) (Value, YoY Growth): Historical Trends (Since 2018) and Forecasted Estimates (Till 2035)
25.9. Europe Green Hydrogen Market: Distribution by Type of End Users, 2018, 2024 and 2035
25.9.1. Europe Green Hydrogen Market for Mobility (Value, YoY Growth): Historical Trends (Since 2018) and Forecasted Estimates (Till 2035)
25.9.2. Europe Green Hydrogen Market for Chemical (Value, YoY Growth): Historical Trends (Since 2018) and Forecasted Estimates (Till 2035)
25.9.3. Europe Green Hydrogen Market for Power (Value, YoY Growth): Historical Trends (Since 2018) and Forecasted Estimates (Till 2035)
25.9.4. Europe Green Hydrogen Market for Grid Injection (Value, YoY Growth): Historical Trends (Since 2018) and Forecasted Estimates (Till 2035)
25.9.5. Europe Green Hydrogen Market for Industrial (Value, YoY Growth): Historical Trends (Since 2018) and Forecasted Estimates (Till 2035)
25.9.6. Europe Green Hydrogen Market for Refining (Value, YoY Growth): Historical Trends (Since 2018) and Forecasted Estimates (Till 2035)
25.9.7. Europe Green Hydrogen Market for Others (Value, YoY Growth): Historical Trends (Since 2018) and Forecasted Estimates (Till 2035)
25.10. Green Hydrogen Market in Germany (Value, YoY Growth): Historical Trends (Since 2018) and Forecasted Estimates (Till 2035)
25.11. Green Hydrogen Market in France (Value, YoY Growth): Historical Trends (Since 2018) and Forecasted Estimates (Till 2035)
25.12. Green Hydrogen Market in Italy (Value, YoY Growth): Historical Trends (Since 2018) and Forecasted Estimates (Till 2035)
25.13. Green Hydrogen Market in the UK (Value, YoY Growth): Historical Trends (Since 2018) and Forecasted Estimates (Till 2035)
25.14. Green Hydrogen Market in Spain (Value, YoY Growth): Historical Trends (Since 2018) and Forecasted Estimates (Till 2035)
25.15. Green Hydrogen Market in Rest of Europe (Value, YoY Growth): Historical Trends (Since 2018) and Forecasted Estimates (Till 2035)
25.16. Data Triangulation and Validation
26. ASIA-PACIFIC GREEN HYDROGEN MARKET
26.1. Assumptions and Methodology
26.2. Asia-Pacific Green Hydrogen Market: Distribution by Technology, 2018, 2024 and 2035
26.2.1. Asia-Pacific Green Hydrogen Market for Alkaline Electrolyzer (Value, YoY Growth): Historical Trends (Since 2018) and Forecasted Estimates (Till 2035)
26.2.2. Asia-Pacific Green Hydrogen Market for Proton Exchange Membrane Electrolyzer (Value, YoY Growth): Historical Trends (Since 2018) and Forecasted Estimates (Till 2035)
26.2.3. Asia-Pacific Green Hydrogen Market for Solid Oxide Electrolyzer (Value, YoY Growth): Historical Trends (Since 2018) and Forecasted Estimates (Till 2035)
26.3. Asia-Pacific Green Hydrogen Market: Distribution by Distribution Channel, 2018, 2024 and 2035
26.3.1. Asia-Pacific Green Hydrogen Market for Cargo (Value, YoY Growth): Historical Trends (Since 2018) and Forecasted Estimates (Till 2035)
26.3.2. Asia-Pacific Green Hydrogen Market for Pipeline (Value, YoY Growth): Historical Trends (Since 2018) and Forecasted Estimates (Till 203
26.4. Asia-Pacific Green Hydrogen Market: Distribution by Renewable Sources, 2018, 2024 and 2035
26.4.1. Asia-Pacific Green Hydrogen Market for Wind (Value, YoY Growth): Historical Trends (Since 2018) and Forecasted Estimates (Till 2035)
26.4.2. Asia-Pacific Green Hydrogen Market for Solar (Value, YoY Growth): Historical Trends (Since 2018) and Forecasted Estimates (Till 2035)
26.4.3. Green Hydrogen Market for Hydrothermal (Value, YoY Growth): Historical Trends (Since 2018) and Forecasted Estimates (Till 2035)
26.4.4. Green Hydrogen Market for Power Thermal (Value, YoY Growth): Historical Trends (Since 2018) and Forecasted Estimates (Till 2035
26.4.5. Green Hydrogen Market for Others (Value, YoY Growth): Historical Trends (Since 2018) and Forecasted Estimates (Till 2035)
26.5. Asia-Pacific Green Hydrogen Market: Distribution by Storage, 2018, 2024 and 2035
26.5.1. Asia-Pacific Green Hydrogen Market for Compressed Gas (Value, YoY Growth): Historical Trends (Since 2018) and Forecasted Estimates (Till 2035)
26.5.2. Asia-Pacific Green Hydrogen Market for Liquid Hydrogen (Value, YoY Growth): Historical Trends (Since 2018) and Forecasted Estimates (Till 2035)
26.5.3. Asia-Pacific Green Hydrogen Market for Metal Hydrides (Value, YoY Growth): Historical Trends (Since 2018) and Forecasted Estimates (Till 2035)
26.5.4. Asia-Pacific Green Hydrogen Market for Underground Storage (Value, YoY Growth): Historical Trends (Since 2018) and Forecasted Estimates (Till 2035)
26.6. Asia-Pacific Green Hydrogen Market: Distribution by Applications, 2018, 2024 and 2035
26.6.1. Asia-Pacific Green Hydrogen Market for Fuel Cells (Value, YoY Growth): Historical Trends (Since 2018) and Forecasted Estimates (Till 2035)
26.6.2. Asia-Pacific Green Hydrogen Market for Power-to-Gas (Value, YoY Growth): Historical Trends (Since 2018) and Forecasted Estimates (Till 2035)
26.6.3. Asia-Pacific Green Hydrogen Market for Ammonia Production (Value, YoY Growth): Historical Trends (Since 2018) and Forecasted Estimates (Till 2035)
26.6.4. Asia-Pacific Green Hydrogen Market for Methanol Production (Value, YoY Growth): Historical Trends (Since 2018) and Forecasted Estimates (Till 2035)
26.6.5. Asia-Pacific Green Hydrogen Market for Refining (Value, YoY Growth): Historical Trends (Since 2018) and Forecasted Estimates (Till 2035)
26.7. Asia-Pacific Green Hydrogen Market: Distribution by Production Scale, 2018, 2024 and 2035
26.7.1. Asia-Pacific Green Hydrogen Market for Small-scale (< 1 MW) (Value, YoY Growth): Historical Trends (Since 2018) and Forecasted Estimates (Till 2035)
26.7.2. Asia-Pacific Green Hydrogen Market for Medium-scale (1-10 MW) (Value, YoY Growth): Historical Trends (Since 2018) and Forecasted Estimates (Till 2035)
26.7.3. Asia-Pacific Green Hydrogen Market for Large-scale (> 10 MW) (Value, YoY Growth): Historical Trends (Since 2018) and Forecasted Estimates (Till 2035)
26.8. Asia-Pacific Green Hydrogen Market: Distribution by Purity Level, 2018, 2024 and 2035
26.8.1. Asia-Pacific Green Hydrogen Market for Ultra-high Purity (99.999%+) (Value, YoY Growth): Historical Trends (Since 2018) and Forecasted Estimates (Till 2035)
26.8.2. Asia-Pacific Green Hydrogen Market for High Purity (99.99%+) (Value, YoY Growth): Historical Trends (Since 2018) and Forecasted Estimates (Till 2035)
26.8.3. Asia-Pacific Green Hydrogen Market for Standard Purity (99.9%+) (Value, YoY Growth): Historical Trends (Since 2018) and Forecasted Estimates (Till 2035)
26.9. Asia-Pacific Green Hydrogen Market: Distribution by Type of End Users, 2018, 2024 and 2035
26.9.1. Asia-Pacific Green Hydrogen Market for Mobility (Value, YoY Growth): Historical Trends (Since 2018) and Forecasted Estimates (Till 2035)
26.9.2. Asia-Pacific Green Hydrogen Market for Chemical (Value, YoY Growth): Historical Trends (Since 2018) and Forecasted Estimates (Till 2035)
26.9.3. Asia-Pacific Green Hydrogen Market for Power (Value, YoY Growth): Historical Trends (Since 2018) and Forecasted Estimates (Till 2035)
26.9.4. Asia-Pacific Green Hydrogen Market for Grid Injection (Value, YoY Growth): Historical Trends (Since 2018) and Forecasted Estimates (Till 2035)
26.9.5. Asia-Pacific Green Hydrogen Market for Industrial (Value, YoY Growth): Historical Trends (Since 2018) and Forecasted Estimates (Till 2035)
26.9.6. Asia-Pacific Green Hydrogen Market for Refining (Value, YoY Growth): Historical Trends (Since 2018) and Forecasted Estimates (Till 2035)
26.9.7. Asia-Pacific Green Hydrogen Market for Others (Value, YoY Growth): Historical Trends (Since 2018) and Forecasted Estimates (Till 2035)
26.10. Green Hydrogen Market in China (Value, YoY Growth): Historical Trends (Since 2018) and Forecasted Estimates (Till 2035)
26.11. Green Hydrogen Market in Japan (Value, YoY Growth): Historical Trends (Since 2018) and Forecasted Estimates (Till 2035)
26.12. Green Hydrogen Market in South Korea (Value, YoY Growth): Historical Trends (Since 2018) and Forecasted Estimates (Till 2035)
26.13. Green Hydrogen Market in India (Value, YoY Growth): Historical Trends (Since 2018) and Forecasted Estimates (Till 2035)
26.14. Green Hydrogen Market in Australia (Value, YoY Growth): Historical Trends (Since 2018) and Forecasted Estimates (Till 2035)
26.15. Green Hydrogen Market in Rest of Asia-Pacific (Value, YoY Growth): Historical Trends (Since 2018) and Forecasted Estimates (Till 2035)
26.16. Data Triangulation and Validation
27. LATIN AMERICA GREEN HYDROGEN MARKET
27.1. Assumptions and Methodology
27.2. Latin America Green Hydrogen Market: Distribution by Technology, 2018, 2024 and 2035
27.2.1. Latin America Green Hydrogen Market for Alkaline Electrolyzer (Value, YoY Growth): Historical Trends (Since 2018) and Forecasted Estimates (Till 2035)
27.2.2. Latin America Green Hydrogen Market for Proton Exchange Membrane Electrolyzer (Value, YoY Growth): Historical Trends (Since 2018) and Forecasted Estimates (Till 2035)
27.2.3. Latin America Green Hydrogen Market for Solid Oxide Electrolyzer (Value, YoY Growth): Historical Trends (Since 2018) and Forecasted Estimates (Till 2035)
27.3. Latin America Green Hydrogen Market: Distribution by Distribution Channel, 2018, 2024 and 2035
27.3.1. Latin America Green Hydrogen Market for Cargo (Value, YoY Growth): Historical Trends (Since 2018) and Forecasted Estimates (Till 2035)
27.3.2. Latin America Green Hydrogen Market for Pipeline (Value, YoY Growth): Historical Trends (Since 2018) and Forecasted Estimates (Till 203
27.4. Latin America Green Hydrogen Market: Distribution by Renewable Sources, 2018, 2024 and 2035
27.4.1. Latin America Green Hydrogen Market for Wind (Value, YoY Growth): Historical Trends (Since 2018) and Forecasted Estimates (Till 2035)
27.4.2. Latin America Green Hydrogen Market for Solar (Value, YoY Growth): Historical Trends (Since 2018) and Forecasted Estimates (Till 2035)
27.4.3. Green Hydrogen Market for Hydrothermal (Value, YoY Growth): Historical Trends (Since 2018) and Forecasted Estimates (Till 2035)
27.4.4. Green Hydrogen Market for Power Thermal (Value, YoY Growth): Historical Trends (Since 2018) and Forecasted Estimates (Till 2035
27.4.5. Green Hydrogen Market for Others (Value, YoY Growth): Historical Trends (Since 2018) and Forecasted Estimates (Till 2035)
27.5. Latin America Green Hydrogen Market: Distribution by Storage, 2018, 2024 and 2035
27.5.1. Latin America Green Hydrogen Market for Compressed Gas (Value, YoY Growth): Historical Trends (Since 2018) and Forecasted Estimates (Till 2035)
27.5.2. Latin America Green Hydrogen Market for Liquid Hydrogen (Value, YoY Growth): Historical Trends (Since 2018) and Forecasted Estimates (Till 2035)
27.5.3. Latin America Green Hydrogen Market for Metal Hydrides (Value, YoY Growth): Historical Trends (Since 2018) and Forecasted Estimates (Till 2035)
27.5.4. Latin America Green Hydrogen Market for Underground Storage (Value, YoY Growth): Historical Trends (Since 2018) and Forecasted Estimates (Till 2035)
27.6. Latin America Green Hydrogen Market: Distribution by Applications, 2018, 2024 and 2035
27.6.1. Latin America Green Hydrogen Market for Fuel Cells (Value, YoY Growth): Historical Trends (Since 2018) and Forecasted Estimates (Till 2035)
27.6.2. Latin America Green Hydrogen Market for Power-to-Gas (Value, YoY Growth): Historical Trends (Since 2018) and Forecasted Estimates (Till 2035)
27.6.3. Latin America Green Hydrogen Market for Ammonia Production (Value, YoY Growth): Historical Trends (Since 2018) and Forecasted Estimates (Till 2035)
27.6.4. Latin America Green Hydrogen Market for Methanol Production (Value, YoY Growth): Historical Trends (Since 2018) and Forecasted Estimates (Till 2035)
27.6.5. Latin America Green Hydrogen Market for Refining (Value, YoY Growth): Historical Trends (Since 2018) and Forecasted Estimates (Till 2035)
27.7. Latin America Green Hydrogen Market: Distribution by Production Scale, 2018, 2024 and 2035
27.7.1. Latin America Green Hydrogen Market for Small-scale (< 1 MW) (Value, YoY Growth): Historical Trends (Since 2018) and Forecasted Estimates (Till 2035)
27.7.2. Latin America Green Hydrogen Market for Medium-scale (1-10 MW) (Value, YoY Growth): Historical Trends (Since 2018) and Forecasted Estimates (Till 2035)
27.7.3. Latin America Green Hydrogen Market for Large-scale (> 10 MW) (Value, YoY Growth): Historical Trends (Since 2018) and Forecasted Estimates (Till 2035)
27.8. Latin America Green Hydrogen Market: Distribution by Purity Level, 2018, 2024 and 2035
27.8.1. Latin America Green Hydrogen Market for Ultra-high Purity (99.999%+) (Value, YoY Growth): Historical Trends (Since 2018) and Forecasted Estimates (Till 2035)
27.8.2. Latin America Green Hydrogen Market for High Purity (99.99%+) (Value, YoY Growth): Historical Trends (Since 2018) and Forecasted Estimates (Till 2035)
27.8.3. Latin America Green Hydrogen Market for Standard Purity (99.9%+) (Value, YoY Growth): Historical Trends (Since 2018) and Forecasted Estimates (Till 2035)
27.9. Latin America Green Hydrogen Market: Distribution by Type of End Users, 2018, 2024 and 2035
27.9.1. Latin America Green Hydrogen Market for Mobility (Value, YoY Growth): Historical Trends (Since 2018) and Forecasted Estimates (Till 2035)
27.9.2. Latin America Green Hydrogen Market for Chemical (Value, YoY Growth): Historical Trends (Since 2018) and Forecasted Estimates (Till 2035)
27.9.3. Latin America Green Hydrogen Market for Power (Value, YoY Growth): Historical Trends (Since 2018) and Forecasted Estimates (Till 2035)
27.9.4. Latin America Green Hydrogen Market for Grid Injection (Value, YoY Growth): Historical Trends (Since 2018) and Forecasted Estimates (Till 2035)
27.9.5. Latin America Green Hydrogen Market for Industrial (Value, YoY Growth): Historical Trends (Since 2018) and Forecasted Estimates (Till 2035)
27.9.6. Latin America Green Hydrogen Market for Refining (Value, YoY Growth): Historical Trends (Since 2018) and Forecasted Estimates (Till 2035)
27.9.7. Latin America Green Hydrogen Market for Others (Value, YoY Growth): Historical Trends (Since 2018) and Forecasted Estimates (Till 2035)
27.10. Green Hydrogen Market in Brazil (Value, YoY Growth): Historical Trends (Since 2018) and Forecasted Estimates (Till 2035)
27.11. Green Hydrogen Market in Argentina (Value, YoY Growth): Historical Trends (Since 2018) and Forecasted Estimates (Till 2035)
27.12. Green Hydrogen Market in Rest of Latin America (Value, YoY Growth): Historical Trends (Since 2018) and Forecasted Estimates (Till 2035)
27.13. Data Triangulation and Validation
28. MIDDLE EAST AND NORTH AFRICA GREEN HYDROGEN MARKET
28.1. Assumptions and Methodology
28.2. Middle East and North Africa Green Hydrogen Market: Distribution by Technology, 2018, 2024 and 2035
28.2.1. Middle East and North Africa Green Hydrogen Market for Alkaline Electrolyzer (Value, YoY Growth): Historical Trends (Since 2018) and Forecasted Estimates (Till 2035)
28.2.2. Middle East and North Africa Green Hydrogen Market for Proton Exchange Membrane Electrolyzer (Value, YoY Growth): Historical Trends (Since 2018) and Forecasted Estimates (Till 2035)
28.2.3. Middle East and North Africa Green Hydrogen Market for Solid Oxide Electrolyzer (Value, YoY Growth): Historical Trends (Since 2018) and Forecasted Estimates (Till 2035)
28.3. Middle East and North Africa Green Hydrogen Market: Distribution by Distribution Channel, 2018, 2024 and 2035
28.3.1. Middle East and North Africa Green Hydrogen Market for Cargo (Value, YoY Growth): Historical Trends (Since 2018) and Forecasted Estimates (Till 2035)
28.3.2. Middle East and North Africa Green Hydrogen Market for Pipeline (Value, YoY Growth): Historical Trends (Since 2018) and Forecasted Estimates (Till 203
28.4. Middle East and North Africa Green Hydrogen Market: Distribution by Renewable Sources, 2018, 2024 and 2035
28.4.1. Middle East and North Africa Green Hydrogen Market for Wind (Value, YoY Growth): Historical Trends (Since 2018) and Forecasted Estimates (Till 2035)
28.4.2. Middle East and North Africa Green Hydrogen Market for Solar (Value, YoY Growth): Historical Trends (Since 2018) and Forecasted Estimates (Till 2035)
28.4.3. Green Hydrogen Market for Hydrothermal (Value, YoY Growth): Historical Trends (Since 2018) and Forecasted Estimates (Till 2035)
28.4.4. Green Hydrogen Market for Power Thermal (Value, YoY Growth): Historical Trends (Since 2018) and Forecasted Estimates (Till 2035
28.4.5. Green Hydrogen Market for Others (Value, YoY Growth): Historical Trends (Since 2018) and Forecasted Estimates (Till 2035)
28.5. Middle East and North Africa Green Hydrogen Market: Distribution by Storage, 2018, 2024 and 2035
28.5.1. Middle East and North Africa Green Hydrogen Market for Compressed Gas (Value, YoY Growth): Historical Trends (Since 2018) and Forecasted Estimates (Till 2035)
28.5.2. Middle East and North Africa Green Hydrogen Market for Liquid Hydrogen (Value, YoY Growth): Historical Trends (Since 2018) and Forecasted Estimates (Till 2035)
28.5.3. Middle East and North Africa Green Hydrogen Market for Metal Hydrides (Value, YoY Growth): Historical Trends (Since 2018) and Forecasted Estimates (Till 2035)
28.5.4. Middle East and North Africa Green Hydrogen Market for Underground Storage (Value, YoY Growth): Historical Trends (Since 2018) and Forecasted Estimates (Till 2035)
28.6. Middle East and North Africa Green Hydrogen Market: Distribution by Applications, 2018, 2024 and 2035
28.6.1. Middle East and North Africa Green Hydrogen Market for Fuel Cells (Value, YoY Growth): Historical Trends (Since 2018) and Forecasted Estimates (Till 2035)
28.6.2. Middle East and North Africa Green Hydrogen Market for Power-to-Gas (Value, YoY Growth): Historical Trends (Since 2018) and Forecasted Estimates (Till 2035)
28.6.3. Middle East and North Africa Green Hydrogen Market for Ammonia Production (Value, YoY Growth): Historical Trends (Since 2018) and Forecasted Estimates (Till 2035)
28.6.4. Middle East and North Africa Green Hydrogen Market for Methanol Production (Value, YoY Growth): Historical Trends (Since 2018) and Forecasted Estimates (Till 2035)
28.6.5. Middle East and North Africa Green Hydrogen Market for Refining (Value, YoY Growth): Historical Trends (Since 2018) and Forecasted Estimates (Till 2035)
28.7. Middle East and North Africa Green Hydrogen Market: Distribution by Production Scale, 2018, 2024 and 2035
28.7.1. Middle East and North Africa Green Hydrogen Market for Small-scale (< 1 MW) (Value, YoY Growth): Historical Trends (Since 2018) and Forecasted Estimates (Till 2035)
28.7.2. Middle East and North Africa Green Hydrogen Market for Medium-scale (1-10 MW) (Value, YoY Growth): Historical Trends (Since 2018) and Forecasted Estimates (Till 2035)
28.7.3. Middle East and North Africa Green Hydrogen Market for Large-scale (> 10 MW) (Value, YoY Growth): Historical Trends (Since 2018) and Forecasted Estimates (Till 2035)
28.8. Middle East and North Africa Green Hydrogen Market: Distribution by Purity Level, 2018, 2024 and 2035
28.8.1. Middle East and North Africa Green Hydrogen Market for Ultra-high Purity (99.999%+) (Value, YoY Growth): Historical Trends (Since 2018) and Forecasted Estimates (Till 2035)
28.8.2. Middle East and North Africa Green Hydrogen Market for High Purity (99.99%+) (Value, YoY Growth): Historical Trends (Since 2018) and Forecasted Estimates (Till 2035)
28.8.3. Middle East and North Africa Green Hydrogen Market for Standard Purity (99.9%+) (Value, YoY Growth): Historical Trends (Since 2018) and Forecasted Estimates (Till 2035)
28.9. Middle East and North Africa Green Hydrogen Market: Distribution by Type of End Users, 2018, 2024 and 2035
28.9.1. Middle East and North Africa Green Hydrogen Market for Mobility (Value, YoY Growth): Historical Trends (Since 2018) and Forecasted Estimates (Till 2035)
28.9.2. Middle East and North Africa Green Hydrogen Market for Chemical (Value, YoY Growth): Historical Trends (Since 2018) and Forecasted Estimates (Till 2035)
28.9.3. Middle East and North Africa Green Hydrogen Market for Power (Value, YoY Growth): Historical Trends (Since 2018) and Forecasted Estimates (Till 2035)
28.9.4. Middle East and North Africa Green Hydrogen Market for Grid Injection (Value, YoY Growth): Historical Trends (Since 2018) and Forecasted Estimates (Till 2035)
28.9.5. Middle East and North Africa Green Hydrogen Market for Industrial (Value, YoY Growth): Historical Trends (Since 2018) and Forecasted Estimates (Till 2035)
28.9.6. Middle East and North Africa Green Hydrogen Market for Refining (Value, YoY Growth): Historical Trends (Since 2018) and Forecasted Estimates (Till 2035)
28.9.7. Nor Middle East and North Africa Green Hydrogen Market for Others (Value, YoY Growth): Historical Trends (Since 2018) and Forecasted Estimates (Till 2035)
28.10. Green Hydrogen Market in Africa (Value, YoY Growth): Historical Trends (Since 2018) and Forecasted Estimates (Till 2035)
28.11. Green Hydrogen Market in UAE (Value, YoY Growth): Historical Trends (Since 2018) and Forecasted Estimates (Till 2035)
28.12. Green Hydrogen Market in Rest of Middle East and Africa (Value, YoY Growth): Historical Trends (Since 2018) and Forecasted Estimates (Till 2035)
28.13. Data Triangulation and Validation
29. COMPANY PROFILES
29.1. Chapter Overview
29.2. Leading Players in the Green Hydrogen Market
29.2.1. Air Liquide
29.2.1.1. Company Overview
29.2.1.2. Company Portfolio
29.2.1.3. Financial Details
29.2.1.4. Recent Developments and Future Outlook
29.2.2. Air Liquide
29.2.3. Air Products
29.2.4. Bloom Energy
29.2.5. Cummins
29.2.6. Enapter
29.2.7. ENGIE
29.2.8. Green Hydrogen Systems
29.2.9. H&R Olwerke Schindler
29.2.10. ITM Power
29.2.11. Linde
29.2.12. Nel ASA
29.2.13. Plug Power
29.2.14. Siemens Energy
29.2.15. Toshiba Energy Systems & Solutions Corporation
29.2.16. Uniper
30. PORTER'S FIVE FORCES ANALYSIS
30.1. Chapter Overview
30.2. Research Methodology
30.3. Key Parameters
30.3.1. Threats to New Entrants
30.3.2. Bargaining Power of Buyers
30.3.3. Bargaining Power of Product Providers
30.3.4. Threats of Substitute Products
30.3.5. Rivalry among Existing Competitors
30.4. Harvey Ball Analysis
30.5. Concluding Remarks
31. EXECUTIVE INSIGHTS
32. APPENDIX 1: TABULATED DATA
33. APPENDIX 2: LIST OF COMPANIES AND ORGANIZATIONS