디스플레이 시장(-2035년) : 제품 유형별, 기술 유형별, 기능별, 패널 사이즈별, 최종사용자별, 휘도별, 시야각별, 주요 지역별, 산업 동향, 예측
Display Market, Till 2035: Distribution by Type of Product, Type of Technology, Feature, Panel Size, End User, Brightness, Viewing Angle, Key Geographical Regions: Industry Trends and Global Forecasts
상품코드:1721367
리서치사:Roots Analysis
발행일:On Demand Report
페이지 정보:영문 174 Pages
라이선스 & 가격 (부가세 별도)
한글목차
세계 디스플레이 시장 : 개요
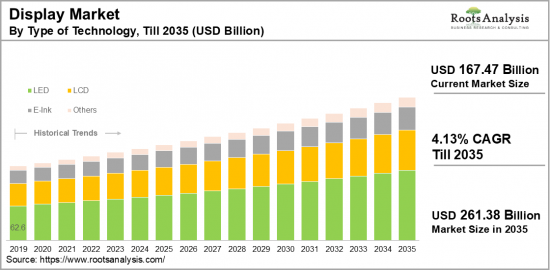
세계 디스플레이 시장 규모는 현재 1,674억 7,000만 달러에서 2035년까지 2,613억 8,000만 달러에 달할 것으로 예상되며, 2035년까지 예측 기간 동안 연평균 4.13% 성장할 것으로 예측됩니다.
디스플레이 시장 : 성장과 동향
디스플레이 분야에서 디지털 기술의 발전은 기업이 타겟 시청자와 연결하고 그들의 관심을 끌 수 있는 더할 나위 없이 좋은 기회를 제공합니다. 다양한 분야에서의 대형화 추세와 첨단 3D 디스플레이부터 차세대 디지털 사이니지 및 비디오 감시 시스템에 이르는 혁신적인 디스플레이 기술의 도입으로 사람들이 정보와 시각적 컨텐츠를 접하는 방식이 크게 변화하고 있습니다. 디스플레이는 정보, 데이터, 이미지, 영상을 시각적 또는 촉각적 방식으로 사용자에게 제시하는 장치 역할을 합니다. 수년 동안 정교한 기술의 발전으로 액정 디스플레이(LCD), LED 디스플레이, OLED 디스플레이 등 다양한 기술이 등장했습니다. 이러한 디스플레이는 태블릿, 노트북, TV, 모니터, 디지털 사이니지 등 다양한 기기에서 널리 사용되고 있습니다.
또한, 시각적 피드백을 제공하고 사용자와 전자 기기 간의 상호 작용을 촉진하는 디스플레이의 역할은 다양한 용도와 부서에서 사용자 경험을 향상시키기 때문에 사용자뿐만 아니라 기업에서도 선호하고 있습니다. 또한, 폴더블 디스플레이, 평면 패널, 터치스크린 기능의 매력은 상업적 요구를 충족시키는 고품질 디스플레이를 원하는 소비자들을 끌어들이고 있습니다. 또한, 소매 산업에서 디지털 디스플레이 솔루션 증가 추세는 기업이 매장 내 경험을 향상시킬 수 있는 새로운 수단을 창출하고 있습니다. 개인화된 상품 제안, 실시간 재고 업데이트, 전자상거래 플랫폼과의 원활한 통합을 제공하는 지능형 데이터 기반 소매 디스플레이는 궁극적으로 판매를 촉진하고 고객 충성도를 높일 수 있습니다. 이러한 요인들로 인해 시장 진출기업들은 기억에 남는 임팩트를 주고, 진화하는 디지털 환경에서 지속적인 성공을 거둘 수 있는 브랜드 가치를 구축하기 위해 이러한 최첨단 디스플레이 솔루션을 채택하고 있습니다.
세계의 디스플레이 시장에 대해 조사했으며, 시장 규모 추정 및 기회 분석, 경쟁 구도, 기업 프로파일, SWOT 분석 등의 정보를 전해드립니다.
목차
제1장 서문
제2장 조사 방법
제3장 경제적 고려사항, 기타 프로젝트 특유의 고려사항
제4장 거시경제 지표
제5장 주요 요약
제6장 서론
제7장 경쟁 구도
제8장 기업 개요
본 장의 개요
AUO Corporation
BOE Technology Group
Box Light Corporation
Chi Mei Corporation
Innolux Corporation
Japan Display
Nippon Sheet Glass
Marvel Technology
Minda Industries
Samsung Electronics
제9장 밸류체인 분석
제10장 SWOT 분석
제11장 세계의 디스플레이 시장
제12장 시장 기회 : 제품 유형별
제13장 시장 기회 : 기술 유형별
제14장 시장 기회 : 기능별
제15장 시장 기회 : 패널 사이즈별
제16장 시장 기회 : 최종사용자별
제17장 시장 기회 : 해상도 유형별
제18장 시장 기회 : 어스펙트비별
제19장 시장 기회 : 터치 기술 유형별
제20장 시장 기회 : 휘도별
제21장 시장 기회 : 시야각별
제22장 시장 기회 : 전력 소비별
제23장 시장 기회 : 내구성별
제24장 시장 기회 : 기업 규모별
제25장 북미의 디스플레이 시장 기회
제26장 유럽의 디스플레이 시장 기회
제27장 아시아의 디스플레이 시장 기회
제28장 중동 및 북아프리카의 디스플레이 시장 기회
제29장 라틴아메리카의 디스플레이 시장 기회
제30장 기타 지역의 디스플레이 시장 기회
제31장 표 형식 데이터
제32장 기업과 조직 리스트
제33장 커스터마이즈 기회
제34장 Roots 구독 서비스
제35장 저자 상세
LSH
영문 목차
영문목차
GLOBAL DISPLAY MARKET: OVERVIEW
As per Roots Analysis, the global display market size is estimated to grow from USD 167.47 billion in the current year to USD 261.38 billion by 2035, at a CAGR of 4.13% during the forecast period, till 2035.
The opportunity for display market has been distributed across the following segments:
Type of Product
Automotive Display
Digital Signage & Large Format Displays
Interactive Monitor
Interactive Table
Interactive Video Wall
Interactive Whiteboard
PC Monitor and Laptop
Smartphones
Smart Wearable
Tablet
Television
Others
Type of Technology
Direct-View LED
E-Paper/E-Ink Display
Liquid Crystal Display (LCD)
IPS LCD
TFT-LCD
TFT-LCD
VA LCD
Others
LED
Micro-LED
Organic Light-Emitting Diode (OLED)
AMOLED
Micro-LED
Mini-LED
PMOLED
Others
OLEDQuantum DOT
Quantum Dot Display
Others
Feature
Flat Panel Display
Flexible Panel Display
Non-Touch Display
Touch Display
Transparent Panel Display
Panel Size
Large display
Medium display
Micro-display
Small display
End-User
Aerospace / Defense
BFSI
Consumer Electronic
Corporate / Industrial Enterprises
Education
Healthcare
Retail
Sports & Entertainment
Transport
Others
Type of Resolution
Full HD (FHD)
HD (High Definition)
4K (Ultra High Definition)
8K (Super High Definition)
Other Resolution
Aspect Ratio
4:3
16:9
16:10
Other Aspect Ratios
Type of Touch Technology
Capacitive Touch
Infrared Touch
Resistive Touch
Other Touch Technologies
Brightness
High Brightness (More than 500 cd/m2)
Low Brightness (Less than 200 cd/m2)
Medium Brightness (200-500 cd/m2)
Viewing Angle
Narrow Viewing Angle
Ultra-Wide Viewing Angle
Wide Viewing Angle
Power Consumption
High Power Consumption (More than 5W)
Low Power Consumption (Less than 1W)
Medium Power Consumption (1-5W)
Durability
High Durability
Scratch Resistant,
Water Resistant
Medium Durability
Low Durability
Geographical Regions
North America
US
Canada
Mexico
Other North American countries
Europe
Austria
Belgium
Denmark
France
Germany
Ireland
Italy
Netherlands
Norway
Russia
Spain
Sweden
Switzerland
UK
Other European countries
Asia
China
India
Japan
Singapore
South Korea
Other Asian countries
Latin America
Brazil
Chile
Colombia
Venezuela
Other Latin American countries
Middle East and North Africa
Egypt
Iran
Iraq
Israel
Kuwait
Saudi Arabia
UAE
Other MENA countries
Rest of the World
Australia
New Zealand
Other countries
DISPLAY MARKET: GROWTH AND TRENDS
The evolution of digital technology in the display sector has opened up unparalleled opportunities for companies to connect with and engage their intended audiences. The increasing trend towards larger screens across various fields, coupled with the introduction of innovative display technologies from advanced 3D displays to next-generation digital signage and video surveillance systems is transforming how people interact with information and visual content. Displays serve as devices that present information, data, images, and videos in a visual or tactile manner for users. Over the years, the rise of sophisticated technology has resulted in a range of technologies, including liquid crystal displays (LCDs), light-emitting diode displays (LEDs), organic light-emitting diode displays (OLEDs), and more. These displays are widely used in numerous devices, encompassing tablets, laptops, televisions, monitors, and digital signage.
Moreover, the role of displays in providing visual feedback and facilitating interaction between users and electronic devices enhances user experience across various applications and sectors, making them a favored option among users and businesses alike. The appeal of foldable displays, flat panels, and touchscreen functionality also attract consumers in search of high-quality displays for their commercial needs. Additionally, the rising trend of digital display solutions in the retail industry has generated new avenues for companies to improve their in-store experiences. Intelligent, data-driven retail displays that offer personalized product suggestions, real-time inventory updates, and seamless integration with e-commerce platforms ultimately boost sales and foster customer loyalty. Given these factors, industry participants are adopting these state-of-the-art display solutions to create a memorable impact and establish their brand value for sustainable success in the ever-evolving digital environment, which will likely enhance the market's growth potential during the forecast period, till 2035.
DISPLAY MARKET: KEY SEGMENTS
Market Share by Type of Product
Based on the type of product, the global display market is segmented into automotive displays, digital signage & large format displays (interactive kiosks, interactive monitors, interactive tables, interactive video walls, interactive whiteboards), PC monitors and laptops, smart wearables, tablets, television, and others. According to our estimates, currently, smartphones segment captures the majority share of the market. This can be attributed to the growing adoption of OLED and flexible displays in smartphones, which provide outstanding color precision and vibrancy, delivering richer and more lifelike visuals. However, wearable segment is anticipated to grow at a higher CAGR during the forecast period.
Market Share by Type of Technology
Based on the type of technology, the display market is segmented into direct-view LED, E-Paper / E-Ink, Liquid Crystal Display (LCD) (IPS LCD, TFT-LCD, TFT-LCD, VA LCD, Others) LED, Micro-LED, Organic Light-Emitting Diode (OLED), AMOLED, Micro-LED, Mini-LED, PMOLED), quantum dot, and others. According to our estimates, currently, OLED displays segment captures the majority share of the market. This can be attributed to the fact that major smartphone manufacturers, including Apple, Samsung, and Google, are increasingly incorporating OLED displays into their devices such as mobiles, tablets, and TVs due to their superior display quality and design versatility, which boosts demand for OLED technology. However, micro-LED segment is anticipated to grow at a higher CAGR during the forecast period.
Market Share by Feature
Based on the feature, the display market is segmented into flat panel display, flexible panel display, non-touch display, touch display, and transparent panel display. According to our estimates, currently, flat panels segment captures the majority share of the market, owing to the fact that flat panels have become standard displays widely used in TVs, monitors, laptops, and tablets. However, touchscreen displays segment is anticipated to grow at a higher CAGR during the forecast period.
Market Share by Panel Size
Based on the panel size, the display market is segmented into large display, medium display, micro-display, and small display. According to our estimates, currently, micro display segment captures the majority share of the market. The use of micro-displays in wearable technology like smartwatches and near-to-eye devices, which require compact screens, greatly benefits from the advantages offered by micro-displays. Additionally, specialized medical devices that utilize micro-displays are anticipated to contribute to market expansion. However, medium display panels segment is anticipated to grow at a higher CAGR during the forecast period.
Market Share by End User
Based on end user, the display market is segmented into aerospace / defense, BFSI, consumer electronics, corporate / industrial enterprises, education, healthcare, retail, sports & entertainment, transport, and others. According to our estimates, currently, consumer electronic segment captures the majority share of the market. This can be attributed to several factors, including the increasing demand for smartphones and consumers' growing preference for larger screens that offer a more immersive viewing experience, especially with the increasing availability of high-definition and ultra-high-definition (4K and 8K) content, along with gamers' preferences for larger displays to enhance their gaming experiences. However, sports and entertainment segment is anticipated to grow at a higher CAGR during the forecast period.
Market Share by Type of Resolution
Based on type of resolution, the display market is segmented into HD, 4K (ultra high definition), 8K (super high definition), and other resolutions. According to our estimates, currently, 4K (ultra-high definition) segment captures the majority share of the market. This can be attributed to the increasing demand for 4K resolution displays, particularly for streaming services and content creation. However, full HD resolution displays segment is anticipated to grow at a higher CAGR during the forecast period.
Market Share by Aspect Ratio
Based on aspect ratio, the display market is segmented into 4:3, 16:9, 16:10, and others. According to our estimates, currently, 16:9 aspect ratio segment captures the majority share of the market. This can be attributed to its status as the standard aspect ratio widely utilized in most consumer electronics such as televisions, monitors, and smartphones. Additionally, it is the most frequently supported aspect ratio for both content consumption and creation. However, 16:10 aspect ratio segment is anticipated to grow at a higher CAGR during the forecast period.
Market Share by Type of Touch Technology
Based on type of touch technology, the display market is segmented into capacitive touch, infrared touch, resistive touch, and other touch technologies. According to our estimates, currently, capacitive touch segment captures the majority share of the market. The rise in consumer electronics, such as smartphones, computers, tablets, and other devices that demand high performance in touch sensitivity and user experience, drives the expansion of this segment. As a result, the segment is projected to grow during the forecast period.
Market Share by Brightness
Based on brightness, the display market is segmented into high brightness (more than 500 cd/m2, low brightness (less than 200 cd/m2), and medium brightness (200-500 cd/m2). Medium brightness (200-500 cd/m2) is particularly dominant in consumer electronics such as TVs, mobile devices, tablets, and iPads, leading to its majority share in the market. Additionally, its benefits in providing better visibility in bright and outdoor settings, as well as improved high dynamic range (HDR) performance, are expected to lead to significant growth at a considerable CAGR during the forecast period.
Market Share by Type of Viewing
Based on type of viewing, the display market is segmented into narrow viewing angles, ultra-wide viewing angles, and wide viewing angles. According to our estimates, currently, wide viewing angles segment captures the majority share of the market. Wide viewing angles are commonly used in consumer electronics where shared viewing happens frequently, and their varied color brightness consistency contributes to them holding the largest market share in this segment. Moreover, the demand for high-end and professional screens boosts market growth. However, ultra-wide viewing angles segment is anticipated to grow at a higher CAGR during the forecast period.
Market Share by Power Consumption
Based on power consumption, the display market is segmented into high power consumption (more than 5W), low power consumption (less than 1W), and medium power consumption (1-5W). According to our estimates, currently, medium power consumption (1-5W) segment captures the majority share of the market. This can be attributed to their well-rounded performance and efficiency, making them well-suited for a variety of consumer electronics, with designs that enhance energy efficiency.
Market Share by Durability
Based on durability, the display market is segmented into high durability (scratch-resistant, water-resistant), low durability, and medium durability. According to our estimates, currently, high-durability displays segment captures the majority share of the market. This can be attributed to the rising consumer demand for robust, reliable devices that can withstand daily wear and accidental damage. This feature is especially important in mobiles, wearables, and tablets, as these devices are particularly vulnerable to scratches and water exposure.
Market Share by Geographical Regions
Based on the geographical regions, the display market is segmented into North America, Europe, Asia, Latin America, Middle East and North Africa, and Rest of the World. According to our estimates, currently, North America captures the majority share of the market. This can be attributed to the strong demand for interactive displays in corporate, retail, and educational sectors due to their high resolution and enhanced audience engagement. Further, the presence of industry leaders with a diverse range of products contributes to the growth of the market in this region. However, the market share in Asia is anticipated to grow at a higher CAGR during the forecast period.
Example Players in Display Market
AUO Corporation
BOE Technology Group
Box Light Corporation
Chi Mei Corporation
Innolux Corporation
Japan Display
Leyard Optoelectronic
LG Display
Marvel Technology
Minda Industries
Mitsubishi Electric
NEC Corporation
Panasonic Corporation
Samsung Electronics
Sharp Corporation
Sony Corporation
DISPLAY MARKET: RESEARCH COVERAGE
The report on the display market features insights on various sections, including:
Market Sizing and Opportunity Analysis: An in-depth analysis of the display market, focusing on key market segments, including [A] type of products, [B] type of technology, [C] feature, [D] panel size, [E] type of end-user, [F] type of resolution, [G] aspect ratio, [H] type of touch technology, [I] brightness, [J] viewing angle, [K] power consumption, [L] durability and [M] geographical regions.
Competitive Landscape: A comprehensive analysis of the companies engaged in the Display market, based on several relevant parameters, such as [A] year of establishment, [B] company size, [C] location of headquarters, [D] ownership structure.
Company Profiles: Elaborate profiles of prominent players engaged in the Display market, providing details on [A] location of headquarters, [B]company size, [C] company mission, [D] company footprint, [E] management team, [F] contact details, [G] financial information, [H] operating business segments, [I] display portfolio, [J] moat analysis, [K] recent developments, and an informed future outlook.
SWOT Analysis: An insightful SWOT framework, highlighting the strengths, weaknesses, opportunities and threats in the domain. Additionally, it provides Harvey ball analysis, highlighting the relative impact of each SWOT parameter.
KEY QUESTIONS ANSWERED IN THIS REPORT
How many companies are currently engaged in display market?
Which are the leading companies in this market?
What factors are likely to influence the evolution of this market?
What is the current and future market size?
What is the CAGR of this market?
How is the current and future market opportunity likely to be distributed across key market segments?
Which type of display is expected to dominate the market?
REASONS TO BUY THIS REPORT
The report provides a comprehensive market analysis, offering detailed revenue projections of the overall market and its specific sub-segments. This information is valuable to both established market leaders and emerging entrants.
Stakeholders can leverage the report to gain a deeper understanding of the competitive dynamics within the market. By analyzing the competitive landscape, businesses can make informed decisions to optimize their market positioning and develop effective go-to-market strategies.
The report offers stakeholders a comprehensive overview of the market, including key drivers, barriers, opportunities, and challenges. This information empowers stakeholders to stay abreast of market trends and make data-driven decisions to capitalize on growth prospects.
ADDITIONAL BENEFITS
Complimentary Excel Data Packs for all Analytical Modules in the Report
10% Free Content Customization
Detailed Report Walkthrough Session with Research Team
Free Updated report if the report is 6-12 months old or older
TABLE OF CONTENTS
1. PREFACE
1.1. Introduction
1.2. Market Share Insights
1.3. Key Market Insights
1.4. Report Coverage
1.5. Key Questions Answered
1.6. Chapter Outlines
2. RESEARCH METHODOLOGY
2.1. Chapter Overview
2.2. Research Assumptions
2.3. Database Building
2.3.1. Data Collection
2.3.2. Data Validation
2.3.3. Data Analysis
2.4. Project Methodology
2.4.1. Secondary Research
2.4.1.1. Annual Reports
2.4.1.2. Academic Research Papers
2.4.1.3. Company Websites
2.4.1.4. Investor Presentations
2.4.1.5. Regulatory Filings
2.4.1.6. White Papers
2.4.1.7. Industry Publications
2.4.1.8. Conferences and Seminars
2.4.1.9. Government Portals
2.4.1.10. Media and Press Releases
2.4.1.11. Newsletters
2.4.1.12. Industry Databases
2.4.1.13. Roots Proprietary Databases
2.4.1.14. Paid Databases and Sources
2.4.1.15. Social Media Portals
2.4.1.16. Other Secondary Sources
2.4.2. Primary Research
2.4.2.1. Introduction
2.4.2.2. Types
2.4.2.2.1. Qualitative
2.4.2.2.2. Quantitative
2.4.2.3. Advantages
2.4.2.4. Techniques
2.4.2.4.1. Interviews
2.4.2.4.2. Surveys
2.4.2.4.3. Focus Groups
2.4.2.4.4. Observational Research
2.4.2.4.5. Social Media Interactions
2.4.2.5. Stakeholders
2.4.2.5.1. Company Executives (CXOs)
2.4.2.5.2. Board of Directors
2.4.2.5.3. Company Presidents and Vice Presidents
2.4.2.5.4. Key Opinion Leaders
2.4.2.5.4. Research and Development Heads
2.4.2.5.2. Technical Experts
2.4.2.5.3. Subject Matter Experts
2.4.2.5.4. Scientists
2.4.2.5.4. Doctors and Other Healthcare Providers
2.4.2.6. Ethics and Integrity
2.4.2.6.1. Research Ethics
2.4.2.6.2. Data Integrity
2.4.3. Analytical Tools and Databases
3. ECONOMIC AND OTHER PROJECT SPECIFIC CONSIDERATIONS
3.1. Forecast Methodology
3.1.1. Top-Down Approach
3.1.2. Bottom-Up Approach
3.1.3. Hybrid Approach
3.2. Market Assessment Framework
3.2.1. Total Addressable Market (TAM)
3.2.2. Serviceable Addressable Market (SAM)
3.2.3. Serviceable Obtainable Market (SOM)
3.2.4. Currently Acquired Market (CAM)
3.3. Forecasting Tools and Techniques
3.3.1. Qualitative Forecasting
3.3.2. Correlation
3.2.3. Regression
3.3.4. Time Series Analysis
3.3.5. Extrapolation
3.3.6. Convergence
3.3.7. Forecast Error Analysis
3.3.8. Data Visualization
3.3.9. Scenario Planning
3.3.10. Sensitivity Analysis
3.4. Key Considerations
3.4.1. Demographics
3.4.2. Market Access
3.4.3. Reimbursement Scenarios
3.4.4. Industry Consolidation
3.5. Robust Quality Control
3.6. Key Market Segmentations
3.7 Limitations
4. MACRO-ECONOMIC INDICATORS
4.1. Chapter Overview
4.2. Market Dynamics
4.2.1. Time Period
4.2.1.1. Historical Trends
4.2.1.2. Current and Forecasted Estimates
4.2.2. Currency Coverage
4.2.2.1. Overview of Major Currencies Affecting the Market
4.2.2.2. Impact of Currency Fluctuations on the Industry
4.2.3. Foreign Exchange Impact
4.2.3.1. Evaluation of Foreign Exchange Rates and Their Impact on Market
4.2.3.2. Strategies for Mitigating Foreign Exchange Risk
4.2.4. Recession
4.2.4.1. Historical Analysis of Past Recessions and Lessons Learnt
4.2.4.2. Assessment of Current Economic Conditions and Potential Impact on the Market
4.2.5. Inflation
4.2.5.1. Measurement and Analysis of Inflationary Pressures in the Economy
4.2.5.2. Potential Impact of Inflation on the Market Evolution
4.2.6. Interest Rates
4.2.5.1. Overview of Interest Rates and Their Impact on the Market
4.2.5.2. Strategies for Managing Interest Rate Risk
4.2.7. Commodity Flow Analysis
4.2.7.1. Type of Commodity
4.2.7.2. Origins and Destinations
4.2.7.3. Values and Weights
4.2.7.4. Modes of Transportation
4.2.8. Global Trade Dynamics
4.2.8.1. Import Scenario
4.2.8.2. Export Scenario
4.2.9. War Impact Analysis
4.2.9.1. Russian-Ukraine War
4.2.9.2. Israel-Hamas War
4.2.10. COVID Impact / Related Factors
4.2.10.1. Global Economic Impact
4.2.10.2. Industry-specific Impact
4.2.10.3. Government Response and Stimulus Measures
4.2.10.4. Future Outlook and Adaptation Strategies
4.2.11. Other Indicators
4.2.11.1. Fiscal Policy
4.2.11.2. Consumer Spending
4.2.11.3. Gross Domestic Product (GDP)
4.2.11.4. Employment
4.2.11.5. Taxes
4.2.11.6. R&D Innovation
4.2.11.7. Stock Market Performance
4.2.11.8. Supply Chain
4.2.11.9. Cross-Border Dynamics
5. EXECUTIVE SUMMARY
6. INTRODUCTION
6.1. Chapter Overview
6.2. Overview of Display
6.2.1. Type of Product
6.2.2. Type of Technology
6.2.3. Type of Feature
6.2.4. Type of Resolution
6.3. Future Perspective
7. COMPETITIVE LANDSCAPE
7.1. Chapter Overview
7.2. Display: Overall Market Landscape
7.2.1. Analysis by Year of Establishment
7.2.2. Analysis by Company Size
7.2.3. Analysis by Location of Headquarters
7.2.4. Analysis by Ownership Structure
8. COMPANY PROFILES
8.1. Chapter Overview
8.2.1. AUO Corporation*
8.2.1.1. Company Overview
8.2.1.2. Company Mission
8.2.1.3. Company Footprint
8.2.1.4. Management Team
8.2.1.5. Contact Details
8.2.1.6. Financial Performance
8.2.1.7. Operating Business Segments
8.2.1.7. Service / Product Portfolio (project specific)
8.2.1.9. MOAT Analysis
8.2.1.10. Recent Developments and Future Outlook
8.2.2. BOE Technology Group
8.2.3. Box Light Corporation
8.2.4. Chi Mei Corporation
8.2.5. Innolux Corporation
8.2.6. Japan Display
8.2.7. Nippon Sheet Glass
8.2.8. Marvel Technology
8.2.9. Minda Industries
8.2.10. Samsung Electronics
9. VALUE CHAIN ANALYSIS
10. SWOT ANALYSIS
11. GLOBAL Display MARKET
11.1. Chapter Overview
11.2. Key Assumptions and Methodology
11.3. Trends Disruption Impacting Market
11.4. Global Display Market, Historical Trends (Since 2019) and Forecasted Estimates (Till 2035)
11.5. Multivariate Scenario Analysis
11.5.1. Conservative Scenario
11.5.2. Optimistic Scenario
11.6. Key Market Segmentations
12. MARKET OPPORTUNITIES BASED ON TYPE OF PRODUCT
12.1. Chapter Overview
12.2. Key Assumptions and Methodology
12.3. Revenue Shift Analysis
12.4. Market Movement Analysis
12.5. Penetration-Growth (P-G) Matrix
12.6. Display Market for Automotive Display: Historical Trends (Since 2019) and Forecasted Estimates (Till 2035)
12.7. Display Market for Digital Signage & Large Format Displays: Historical Trends (Since 2019) and Forecasted Estimates (Till 2035)
12.8. Display Market for PC Monitor and Laptop: Historical Trends (Since 2019) and Forecasted Estimates (Till 2035)
12.9. Display Market for Smartphones: Historical Trends (Since 2019) and Forecasted Estimates (Till 2035)
12.10. Display Market for Smart Wearable: Historical Trends (Since 2019) and Forecasted Estimates (Till 2035)
12.11. Display Market for Tablet: Historical Trends (Since 2019) and Forecasted Estimates (Till 2035)
12.12. Display Market for Television: Historical Trends (Since 2019) and Forecasted Estimates (Till 2035)
12.9. Data Triangulation and Validation
13. MARKET OPPORTUNITIES BASED ON TYPE OF TECHNOLOGY
13.1. Chapter Overview
13.2. Key Assumptions and Methodology
13.3. Revenue Shift Analysis
13.4. Market Movement Analysis
13.5. Penetration-Growth (P-G) Matrix
13.6. Display Market for Direct-View LED: Historical Trends (Since 2019) and Forecasted Estimates (Till 2035)
13.7. Display Market for E-Paper / E-Paper Ink: Historical Trends (Since 2019) and Forecasted Estimates (Till 2035)
13.8. Display Market for LCD: Historical Trends (Since 2019) and Forecasted Estimates (Till 2035)
13.9. Display Market for Micro-LED: Historical Trends (Since 2019) and Forecasted Estimates (Till 2035)
13.10. Display Market for OLED: Historical Trends (Since 2019) and Forecasted Estimates (Till 2035)
13.11. Display Market for Quantum DOT: Historical Trends (Since 2019) and Forecasted Estimates (Till 2035)
13.12. Display Market for Others: Historical Trends (Since 2019) and Forecasted Estimates (Till 2035)
13.13. Data Triangulation and Validation
14. MARKET OPPORTUNITIES BASED ON FEATURE
14.1. Chapter Overview
14.2. Key Assumptions and Methodology
14.3. Revenue Shift Analysis
14.4. Market Movement Analysis
14.5. Penetration-Growth (P-G) Matrix
14.6. Display Market for Flat Panel Display: Historical Trends (Since 2019) and Forecasted Estimates (Till 2035)
14.7. Display Market for Flexible Panel Display: Historical Trends (Since 2019) and Forecasted Estimates (Till 2035)
14.8. Display Market for Non-Touch Display: Historical Trends (Since 2019) and Forecasted Estimates (Till 2035)
14.9. Display Market for Touch Display: Historical Trends (Since 2019) and Forecasted Estimates (Till 2035)
14.10. Display Market for Transparent Panel Display: Historical Trends (Since 2019) and Forecasted Estimates (Till 2035)
14.11. Data Triangulation and Validation
15. MARKET OPPORTUNITIES BASED ON PANEL SIZE
15.1. Chapter Overview
15.2. Key Assumptions and Methodology
15.3. Revenue Shift Analysis
15.4. Market Movement Analysis
15.5. Penetration-Growth (P-G) Matrix
15.6. Display Market for Large Display: Historical Trends (Since 2019) and Forecasted Estimates (Till 2035)
15.7. Display Market for Medium Display: Historical Trends (Since 2019) and Forecasted Estimates (Till 2035)
15.8. Display Market for Micro-display: Historical Trends (Since 2019) and Forecasted Estimates (Till 2035)
15.9. Display Market for Small Display: Historical Trends (Since 2019) and Forecasted Estimates (Till 2035)
15.10. Data Triangulation and Validation
16. MARKET OPPORTUNITIES BASED ON END-USER
16.1. Chapter Overview
16.2. Key Assumptions and Methodology
16.3. Revenue Shift Analysis
16.4. Market Movement Analysis
16.5. Penetration-Growth (P-G) Matrix
16.6. Display Market for Aerospace/ Defense: Historical Trends (Since 2019) and Forecasted Estimates (Till 2035)
16.7. Display Market for BFSI: Historical Trends (Since 2019) and Forecasted Estimates (Till 2035)
16.8. Display Market for Consumer Electronic: Historical Trends (Since 2019) and Forecasted Estimates (Till 2035)
16.8. Display Market for Corporate/ Industrial Enterprises: Historical Trends (Since 2019) and Forecasted Estimates (Till 2035)
16.9. Display Market for Education: Historical Trends (Since 2019) and Forecasted Estimates (Till 2035)
16.10. Display Market for Healthcare: Historical Trends (Since 2019) and Forecasted Estimates (Till 2035)
16.11. Display Market for Retail: Historical Trends (Since 2019) and Forecasted Estimates (Till 2035)
16.12. Display Market for Sports & Entertainment: Historical Trends (Since 2019) and Forecasted Estimates (Till 2035)
16.13. Display Market for Transport: Historical Trends (Since 2019) and Forecasted Estimates (Till 2035)
16.14. Display Market for Others: Historical Trends (Since 2019) and Forecasted Estimates (Till 2035)
16.15. Data Triangulation and Validation
17. MARKET OPPORTUNITIES BASED ON TYPE OF RESOLUTION
17.1. Chapter Overview
17.2. Key Assumptions and Methodology
17.3. Revenue Shift Analysis
17.4. Market Movement Analysis
17.5. Penetration-Growth (P-G) Matrix
17.6. Display Market for 4K (Ultra High Definition): Historical Trends (Since 2019) and Forecasted Estimates (Till 2035)
17.7. Display Market for 8K (Super High Definition): Historical Trends (Since 2019) and Forecasted Estimates (Till 2035)
17.8. Display Market for Full HD: Historical Trends (Since 2019) and Forecasted Estimates (Till 2035)
17.9. Display Market for HD (High Definition): Historical Trends (Since 2019) and Forecasted Estimates (Till 2035)
17.10. Display Market for Other Resolutions: Historical Trends (Since 2019) and Forecasted Estimates (Till 2035)
17.11. Data Triangulation and Validation
18. MARKET OPPORTUNITIES BASED ON ASPECT RATIO
18.1. Chapter Overview
18.2. Key Assumptions and Methodology
18.3. Revenue Shift Analysis
18.4. Market Movement Analysis
18.5. Penetration-Growth (P-G) Matrix
18.6. Display Market for 4:3: Historical Trends (Since 2019) and Forecasted Estimates (Till 2035)
18.7. Display Market for 16:9: Historical Trends (Since 2019) and Forecasted Estimates (Till 2035)