


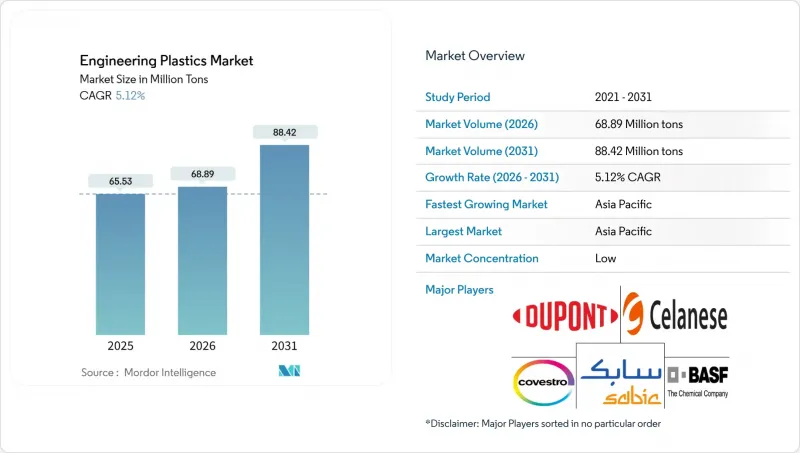
엔지니어링 플라스틱 시장은 2025년에 6,225만 톤으로 평가되었으며, 2026년 6,538만 톤에서 2031년까지 8,354만 톤에 달할 것으로 예측됩니다.
예측 기간(2026-2031년) 동안 CAGR은 5.03%로 예상됩니다.
이러한 수요는 모빌리티 및 항공우주 분야의 경량화 프로그램, 차량 및 산업 장비의 전동화, 반도체 제조의 보급 확대에 기인하며, 모두 높은 강도 대 중량비와 기하학적 자유도를 제공하는 재료를 필요로 합니다. 아시아태평양의 생산능력에 대한 지속적인 설비 투자, 상업적 규모의 화학적 재활용의 출현, 연비 개선 및 탄소 감축을 위한 규제 추진은 성장 모멘텀을 더욱 강화시키고 있습니다.
자동차 연비 규제(예: 미국 CAFE 목표 2025년까지 54.5mpg 달성)로 인해 OEM(자동차 제조사)의 경량화 노력이 강화되고 있으며, 질량을 10% 줄일 때마다 6-8%의 연비 개선이 예상됩니다. 항공기 프로그램도 비슷한 추세를 보이고 있습니다. 보잉787은 50%의 복합재 비율로 22%의 연료 절감 효과를 달성했고, 에어버스 A350은 53%의 복합재 사용으로 비슷한 효과를 달성했습니다. 탄소섬유 강화 열가소성 수지는 열경화성 수지와 달리 재가열 및 재활용이 가능하여 점유율이 확대되고 있으며, 자동 섬유 배치 기술로 사이클 타임도 단축되고 있습니다. 풍력 터빈 블레이드는 현재 항공우주 산업보다 더 많은 양의 탄소섬유를 소비하고 있으며, 100미터 블레이드의 경우 유리섬유 설계에 비해 질량을 38% 줄였습니다. 이러한 성공사례는 휠, 시트, 항공기 2차 구조물용 폴리머 기반 구조를 평가하는 OEM 업체들의 신뢰를 높이고 있습니다.
고전압 전기자동차는 우수한 난연성과 절연 저항성을 갖춘 하우징이 필요하며, 폴리페닐렌설파이드, 폴리에테르에테르케톤, 유리섬유 강화 폴리아미드에 대한 수요를 증가시키고 있습니다. 테슬라의 옵티머스 프로토타입과 같은 로봇 라인에서 PEEK의 연속 사용 시 내구성이 주목받고 있으며, 액추에이터용 고급 등급의 유효성이 입증되었습니다. AI 칩용 반도체 팹에서는 260℃ 이상에서도 치수 안정성을 유지하는 액정 폴리머를 미세 피치 커넥터에 채택하여 무연 리플로우 시 신호 무결성을 보장하고 있습니다. 400V에서 800V로 전기자동차(EV) 아키텍처가 전환됨에 따라 절연 내력에 대한 부하가 증가하고 있으며, OEM 제조업체는 비교 추적 지수(CTI) 600 이상의 절연재를 요구하고 있습니다. 한편, 열 폭주 방지 장벽은 중금속 차폐에 의존하지 않고 열 전파를 방지하기 위해 폴리카보네이트-토실록산 블렌드의 채택이 증가하고 있습니다.
프로필렌과 에틸렌의 가격은 원유 가격의 변동에 연동됩니다. 이는 아시아 크래커가 나프타에 크게 의존하고 있기 때문이며, 원유 가격이 배럴당 10달러 상승하면 프로필렌 비용은 톤당 90달러 증가하여 고정 가격의 OEM 계약으로 판매할 경우 컨버터의 수익률을 압박하기 때문입니다. 2025년 상반기 중국의 스티렌 모노머 생산능력은 2,151만 톤에 달해 세계 공급량의 49%를 차지했습니다. 이로 인해 고비용 생산자의 현금 비용보다 낮은 현물 가격의 폭락이 발생했습니다. 주요 경제국 간의 관세 인상은 무역 흐름을 더욱 왜곡시켜 스티렌계 ABS 및 폴리카보네이트 공장에 급격한 생산량 감축을 강요하고 있습니다. 특히 폴리이미드 등 고성능 수지는 특수 디안하이드레이트 모노머가 범용 원료 가격의 4-5배에 거래되고 있어, 타이트한 다운스트림 시장의 가격 상승분을 전가할 수 있는 여지가 제한적이어서 가격 변동에 큰 영향을 받고 있습니다.
폴리에틸렌 테레프탈레이트(PET)는 음료 및 경질 포장재에 대한 보편적인 수요에 힘입어 2025년에도 엔지니어링 플라스틱 시장에서 50.05%의 압도적인 점유율을 유지할 것으로 예상됩니다. 그러나 이 부문은 일회용 제품에 대한 수요가 급증하는 상황과 공정 투자를 필요로 하는 재생 소재 함량 목표의 상향 조정에 직면해 있습니다. 자동차 제조업체들이 인장강도를 유지하면서 스코프3 배출량을 줄이기 위해 바이오 기반 PA11을 선택하는 움직임에 따라 폴리아미드 블렌드가 다시금 주목받고 있습니다. 불소수지는 엔지니어링 플라스틱 시장에서 한 자릿수 중반의 점유율에 불과하지만, 독보적인 내화학성 및 내열성이 항공우주용 전선 코팅 및 7nm 이하 칩 제조를 뒷받침하기 때문에 7.34%의 가장 빠른 CAGR을 기록하고 있습니다.
폴리설폰, PEEK(폴리에테르에테르케톤), 액정 폴리머는 융점이 280℃ 이상, 연속 사용 온도가 240℃를 초과하는 틈새 용도에 적합합니다. 폴리카보네이트는 비스페놀A(BPA) 함유가 우려되는 식품 용기, 내충격성으로 인해 유리제품 및 가전제품 케이스 분야에서 선도적인 지위를 유지하고 있습니다. 폴리옥시메틸렌은 기어 및 윈도우 리프터에 대한 가공적합성을 제공하며, 스티렌 공중합체는 범용 ABS 수지와 특수 블렌드의 중간적 특성을 가지고 있어 강도와 비용의 균형이 요구되는 가전제품 프레임의 표준 소재로 사용되고 있습니다.
엔지니어링 플라스틱 시장 보고서는 수지 종류(불소수지, 액정 폴리머, 폴리아미드, 폴리부틸렌 테레프탈레이트, 폴리카보네이트 등), 최종사용자 산업(항공우주, 자동차, 건축 및 건설 등), 지역(아시아태평양, 북미, 유럽, 남미, 중동 및 아프리카) 별로 분류됩니다. 분류되어 있습니다. 시장 예측은 톤 및 금액(달러)으로 제공됩니다.
아시아태평양은 2025년 엔지니어링 플라스틱 시장 점유율의 55.10%를 차지할 것으로 예상되며, 중국과 인도의 생산능력 확대, 전기자동차(EV) 보급 가속화, 지속적인 전자제품 수출 수요에 힘입어 2031년까지 CAGR 5.38%로 확대될 것으로 전망됩니다. 중국의 스티렌 생산량은 이미 세계 생산량의 49%를 차지하여 지역 가격 주도권을 강화하고 있습니다. 동시에 국가 정책은 고부가가치 폴리머의 자급자족을 촉진하고 있습니다. 인도는 세액공제 및 수입관세 감면을 활용하여 남부 자동차 산업 거점으로 눈을 돌리는 다국적 성형업체를 유치하고 있습니다. 일본은 반도체 포토마스크용 초순수 폴리머에 집중하고 있으며, 이는 이 지역이 대량생산에서 고부가가치까지 폭넓은 분야를 커버하고 있음을 보여줍니다.
북미에서는 민간 항공우주 분야의 견조한 수요와 미시간 주에서 조지아 주에 이르는 확장 중인 배터리 제조 회랑이 뒷받침하고 있습니다. 화학 재활용 제품에 적용되는 미국 세법 S 45Z 청정연료 세액공제를 포함한 첨단 재활용에 대한 법적 지원은 순환경제의 혁신을 촉진하고 있습니다. 유럽은 그린딜을 통해 지속가능성 리더십을 추진하고 있으며, 바이오 기반 PA와 화학적 재생 폴리카보네이트의 연구개발을 촉진하고 있습니다. 그러나 높은 전력 비용과 PFAS에 대한 논의가 불소수지 생산능력 확대의 걸림돌로 작용하고 있습니다.
남미에서는 브라질과 아르헨티나의 자동차 산업 현지화에 따라 점진적인 성장세를 보이고 있으나, 고성능 등급은 여전히 순 수입 의존도가 높은 상황입니다. 중동 및 아프리카는 ADNOC의 수직계열화 전략을 계기로 투자처로 부상하고 있으며, 코베스트로의 생산능력 시너지가 실현된다면 특수 엔지니어링 수지의 잠재적 순수출 지역이 될 수 있는 가능성을 가지고 있습니다. 모든 지역에서 공급망의 세계화로 인해 엔지니어링 플라스틱 시장의 규모는 단순히 수지 생산기지의 확대가 아닌, 다운스트림 제조업의 변화와 함께 변화하고 있습니다.
The Engineering Plastics Market was valued at 62.25 million tons in 2025 and estimated to grow from 65.38 million tons in 2026 to reach 83.54 million tons by 2031, at a CAGR of 5.03% during the forecast period (2026-2031).

Demand stems from lightweighting programs across the mobility and aerospace sectors, the electrification of vehicles and industrial equipment, and the growing adoption of semiconductor fabrication, all of which reward materials that offer high strength-to-weight ratios and geometric freedom. Sustained capital spending on Asia-Pacific capacity, the emergence of chemical recycling at a commercial scale, and regulatory pushes for fuel economy and carbon reduction further reinforce growth momentum.
Automotive fuel-economy mandates, such as the US CAFE target of 54.5 mpg by 2025, intensify OEM (original equipment manufacturer) focus on weight reduction, and every 10% mass cut yields 6-8% efficiency gains. Aircraft programs illustrate parallel dynamics: the Boeing 787 achieved 22% fuel savings with 50% composite content, while the Airbus A350 utilizes 53% composites to achieve a similar effect. Carbon-fiber-reinforced thermoplastics gain share because they can be reheated and recycled, unlike thermosets, and automated fiber placement lowers cycle times. Wind-turbine blades now consume larger volumes of carbon fiber than the aerospace industry, with 100-meter blades trimming mass by 38% compared to glass-fiber designs. These successes raise confidence among OEMs evaluating polymer-based structures for wheels, seating, and secondary aircraft structures.
High-voltage electric vehicles require enclosures that offer robust flame retardancy and dielectric strength, pushing polyphenylene sulfide, polyether ether ketone, and glass-filled polyamide consumption upward. Robotics lines such as Tesla's Optimus prototype highlight PEEK's longevity under continuous duty, validating higher-end grades for actuators. Semiconductor fabs scaling for AI chips adopt liquid-crystal polymers for fine-pitch connectors that remain dimensionally stable above 260 °C, preserving signal integrity during lead-free reflow. The migration from 400-V to 800-V EV (electric vehicle) architectures amplifies dielectric stress, prompting OEMs to specify insulation with comparative tracking index (CTI) values above 600. Meanwhile, thermal-runaway barriers increasingly incorporate polycarbonate-siloxane blends to prevent heat propagation without resorting to heavy metallic shields.
Propylene and ethylene prices track crude swings because Asian crackers rely heavily on naphtha; a USD 10/bbl oil jump can increase propylene costs by USD 90/ton, compressing converters' margins when selling into fixed-price OEM contracts. China's styrene monomer capacity reached 21.51 million tons in H1 2025, accounting for 49% of the global supply and triggering spot price collapses below cash costs for high-cost producers. Tariff escalations between major economies further distort trade flows, forcing rapid output cuts at styrene-based ABS and polycarbonate plants. Volatility particularly stings high-performance resins such as polyimide, whose specialized dianhydride monomers command 4-5X commodity feedstock prices, limiting the ability to pass on surges in tight downstream markets.
Other drivers and restraints analyzed in the detailed report include:
For complete list of drivers and restraints, kindly check the Table Of Contents.
Polyethylene terephthalate (PET) maintained a commanding 50.05% engineering plastics market share in 2025, driven by ubiquitous demand for beverages and rigid packaging. Yet the segment contends with plateauing single-use volumes and mounting recycled-content targets that require process investments. Polyamide blends are gaining renewed traction as automakers opt for bio-based PA11 to reduce scope 3 emissions without compromising tensile strength. Fluoropolymers, although comprising only a mid-single-digit slice of the engineering plastics market, post the fastest 7.34% CAGR because their unrivaled chemical and thermal resistance support aerospace wire coatings and sub-7 nm chip making.
Polysulfones, PEEK (Polyetheretherketone or Polyether Ether Ketone), and liquid-crystal polymers are suitable for niche applications where melting points exceed 280°C and continuous-use temperatures surpass 240°C. Polycarbonate endures scrutiny for BPA (Bisphenol A) in foodware but retains dominance in glazing and consumer electronics housings due to its impact resilience. Polyoxymethylene offers machining ease for gears and window lifters, while styrene copolymers bridge the gap between commodity ABS (Acrylonitrile Butadiene Styrene) and specialty blends, making them a go-to for appliance frames that require balanced toughness and cost.
The Engineering Plastics Market Report is Segmented by Resin Type (Fluoropolymer, Liquid Crystal Polymer, Polyamide, Polybutylene Terephthalate, Polycarbonate, and More), End-User Industry (Aerospace, Automotive, Building and Construction, and More), and Geography (Asia-Pacific, North America, Europe, South America, and Middle East and Africa). The Market Forecasts are Provided in Terms of Volume (Tons) and Value (USD).
The Asia-Pacific region led with a 55.10% engineering plastics market share in 2025 and is expected to expand at a 5.38% CAGR through 2031, driven by the build-out of Chinese and Indian capacities, accelerating EV adoption, and sustained electronics export demand. Chinese styrene production, already 49% of global output, reinforces regional price leadership, while state policies encourage high-value polymer self-sufficiency. India leverages tax credits and import duty relief to draw multinational molders eyeing southern automotive hubs. Japan focuses on ultra-high-purity polymers for semiconductor photomasks, demonstrating the region's spectrum from volume to value.
North America enjoys robust demand from the commercial aerospace sector and an expanding battery-manufacturing corridor that stretches from Michigan to Georgia. Legislative support for advanced recycling, including the US Internal Revenue Code S 45Z clean-fuel credits applicable to chemical recycling outputs, incentivizes innovation in the circular economy. Europe champions sustainability leadership through the Green Deal, spurring R&D in bio-based PA and chemically recycled polycarbonate, although high power costs and PFAS debates weigh on fluoropolymer capacity additions.
South America sees incremental growth tied to automotive localization in Brazil and Argentina, yet remains net-import-reliant for high-performance grades. Middle East & Africa emerge as investment destinations following ADNOC's vertical integration move, which positions the region as a potential net exporter of specialty engineering resins once Covestro capacity synergies materialize. Across all regions, the globalization of supply chains means that engineering plastics market size evolves in lock-step with downstream manufacturing shifts rather than mere resin production footprints.