


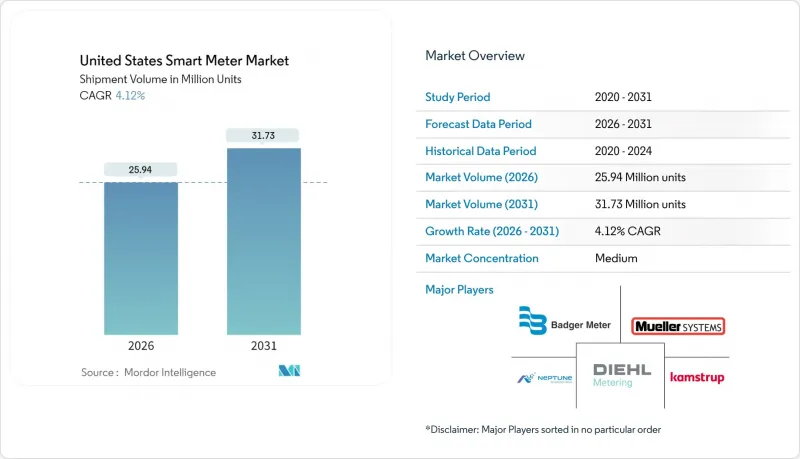
2026년 미국 스마트 미터 시장 규모는 2,594만 대와 추정되고, 2025년 2,491만 대에서 성장이 전망됩니다.
2031년에는 3,173만 대에 달할 것으로 예상되며, 2026년부터 2031년까지 CAGR 4.12%로 확대될 전망입니다.

이러한 급격한 성장은 연방정부의 인프라 투자, 주정부 차원의 재생에너지 의무화 정책, 그리고 전력회사들이 기존 아날로그 장비에서 탈피하려는 움직임이 뒷받침하고 있습니다. 하드웨어가 여전히 자본 지출의 대부분을 차지하고 있지만, 데이터 관리, 사이버 보안 모니터링, 고급 분석이 구독 모델로 전환됨에 따라 지속적인 서비스 수익이 증가하고 있습니다. 신규 설치의 대부분은 투자자가 소유한 유틸리티가 차지하고 있지만, 연방 자금에 직접 접근할 수 있는 권한을 획득한 지역 전력 협동조합이 그 격차를 빠르게 좁히고 있습니다. 통신 기술은 다양화되고 있으며, RF 메시가 기반이 되는 한편, 인구가 적은 서비스 지역에서는 셀룰러 및 NB-IoT 연결이 가속화되고 있습니다. 이러한 추세는 종합적으로 볼 때, 시장이 디바이스 도입 단계에서 데이터 기반 그리드 조정 단계로 이동하고 있으며, 고객 참여형 애플리케이션이 다음 가치 창출의 물결을 일으킬 준비가 되어 있음을 보여줍니다.
연방 인프라 법안에 따라 유틸리티 사업자의 투자 우선순위가 재조정되었습니다. 인프라 투자 및 고용법은 송전망의 내재해성 강화에 650억 달러를 배정하고, 스마트 미터를 선택적 업그레이드가 아닌 기본 자산으로 규정했습니다. 이상기후로 인해 전력망의 취약성이 부각되면서 소비자들의 태도는 회의에서 수요로 전환되고 있습니다. 주정부 위원회는 요금 책정 프로젝트에 고급 측정 인프라(AMI) 요건을 통합하는 경우가 증가하고 있으며, 도입 지연의 원인이었던 규제 장벽을 줄이고 있습니다. 미국 에너지부(DOE)의 '그리드 내재해성 및 혁신 파트너십' 프로그램은 스마트 미터와 유연성 솔루션을 결합한 프로젝트에 109억 달러를 배정했습니다. 매사추세츠 주에서는 2024년 3개 유틸리티 회사에 11억 7,000만 달러의 AMI 지출을 승인했습니다. 이러한 협력을 통해 자산의 유휴화 리스크가 해소되고, 주 전체 설치 일정이 가속화되고 있습니다.
시장은 다년간의 자본 조달을 보장하는 공식 기반 연방 배분으로 전환하여 규제 대상 유틸리티의 대차대조표 압력을 완화하는 혜택을 누리고 있습니다. GRIP 보조금은 현재 사이버 보안 준수와 개방형 표준 상호운용성을 평가 기준으로 삼고 있으며, 강화된 아키텍처를 가진 벤더에게 보조금을 지급하고 있습니다. 지역 전력 협동조합은 새로운 유력한 플레이어로서 공동구매 그룹을 통한 수요 집약으로 계량기 및 셀룰러 모듈의 대량 구매 할인을 획득하고 있습니다. 캘리포니아의 자가발전 장려 프로그램과 같은 주정부 보조금은 연방 자금의 효과를 더욱 높이고, 국내 조달 규정은 미국 공장을 운영하는 Badger Meter와 같은 제조업체에 대한 지출을 유도합니다. 예측 가능한 자금 공급 라인은 대규모의 연속적인 도입 블록을 촉진하고, 네트워크 효과와 데이터 수익화 가능성을 가속화합니다.
단기적으로 가장 큰 도입 억제요인은 공급망 건전성에 대한 관심의 증가입니다. NIST 사이버 보안 프레임워크 2.0은 벤더 심사를 단순한 체크리스트에서 이사회 차원의 거버넌스 과제로 격상시켰습니다. 유틸리티 회사는 주문 전에 제3자 침입 테스트를 의뢰하고 있으며, 조달 주기에 몇 달이 추가되고 있습니다. 주 위원회는 현재 AMI 신청 서류에 공식적인 사이버 위험 완화 계획을 요구하고 있으며, NARUC 지침은 특히 암호화, 키 관리, 사고 대응 절차서를 명시하고 있습니다. 유틸리티 회사는 도입을 완전히 중단하지는 않지만, 추가 된 관리 조치로 인해 도입 속도가 느려지고 하드웨어 이외의 비용이 증가할 것입니다.
2025년 기준, 스마트 전력량계는 미국 스마트 미터 시장에서 68.02%의 점유율을 유지했습니다. 이는 규제 의무, 비용 회수 보장, 정전 관리 및 원격 연결 및 연결 해제 기능을 통해 입증된 투자 회수율(ROI)에 의해 뒷받침됩니다. 이 부문에 구축된 벤더 생태계로 인해 유틸리티 회사는 유리한 가격 협상을 할 수 있으며, 이는 지방 지역의 대규모 일괄 입찰을 뒷받침하고 있습니다. 미국의 전력용 스마트 미터 시장 규모는 2031년까지 2,166만 대에 달할 것으로 예상되며, 그리드 엣지의 자동화 업그레이드에 발맞춰 지속적으로 확대되고 있습니다.
수도 계량기 분야의 성장이 가속화되고 있습니다. 지자체는 누수로 인한 벌금 증가와 가뭄 대책의 물 절약 목표에 직면해 있기 때문입니다. 단가는 전력 계량기보다 높지만, 수도 요금의 상승으로 투자 회수율이 개선되고 있습니다. 지하 매설물 저장소 내 전파 손실을 피하기 위해 셀룰러 모듈을 자주 채택하고 있으며, 클라우드 분석을 통해 수익화되지 않는 물의 양을 파악하고 있습니다. 이에 따라 상수도 분야에서는 2026년부터 2031년까지 114만 노드의 신규 도입이 예상되며, 전력계량기와의 수량 격차가 일부 축소될 전망입니다. 가스 및 열량계는 절대수, 상대수 모두 뒤쳐져 있고, 안전기준과 복잡한 설치 규정으로 인해 프로젝트 기간이 길어지고 있기 때문입니다. 그러나 LPWAN 기술의 발전과 방폭형 인클로저의 보급으로 2020년대 후반에는 지방 가스망에 도입이 활성화될 가능성이 있습니다.
2025년 기준 주택 부문이 전체 설치량에서 차지하는 비중은 71.74%이며, 이는 계량기 설치, 고객 포털, 수요 응답 등록을 통합한 종합적인 유틸리티 프로그램을 반영합니다. 표준화된 프로세스로 설치 작업자가 가가호호 방문이 가능하기 때문에 단위당 인건비를 낮게 유지하여 미국 스마트 미터 시장에서의 선도적 지위를 강화하고 있습니다. 다른 최종사용자들의 도입이 가속화되는 가운데, 2031년까지 미국 스마트 미터 시장에서 주택 사용자의 점유율이 70% 이하로 떨어질 가능성은 낮을 것으로 예상됩니다.
변압기, 커패시터 뱅크, 배전 피더에 설치되는 유틸리티 소유의 운영용 계량기는 4.78%의 CAGR로 성장하는 가장 빠르게 성장하는 분야입니다. 이 장치는 부하 프로파일, 전압 편차, 위상 불평형을 시각화할 수 있습니다. 유틸리티는 자본설비 업그레이드를 미루기 위해 분산형 에너지 자원(DER)의 수용능력 조사와 병행하여 이를 도입하고 있습니다. 상업 및 산업 분야에서의 도입은 견조하지만 눈에 띄는 성장세를 보이지 않고 있으며, 많은 대규모 시설에서는 이미 전력회사에서 제공하는 계량기를 대체하는 빌딩 관리 시스템을 도입한 상태입니다. 그러나 탄소정보공개기준의 추진으로 인해 기업들은 감사추적과 Scope 2 보고를 위한 전력회사 차원의 데이터 수집이 요구되고 있습니다.
The United States smart meter market size in 2026 is estimated at 25.94 million units, growing from 2025 value of 24.91 million units with 2031 projections showing 31.73 million units, growing at 4.12% CAGR over 2026-2031.
The surge is being underpinned by federal infrastructure spending, state-level renewable mandates, and a utility pivot away from legacy analog equipment. Hardware still captures most capital outlay, yet recurring service revenues are rising as data management, cyber-security monitoring, and advanced analytics shift to subscription models. Investor-owned utilities account for the bulk of new installations, but rural electric cooperatives are rapidly closing the gap after gaining direct access to federal funds. Communication technologies are diversifying-RF mesh remains the anchor, although cellular and NB-IoT connections are accelerating in sparsely populated service territories. Collectively, these threads indicate a market in transition from device deployment to data-driven grid orchestration, with customer engagement applications poised to unlock the next wave of value creation.
Federal infrastructure legislation has re-ordered utility investment priorities. The Infrastructure Investment and Jobs Act allocates USD 65 billion for grid resilience, positioning smart meters as foundational assets rather than optional upgrades. Consumer attitudes have flipped from skepticism to demand as extreme weather events spotlight grid fragility. State commissions increasingly embed Advanced Metering Infrastructure (AMI) requirements into rate cases, cutting the red tape that previously delayed rollouts. The DOE Grid Resilience and Innovation Partnerships program reserves USD 10.9 billion for projects that pair smart meters with flexibility solutions, while Massachusetts approved USD 1.17 billion of AMI spend across three utilities in 2024. This alignment eliminates stranded-asset risk and fast-tracks statewide installation schedules.
The market is benefiting from a shift toward formula-based federal allocations that guarantee multi-year capital availability, easing balance-sheet pressure for regulated utilities. GRIP grants now rank cyber-security compliance and open-standards interoperability as scoring criteria, tilting awards toward vendors with hardened architectures. Rural electric cooperatives are new power players, pooling demand under joint procurement groups to draw bulk discounts for meters and cellular modules. State match-funding-such as California's Self-Generation Incentive Program-further leverages federal dollars, while domestic-content rules channel spending to manufacturers like Badger Meter that operate U.S. plants. The predictable funding pipeline encourages larger, contiguous deployment blocks, accelerating network effects and data monetization potential.
The biggest near-term drag on rollouts is the heightened focus on supply-chain integrity. NIST Cyber-Security Framework 2.0 elevates vendor vetting from a checklist to a board-level governance issue. Utilities are commissioning third-party penetration tests before signing purchase orders, adding months to procurement cycles. State commissions now require formal cyber-risk mitigation plans in AMI filings; NARUC guidance specifically calls out encryption, key management, and incident-response playbooks. Utilities will not completely halt deployments, but the added controls slow volume ramps and raise non-hardware costs.
Other drivers and restraints analyzed in the detailed report include:
For complete list of drivers and restraints, kindly check the Table Of Contents.
Smart electricity meters retained a 68.02% share of the United States smart meter market in 2025. They rode on regulatory mandates, cost-recovery guarantees, and field-proven ROI from outage management and remote connect or disconnect functions. The segment's entrenched vendor ecosystem allows utilities to negotiate favorable pricing, which, in turn, supports large-block tenders in rural territories. The United States smart meter market size for electricity deployments is expected to reach 21.66 million units by 2031, expanding in lockstep with grid-edge automation upgrades.
Growth in water metering is accelerating because municipalities face mounting leakage fines and drought-related conservation goals. Although unit prices are higher than for electric meters, rising water tariffs improve the payback calculus. Cellular modules are frequently specified to avoid RF signal loss inside subterranean vaults, and cloud analytics pinpoint non-revenue water. Consequently, the water segment is projected to add 1.14 million new nodes between 2026 and 2031, closing part of the volume gap with electricity meters. Gas and heat meters trail in both absolute and relative terms because safety codes and complex installation rules extend project timelines. Still, advances in LPWAN and explosion-proof enclosures could invigorate rural gas deployments in the latter half of the decade.
The residential segment accounted for 71.74% of installations in 2025, reflecting wrap-around utility programs that combine meter rollout, customer portals, and demand response enrollment. Because installation crews can move house-to-house with standardized processes, per-unit labor costs are low, reinforcing the segment's leadership in the United States smart meter market. The United States smart meter market share for residential users is unlikely to drop below 70% before 2031, even as other end-users accelerate deployments.
Utility-owned operational meters-installed on transformers, capacitor banks, and distribution feeders-represent the fastest-growing slice, advancing at a 4.78% CAGR. These devices deliver visibility into loading profiles, voltage deviations, and phase imbalances. Utilities deploy them in tandem with DER hosting-capacity studies to defer capital upgrades. Commercial and industrial adoption remains healthy but not spectacular; many large facilities already sport building-management systems that substitute for utility-supplied meters. Still, the push toward carbon disclosure standards is nudging corporations toward utility-grade data for audit trails and Scope 2 reporting.
The United States Smart Meter Market Report is Segmented by Type (Smart Electricity Meters, Smart Gas Meters, Smart Water Meters, and Smart Heat Meters), End-User (Residential, Commercial, Industrial, and Utilities), Communication Technology (RF Mesh, Power Line Communication [PLC}, Cellular, and More), Component (Hardware, Software, and Services), and Geography. The Market Forecasts are Provided in Terms of Volume (Units).