


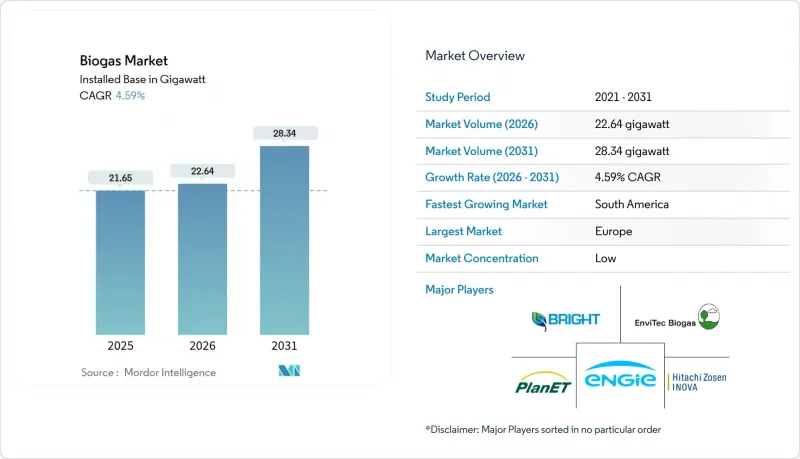
바이오가스 시장은 2025년에 21.65기가와트로 평가되었고, 2026년 22.64기가와트에서 2031년까지 28.34기가와트에 이를 것으로 예측됩니다.
예측 기간(2026-2031년)의 CAGR은 4.59%로 예상됩니다.

정책 인센티브의 성숙, 발전 전용 플랜트에서 재생가능 천연가스(RNG) 업그레이드 전환, 기업의 탈탄소화 노력 강화가 투자 기준을 재구성하고 있습니다. 수송용 연료 규제는 낙농 폐기물 및 음식물 쓰레기 유래 가스의 탄소 네거티브 특성을 평가하고, 전력회사는 태양광 및 풍력 중심의 송전망 안정화를 위해 조정 가능한 바이오가스를 통합하고 있습니다. 유럽은 고정가격임베디드제도(FIT)와 송전망 지원 바이오메탄 인프라로 선점 우위를 유지하고 있지만, 남미가 2030년까지 10%의 연평균 복합 성장률(CAGR)을 달성할 것이라는 전망은 새로운 정책 프레임워크가 후발 지역의 발전을 가속화할 수 있다는 것을 보여줍니다. 0.5-2MW의 중규모 설비가 여전히 신규 도입 용량의 대부분을 차지하고 있지만, 0.5MW 미만의 지역 플랜트는 분산형 발전 우대정책으로 접속 대기시간을 단축할 수 있는 지역으로 빠르게 확대되고 있습니다. 경쟁은 여전히 치열하며, EnviTec Biogas 등 기존 통합 사업자들은 자체 자금으로 설비 증설을 통해 점유율을 지키고, 신규 진출기업들은 모듈식 업그레이드와 탄소 포집 애드온에 집중하여 생산량 향상과 프리미엄 구매 계약 확보에 힘쓰고 있습니다.
생산량에 따른 세액공제가 기존의 고정가격임베디드제도를 대체하면서 개발사업자의 수익 전망이 장기화되고 있습니다. 2025년 미국 바이오가스 크레딧은 전력 판매보다 재생가능 천연가스(RNG) 업그레이드를 프로젝트의 중심축으로 삼고 있습니다. 인도의 압축 바이오가스 계획은 5,000개의 플랜트를 고정 임베디드가격으로 지원하고 있으며, 폴란드의 FEnIKS 프로그램은 EU 자금을 활용하여 9,300만 달러를 배분하여 추가 자본을 유치하고 있습니다. 이러한 진화하는 시책은 농촌의 소득 창출, 영양순환의 완성, 전력계통의 안정화를 실현하는 분산형 발전소를 촉진하고 있습니다.
현재 전력회사들은 태양광 발전 출력이 떨어지는 저녁 시간대 수요 공백을 메울 수 있는 안정화 자원으로 바이오가스를 평가했습니다. 기업들은 Scope 3 배출량을 줄이고 검증 가능한 탄소배출권을 확보하기 위해 재생가능 천연가스(RNG)를 조달하고 있습니다. 캘리포니아주의 마이너스 탄소 강도 점수로 인해 유제품 유래 RNG는 화석가스 대비 3-4배의 프리미엄 가격으로 거래되어 프로젝트의 내부 수익률을 향상시키고 있습니다. 제3자 검증 프레임워크는 투명한 메탄 회수 회계를 갖춘 플랜트에 대한 수요를 증가시키고 있습니다.
설치비용이 3,000-5,000달러/kW로 대규모 태양광 발전보다 높기 때문에 융자 조건이 복잡해집니다. EnviTec Biogas는 자체 자금으로 1억 유로를 조달하여 300GWh의 용량을 추가함으로써 이 문제를 극복했습니다. 소규모 개발사에서는 실현하기 어려운 규모의 경제 효과를 얻고 있습니다. 원자재 가격의 변동성과 운영의 복잡성으로 인해 금융기관은 보통 15-20%의 출자비율을 요구합니다.
2025년 기준 가축분뇨가 원료 공급량의 37.25%를 차지하며, 농장과의 장기 공급 계약의 기반이 되고 있습니다. 그러나 도시 지역의 매립 금지 정책으로 인해 유기성 폐기물이 소화조로 이동하고, 음식물 쓰레기량은 CAGR 7.12%로 증가함. 이를 통해 에너지 수입에 더해 폐기물 처리 수수료 수입이 추가됩니다. 농업 잔재와 하수 슬러지는 유연한 공동 소화 원료로 계절적 수급 변동을 완화합니다.
가축분뇨와 음식물쓰레기를 혼합하는 소화처리시설에서는 탄소와 질소의 비율이 균형을 이루기 때문에 휘발성 고형물 수율이 827리터/kg에 이르는 사례가 자주 발견됩니다. 지자체의 정책적 지원으로 도시폐기물 수거업체들은 적극적으로 소화처리시설과의 제휴를 모색하고 있으며, 사업자는 다년간의 게이트 요금 계약을 체결하여 재정적 기반을 강화할 수 있습니다.
2025년 기준 설치 설비의 59.10%를 습식 소화 시스템이 차지할 것으로 예상되며, 이는 수십년동안 형성된 공급업체 생태계와 낮은 설비 투자 규모를 반영합니다. 건식 소화는 2031년까지 연평균 복합 성장률(CAGR) 7.55%를 나타낼 것으로 예측됩니다. 고형분 25-35%를 허용하고 물 사용량이 적어 건조한 지역이나 고형분 폐기물에 적합하기 때문입니다.
가금류 분뇨, 정원 전정 찌꺼기, 포장된 음식물 쓰레기의 경우, 전처리 공정과 수도요금을 절감할 수 있는 건식 트윈 소화조가 점점 더 선호되고 있습니다. 2단계 호열 시스템은 최대 43% 더 높은 에너지 회수율을 달성할 수 있지만, 고도화된 제어 시스템의 추가 비용을 흡수할 수 있는 정교한 사업자만 가능합니다. 따라서 바이오가스 시장은 단일 지배적인 공정이 아닌 목적에 맞는 설계를 중심으로 분화되어 있습니다.
바이오가스 시장 보고서는 원료(농업잔재, 가축분뇨, 식음료 폐기물 등), 공정기술(습식 혐기성 소화, 건식 혐기성 소화, 매립지 가스 회수), 플랜트 용량(0.5MW 미만, 0.5-2MW, 2MW 이상), 용도(발전, 열공급, 차량연료/재생천연가스(RNG)), 지역(북미, 유럽, 아시아, 일본, 중국 등)으로 구분하여 분석합니다. 등), 지역(북미, 유럽, 아시아태평양, 남미 등) 별로 분류되어 있습니다.
유럽은 2025년 기준 바이오가스 시장 점유율의 65.10%를 차지하고 있으며, 기존의 고정가격임베디드제도(FIT)와 표준화된 바이오메탄 주입 코드가 금융기관의 프로젝트 리스크 감소에 기여하고 있습니다. 독일에만 400개 이상의 플랜트가 있으며, REPowerEU가 2030년까지 350억 입방미터의 바이오메탄 생산 목표를 세우면서 파이프라인 품질의 가스 수요를 더욱 증가시키고 있습니다. 덴마크는 6개의 바이오가스에서 선박 연료로 전환하는 플랜트, 해운 항로에 액화 바이오 LNG를 공급하고, 폐기물의 가치화와 국제해사기구(IMO)의 탄소 규제를 동시에 충족시키는 등 다각화의 좋은 예입니다.
남미는 2031년까지 연평균 복합 성장률(CAGR) 9.45%로 가장 빠른 성장세를 기록. 브라질 국영 페트로브라스(Petrobras)가 바이오메탄 조달 입찰을 실시했고, 아르헨티나에서는 농업폐기물 우대정책으로 2024년 82MW가 신설됐습니다. 그러나 파이프라인 연결과 신용 리스크가 여전히 규모 확대의 장벽으로 작용하고 있으며, 개발 사업자들은 폐기물이 풍부하고 즉각적인 인수가 가능한 사탕수수 공장이나 육류 가공 기지 주변에 집중하는 경향이 강해지고 있습니다.
북미는 전환점에 서 있습니다. 2024년 미국 내 2,500개 이상의 시설에서 140만 표준입방피트/분(scfm)을 생산할 것으로 예상되며, 농업 프로젝트가 처음으로 매립지 가스를 능가할 것으로 예측됩니다. 캐나다의 청정연료 규제는 캘리포니아의 LCFS를 모방하여 프리미엄 재생가능 천연가스 수요 기반을 확대하고 있습니다. 아시아태평양에서는 인도가 2030년까지 5,000개의 압축 바이오가스 플랜트 도입을 목표로 하고 있으며, 수요보장제도를 통해 지원을 받고 있습니다. 한편, 중국은 바이오가스를 농촌진흥계획에 포함시켜 소화조와 계통연계형 마이크로그리드를 결합하여 마을의 전기화를 추진하고 있습니다.
The Biogas Market was valued at 21.65 gigawatt in 2025 and estimated to grow from 22.64 gigawatt in 2026 to reach 28.34 gigawatt by 2031, at a CAGR of 4.59% during the forecast period (2026-2031).
Maturing policy incentives, a pivot from power-only plants to renewable natural gas (RNG) upgrading, and rising corporate decarbonization commitments are re-shaping investment criteria. Transport fuel mandates reward the negative-carbon attributes of dairy and food-waste gas, while utilities integrate dispatchable biogas to stabilize solar- and wind-heavy grids. Europe retains first-mover advantage because of feed-in tariffs and grid-ready biomethane infrastructure, but South America's 10% CAGR through 2030 underlines how fresh policy frameworks can accelerate late-entry regions. Mid-scale 0.5-2 MW facilities still dominate capacity additions, yet sub-0.5 MW community plants are scaling quickly where distributed-generation incentives cut connection queues. Competitive intensity remains high: established integrators such as EnviTec Biogas defend their share by self-funding capacity, whereas new entrants focus on modular upgrading and carbon capture add-ons to lift yields and secure premium offtake contracts.
Production-based tax credits are replacing legacy feed-in tariffs, lengthening revenue visibility for developers. The 2025 U.S. biogas credit pivots projects toward RNG upgrading rather than electricity sales. India's Compressed Bio-Gas scheme backs 5,000 plants with fixed offtake, and Poland's FEnIKS program allocates USD 93 million, leveraging European Union funds to crowd-in further capital. These evolving instruments favor distributed plants that unlock rural income, close nutrient loops, and stabilize the grid.
Utilities now value biogas as a firming resource that fills evening demand gaps when solar output fades. Corporates procure RNG to cut Scope 3 emissions and lock in verifiable carbon credits. Negative-carbon intensity scores in California let dairy RNG trade at premiums 3-4 times fossil gas, raising project internal rates of return. Third-party verification frameworks elevate demand for plants with transparent methane-capture accounting.
Installed costs of USD 3,000-5,000/kW outstrip utility-scale solar, complicating debt terms. EnviTec Biogas offsets this by self-funding EUR 100 million to add 300 GWh capacity, capturing economies of scale that smaller developers cannot. Because of feedstock volatility and operational complexity, lenders typically demand 15-20% equity.
Other drivers and restraints analyzed in the detailed report include:
For complete list of drivers and restraints, kindly check the Table Of Contents.
Livestock manure delivered 37.25% of feedstock input in 2025 and anchors long-term supply agreements with farms. Yet food-waste volumes expand 7.12% CAGR as cities adopt landfill bans that shift organics toward digesters, adding tipping-fee revenue to energy income. Agricultural residues and sewage sludge are flexible co-digestion recipes that smooth seasonal imbalances.
Digesters blending manure with food scraps regularly hit 827 L/kg volatile solids yields, thanks to balanced C:N ratios. Municipal policy support means urban waste haulers actively seek digester partners, letting operators lock multi-year gate-fee contracts that strengthen balance sheets.
Wet digestion systems owned 59.10% of 2025 installations, reflecting decades-long supplier ecosystems and lower capex. Dry digestion grows 7.55% CAGR to 2031 because it tolerates 25-35% solids and uses less water, ideal for arid locations or high-solids waste.
Technology selection correlates with feedstock profile: poultry litter, yard trimmings, or packaged food waste increasingly favors dry twin-digester lines that cut preprocessing steps and water bills. Two-stage thermophilic setups achieve up to 43% higher energy recovery, yet only sophisticated operators absorb the extra control-system costs. The biogas market, therefore, segments around fit-for-purpose designs rather than a single dominant process.
The Biogas Market Report is Segmented by Feedstock (Agri Residues, Livestock Manure, Food and Beverage Waste, and More), Process Technology (Wet Anaerobic, Dry Anaerobic Digestion, and Landfill Gas Recovery), Plant Capacity (Below 0. 5 MW, 0. 5 To 2 MW, Above 2 MW), Application (Electricity Generation, Heat Generation, Vehicle Fuel/RNG, and More), and Geography (North America, Europe, Asia-Pacific, South America, and More).
Europe held 65.10% of the biogas market share 2025 as legacy feed-in tariffs and standardized biomethane injection codes derisk projects for lenders. Germany alone hosts more than 400 plants, and the REPowerEU goal of 35 bcm of biomethane by 2030 further lifts pipeline-quality gas demand. Denmark illustrates diversification: six biogas-to-marine-fuel plants supply liquefied bio-LNG to shipping lanes, marrying waste valorization with IMO carbon rules.
South America records the fastest expansion at 9.45% CAGR through 2031 as Brazil's Petrobras issues biomethane tenders and Argentina adds 82 MW in 2024 under agricultural-waste incentives. However, pipeline access and credit risk still hamper scale-up, so developers often cluster near sugarcane mills or meat-packing hubs where waste is abundant and offtake immediate.
North America stands at an inflection point: over 2,500 U.S. sites generated 1.4 million scfm in 2024, and agricultural projects exceeded landfill gas for the first time. Canada's Clean Fuel Regulations mimic California's LCFS, widening premium RNG catchment. In Asia-Pacific, India targets 5,000 compressed biogas plants by 2030, supported by guaranteed offtake, while China embeds biogas within rural revitalization plans, pairing digesters with grid-connected micro-grids for village electrification.