


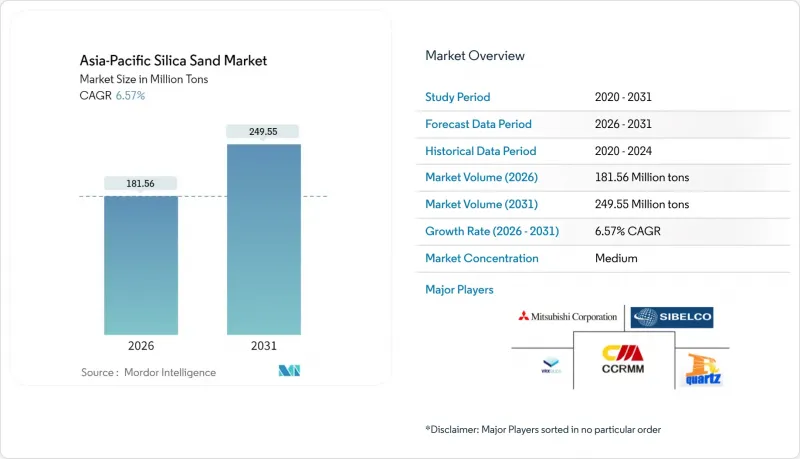
아시아태평양의 규사 시장 규모는 2026년에 1억 8,156만 톤에 달할 것으로 예측됩니다.
이는 2025년 1억 7,037만 톤에서 성장한 수치이며, 2031년에는 2억 4,955만 톤에 달할 것으로 예상됩니다. 2026년부터 2031년까지 연평균 성장률(CAGR) 6.57%로 예측됩니다.

유리 제조, 전자기기, 주조용, 건축자재 등 여러 수요처가 결합하여 이러한 확대가 지속되고 있습니다. 판유리 및 컨테이너 유리의 생산량이 지역의 급속한 도시화와 자동차 생산에 연동되어 유리용 모래는 여전히 주력 제품입니다. 동시에 반도체 제조업체들이 3나노미터 이하의 설계 규칙을 추구하면서 초순수 석영(HPQ) 등급은 틈새 시장에서 주류로 이동하고 있습니다. 경쟁이 심화되고 있습니다. 대규모 통합 광산 기업들은 자동화 및 환경 규제에 대한 대응을 가속화하여 프리미엄 계약을 확보하기 위해 노력하고 있습니다. 한편, 소규모 사업자들은 갈수록 강화되는 규제에 대응하기 위해 고군분투하고 있습니다. 중기적 기회는 태양전지용 유리, 첨단 전자제품, 그리고 동남아시아 전역에 걸친 장거리 공급 계약을 확보하는 국경을 초월한 인프라 프로젝트에 집중되어 있습니다.
태국 동부 경제회랑(EEC)은 2026년까지 연간 3-4%의 건설 성장을 견인하여 공공사업, 상업시설, 주거용 타워용 판유리 및 컨테이너 유리의 수요를 증가시킬 것으로 예상됩니다. 유리 제조업체는 규사가 원재료비의 60% 이상을 차지하는 주요 비용으로 인식하고 있으며, 수주잔량 증가는 모래 가격 상승으로 직결되고 있습니다. 2024년 수익률을 압박했던 재고 조정은 이미 반전되었으며, 아세안 지역의 주요 생산업체들은 대부분 2025년 납품을 위한 주문 증가를 보고하고 있습니다. 아세안 커넥티비티 구상에 기반한 국경 간 인프라 회랑은 말레이시아, 호주에서 중국 내륙의 플로트 유리 공장으로 장거리 운송을 증가시켜 주요 노선의 운송 능력 부족을 초래하고 있습니다. 유리 생산량은 경제 활동에 6-12개월의 시차를 두고 따라가기 때문에 이러한 회복 추세는 적어도 2027년까지 뚜렷한 생산량 증가 여지가 있음을 시사합니다. 에너지 절감형 저철분 유리는 그린 빌딩 기준의 얇은 두께의 유리 사양을 가능하게 하여 추가적인 프리미엄을 획득하고 있습니다.
전기자동차용 주조 기술에서 열팽창 계수가 점점 더 좁은 범위로 요구됨에 따라, 주조 업체들은 보다 균일한 입자 크기 분포를 가진 조정된 규사 블렌드로 전환해야 하는 상황에 직면해 있습니다. 2024년 전 세계의 70%를 차지할 중국의 청정에너지 주도로 알루미늄 주물과 연성철에 대한 수요가 확대되면서 지난해 이 지역 전체에서 약 910만 톤의 주조용 모래가 소비되었습니다. 첨단 주조 기계를 보유한 일본과 한국은 태국과 베트남에 턴키 주조 라인을 수출하고 있으며, 이로 인해 현지의 고품질 모래 등급에 대한 수요가 증가하고 있습니다. 이 영향은 복건성, 제주도, 세부에 집적된 풍력 터빈 허브 산업에도 영향을 미치고 있으며, 최종 가공 주조품에서는 나셀 하우징과 허브 조립을 위해 고실리카 함량의 모래가 다량으로 소비되고 있습니다. 2024년 청정에너지 제조 분야에서 2,350억 달러 규모의 투자 계획이 진행 중이며, 2030년까지 지속적인 모래 수요가 예상됩니다. 열충격 성능과 치수 정확도를 인증받은 생산업체는 배터리 제조업체 및 터빈 OEM으로부터 다년간의 공급 계약을 체결하고 있습니다.
단속 강화로 인해 강변 모래광산의 무등록 생산량이 감소하고 있습니다. 특히 인도에서는 실리카 분진에 노출되는 5,200만 명으로 추정되는 노동자 계층을 배경으로 안전보건 개혁이 추진되고 있습니다. 새로운 노출 한계치(흡착성 결정성 실리카: 50µ&g/m3)의 적용으로 습식 세정장치, 밀폐형 컨베이어 등의 설비 교체가 의무화되어 규제 준수 사업자의 경우 채굴 비용이 4-6% 증가하고 있습니다. 중국 당국은 수천 건의 소규모 채굴 허가를 취소하고, 중앙 관리 할당제를 통해 2025년 공급 격차 예측치를 63%에서 4%로 줄였습니다. 이러한 단속은 저가 경쟁을 배제하는 한편, 지역 내 공급을 압박하여 아시아태평양의 규사 시장이 규제를 준수하는 고비용 생산품에 의존하는 구조를 강화시키고 있습니다. 비공식적인 현물화물과 계약 등급 공급품의 가격 변동폭은 이미 확대되고 있습니다.
유리 등급 부문은 2025년 출하량의 63.88%를 차지하여 아시아태평양 규사 시장의 중추적인 역할을 강조하고 있습니다. 하이퍼 HPQ는 현재 극히 일부에 불과하지만, 2026년 이후 11.12%의 CAGR로 성장하여 2026년 이후 아시아태평양 규사 시장 규모에서 점유율을 확대할 것으로 예상됩니다.
공급의 안정성은 환경 기준을 충족하는 자동 선광 라인, 광학 선별, 청정에너지 가마로의 전환에 달려 있습니다. 원자력 수준의 순도를 인증할 수 있는 생산자는 반도체 공급망에 진입하고, 중견 공급업체는 태양전지 및 광학 분야를 타겟으로 삼습니다. 중순도의 인도네시아산 원료를 일본의 화학적 침출법으로 고도화하는 블렌딩 전략이 부상하고 있으며, 신규 개발 없이 협업으로 이익을 확보하는 방식을 보여주고 있습니다.
아시아태평양 규사 보고서는 등급별(주조/제련 등급, 유리 등급, 광학 유리 등급 등), 최종사용자 산업별(유리 제조, 주조, 화학 생산, 건설 등), 지역별(중국, 인도, 일본, 한국, 인도네시아, 태국, 말레이시아, 싱가포르, 필리핀, 베트남, 기타 아시아태평양)로 구분하여 조사했습니다. 필리핀, 베트남, 기타 아시아태평양)로 분류되어 있습니다. 시장 예측은 수량(백만 톤) 단위로 제공됩니다.
Asia-Pacific Silica Sand Market size in 2026 is estimated at 181.56 million tons, growing from 2025 value of 170.37 million tons with 2031 projections showing 249.55 million tons, growing at 6.57% CAGR over 2026-2031.
Multiple demand centers, including glass manufacturing, electronics, foundry applications, and construction materials, are converging to sustain this expansion. Glass grade sand remains the workhorse because flat and container glass output tracks the region's rapid urbanization and vehicle production. At the same time, hyper-purity quartz (HPQ) grades are transitioning from a niche toward mainstream status as semiconductor manufacturers push below the 3-nanometer design rule. Competitive intensity is rising as large, integrated miners accelerate automation and environmental compliance to lock in premium contracts while smaller operators struggle to meet tightening regulations. Mid-term opportunities cluster around solar glass, advanced electronics, and cross-border infrastructure projects that lock in long-haul supply contracts across Southeast Asia.
Thailand's Eastern Economic Corridor is driving 3-4% annual construction growth through 2026, lifting demand for flat and container glass across public works, commercial complexes, and residential towers. Glass manufactures treat silica sand as an essential cost component, often exceeding 60% of raw-material expenses, so rising project backlogs translate directly into higher sand uplift. Inventory corrections that hurt 2024 margins have already reversed, with most ASEAN producers reporting fuller order books for 2025 delivery. Cross-border infrastructure corridors under the ASEAN Connectivity vision are boosting long-distance shipments from Malaysia and Australia to inland Chinese float-glass lines, tightening freight capacity on favored routes. Given that glass output trails economic activity with a 6- to 12-month lag, the rebound indicates a clear volume runway through at least 2027. Energy-efficient low-iron variants secure additional premiums because they enable thinner glazing standards in green-building codes.
Electric-vehicle casting technology increasingly specifies narrow thermal-expansion bands, pushing foundries toward calibrated silica sand blends with tighter grain-size distributions. China's clean-energy leadership, 70% of global output in 2024, created a lift in aluminum and ductile-iron casting that consumed roughly 9.1 million tons of foundry sand region-wide last year. Japan and South Korea, home to advanced molding machinery, are exporting turnkey foundry lines into Thailand and Vietnam, prompting localized demand for premium sand grades. The effect cascades through wind-turbine hubs clustered in Fujian, Jeju, and Cebu, where final-machined castings absorb high silica volumes for nacelle housings and hub assemblies. Investment pipelines worth USD 235 billion in 2024 targeted clean-energy manufacturing, signalling durable sand flows into 2030. Producers that certify thermal-shock performance and dimensional accuracy are capturing multiyear supply contracts from battery and turbine OEMs.
Rising enforcement is shrinking unregistered output across riverine deposits, especially in India, where the estimated 52 million-worker cohort exposed to silica dust has spurred sweeping health-and-safety reforms. New exposure limits - 50 µg/m3 for respirable crystalline silica mandate capital upgrades like wet-scrubbing and enclosed conveyors, adding 4-6% to mining opex for compliant operators. In China, authorities canceled thousands of small-scale licenses, reducing projected 2025 supply gaps from 63% to 4% through centrally managed quotas. Such crackdowns eliminate low-cost competition but tighten local availability, reinforcing the Asia-Pacific silica sand market's reliance on compliant, higher-cost output. Price volatility has already widened between informal spot cargoes and contract-grade supplies.
Other drivers and restraints analyzed in the detailed report include:
For complete list of drivers and restraints, kindly check the Table Of Contents.
The glass grade segment captured 63.88% of 2025 shipments, underscoring its role as the backbone of the Asia-Pacific silica sand market. Hyper HPQ, though only a sliver of volume today, is projected to post an 11.12% CAGR, raising its stake in the Asia-Pacific silica sand market size from 2026 onward.
Supply security hinges on automated beneficiation lines, optical sorting, and clean-energy kiln conversions that meet environmental benchmarks. Producers able to certify nuclear-level purity enter the semiconductor chain, while mid-tier suppliers target solar and optics. Blending strategies are emerging, where moderate-purity Indonesian feedstock is upgraded via Japanese chemical leaching, showing how collaboration can capture margin without greenfield development.
The Asia-Pacific Silica Sand Report is Segmented by Grade (Foundry/Smelter Grade, Glass Grade Sand, Optical Glass Grade, and More), End-User Industry (Glass Manufacturing, Foundry, Chemical Production, Construction, and More), and Geography (China, India, Japan, South Korea, Indonesia, Thailand, Malaysia, Singapore, Philippines, Vietnam, and Rest of Asia-Pacific). The Market Forecasts are Provided in Terms of Volume (Million Tons).