


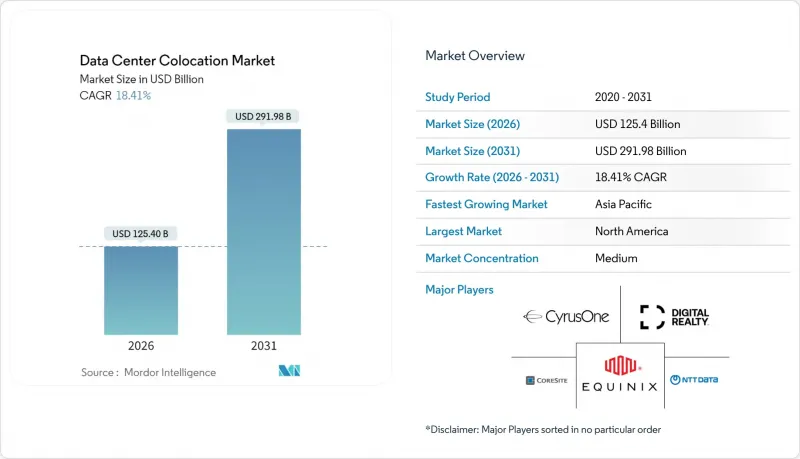
데이터센터 코로케이션 시장은 2025년에 1,059억 1,000만 달러로 평가되어 예측 기간(2026-2031년)의 CAGR 18.41%로 성장하며, 2026년 1,254억 달러에서 2031년까지 2,919억 8,000만 달러에 달할 것으로 추정되고 있습니다.
신뢰할 수 있는 중립적 용량을 필요로 하는 국가 차원의 AI 의무화, 분산형 실적를 필요로 하는 엣지 컴퓨팅의 도입, 40kW 이상의 랙 밀도를 위한 액체 냉각 지원 제품군의 주류화 등이 수요를 촉진하고 있습니다. 기업 소유 시설에서 서비스 기반 모델로의 전환이 가속화되는 가운데, 클라우드 연결 생태계, 신속한 도입 옵션, 에너지 효율적 설계를 제공하는 중립적 프로바이더가 계속해서 우위를 점하고 있습니다. 사모펀드에 의한 소유가 시장을 특징짓는 힘으로 작용하고 있으며, 높은 이자율에도 불구하고 사업자가 메가캠퍼스 프로젝트에 대한 신속한 자금 조달을 가능하게 하고 있습니다. 데이터센터 코로케이션 시장은 현재 모든 주요 산업 분야로 확산되고 있으며, 고밀도 AI 인프라와 컴플라이언스 대응 환경을 결합할 수 있는 프로바이더가 증가하는 수요를 확보할 수 있는 가장 유리한 위치에 있습니다.
하이브리드 IT 아키텍처가 기업의 로드맵을 주도하고 있는 가운데, 조직은 주요 퍼블릭 클라우드에서 한 번의 교차 연결만으로 연결되는 코로케이션 시설에 지연에 민감한 워크로드를 수용할 수 있도록 추진하고 있습니다. 평균 15-20개의 클라우드 플랫폼에 대한 직접 연결 포트는 필수 조건이 되고 있으며, 테넌트는 멀티 클라우드 구축시 데이터 전송 비용을 절감하고 규제 준수를 간소화할 수 있습니다. 고객이 플러그 앤 플레이 방식의 클라우드 근접성에 대해 20-30%의 가격 프리미엄을 지불하는 가운데, 상호 연결 서비스는 이미 시장 리더의 총매출의 18%를 차지하고 있습니다.
생성형 AI 트레이닝 클러스터는 랙당 40-80kW를 소비하는 것이 일반화되어 있으며, 기존 공랭식 홀에서는 지속 불가능한 전력 소비량입니다. 이를 위해 사업자는 액체 매니폴드 및 침지 탱크를 설치하여 기존 랙의 3-5배의 전력을 소비하는 GPU 리그를 지원하고 있습니다. 병렬적으로 진행되는 엣지 구축은 공장, 경기장, 통신 타워 근처에 마이크로 노드를 설치하고 다크 파이버 링을 통해 트래픽을 허브의 코로케이션 사이트로 집약하는 방식입니다. 이 허브 앤 스포크 토폴로지를 통해 기업은 중앙 집중식 관리를 유지하면서 실시간 분석을 수행할 수 있습니다.
2024년 미국 쉘앤코어의 평균 건설비용은 평방피트당 468.66달러로 상승했습니다. 이는 철강재, 배전반, 연료 가격이 금융비용과 연동하여 급등했기 때문입니다. 개발업체들은 조립식 모듈, 자산담보증권화, 우량 임차인과의 임대차 계약 등을 통해 비용 상승의 충격을 완화하고 있지만, 허가 신청 대기열로 인해 여전히 18-24개월의 납기가 소요되고 있습니다. 따라서 경쟁우위로서 재무구조의 강점이 중요해지고 있습니다. 민첩한 구매자는 경쟁업체가 구역 승인을 받기 전에 미리 건설 자금을 확보해 놓는 것입니다.
2025년 소매 시설은 데이터센터 코로케이션 시장의 52.18%를 차지했습니다. 이는 주로 기업이 풍부한 크로스 커넥트 환경과 턴키 서비스의 편리함을 중시하기 때문입니다. 한편, 단일 테넌트 하이퍼스케일러를 위한 도매 서비스는 더 큰 설치 면적을 제공하지만, 하이퍼스케일러가 자체 건설 능력을 강화함에 따라 이익률의 압축에 직면하고 있습니다. 모듈러/엣지포드 하위 부문은 18.74%의 연평균 복합 성장률(CAGR)로 성장하고 있으며, 업계에서 가장 빠르게 성장하고 있는 분야인 동시에 근접성 중심의 컴퓨팅으로의 전환을 강조하고 있습니다. 디지털 리얼리티(Digital Realty)와 같은 공급업체들은 기존 캠퍼스에 공장 생산 모듈을 추가하고, 표준화된 설계와 신속한 배포를 결합하여 서비스가 부족한 대도시 지역에 대응하고 있습니다. 이러한 하이브리드 시설을 통해 사업자는 자본을 보다 유연하게 배분하고, 워크로드 프로파일에 맞는 밀도 수준을 달성할 수 있으며, 기존 On-Premise에만 의존하던 수요처를 새로운 수요처로 끌어들일 수 있습니다.
소매 점유율 유지에 주력하는 사업자들은 관리형 네트워크 패브릭, 컴플라이언스 인증, AI 지원 케이지 등을 번들로 묶어 기존 소매와 홀세일의 경계를 모호하게 만들고 있습니다. 계약은 클라우드와 유사한 종량제 모델을 채택하는 경향이 강해지고 있으며, 예측 가능한 비용 조정을 원하는 클라우드 네이티브 스타트업을 끌어들이고 있습니다. 기업이 하이퍼스케일 클라우드와 엣지 포드로 워크로드를 이동하는 가운데, 데이터센터 코로케이션 시장은 독립된 시설 클래스가 아닌 코어에서 엣지까지의 연속체로서 실질적으로 구분되고 있습니다. 이 연속체에서 용량 계획을 조정하는 사업자는 교차판매 매출이 증가하고 고객 이탈률이 감소할 것으로 예측됩니다.
2025년 기준 Tier III 시설은 코로케이션 시장 규모의 55.26%를 차지할 것으로 예측됩니다. 이는 대부분의 기업 워크로드에서 중복성과 비용 효율성이 균형을 이루기 때문입니다. 그러나 금융 거래, AI 트레이닝, 생명 안전 용도에서는 Tier IV의 99.995% 가동률이 요구되며, 2031년까지 동 등급의 CAGR은 18.25%로 예측됩니다. 아키텍처 혁신에는 트라이모드 UPS 구성, 2N+1 냉각 토폴로지, 고장을 미연에 방지하는 예지보전 분석 등이 포함됩니다. 하이퍼스케일 임차인은 높은 자본집약도를 정당화하는 앵커리스를 체결하는 경우가 많아 사업자의 수익성 향상에 기여합니다.
금융 및 의료 분야 규제 당국은 현재 가동률 기준을 라이선스 요건에 포함시켜 사실상 Tier III를 최소 허용 기준으로 고정시키는 동시에 Tier IV에 대해는 벤더 승인 주기를 단축하는 특혜를 부여하고 있습니다. 이러한 컴플라이언스 효과로 인한 부가가치 증가로 사업자는 더 긴 계약 기간과 평방피트당 지속적인 매출 증가를 확보할 수 있습니다. AI 워크로드가 R&D에서 프로덕션 환경으로 이동함에 따라 Tier IV의 채택은 고성능 틈새 시장을 넘어 데이터센터 코로케이션 시장에서의 꾸준한 점유율 확대를 지원할 것으로 예측됩니다.
북미는 2025년에도 39.88% 수요를 유지하며, 수십년에 걸친 다크파이버 구축, 고밀도 인터넷 교환 기반, 클라우드 GDP를 지원하는 성숙한 하이퍼스케일 거점으로 인해 가장 큰 매출 기여를 하는 지역으로 남아있을 것입니다. 그러나 버지니아 북부와 실리콘밸리의 전력 공급 모라토리엄으로 인해 신규 수요는 피닉스, 콜럼버스, 몬트리올로 향하고 있습니다. 이들 지역에서는 24개월 이내에 100MW 단위의 전력 공급을 승인하는 것이 여전히 가능합니다. 이러한 2차 거점 지역에서는 지방정부가 면세 혜택과 신속한 허가 절차로 개발업체를 유치하여 기존 주요 도시권을 괴롭히는 토지 부족 문제를 완화하고 있습니다.
아시아태평양이 가장 빠르게 성장하고 있으며, 2031년까지 연평균 복합 성장률(CAGR) 24.95%를 나타낼 것으로 예측됩니다. 중국의 디지털 공공 인프라 구축 추진, 인도의 커머스 클라우드 배포, 일본의 엄격한 데이터 거주성 개정이 맞물리면서 지역 파이프라인에 메가와트 단위의 수주가 집중되고 있습니다. 싱가포르는 건설 할당량 제한을 재도입했으므로 수요의 잉여분은 조호르 주와 바탐 섬으로 흘러들어가고 있습니다. 한편, 호주, 인도네시아, 필리핀에서는 최초의 하이퍼스케일 투자가 실현되며, 2031년까지 이 지역이 다른 대륙을 능가하는 증설 용량을 달성할 것으로 예측됩니다.
유럽, 남미, 중동 및 아프리카 회랑이 제3의 성장층을 형성하고 있습니다. 암스테르담이 더 엄격한 에너지 절약 기준을 도입하는 가운데 프랑크푸르트, 더블린, 마드리드가 대륙의 잉여 수요를 처리하고 있습니다. 상파울루는 남반구의 허브로 부상하고 있으며, 리아드는 국가 자본을 활용하여 '비전 2030' 목표와 연계된 새로운 디지털 회랑을 구축하고 있습니다. 모든 지역에서 재생에너지의 가용성과 효율적인 전력망 상호 연결이 입지 선정의 결정적인 요인으로 작용하고 있으며, 풍력 자원이 풍부한 파타고니아와 태양광 자원이 풍부한 아랍에미리트는 다음 건설 러쉬에서 예상외로 매력적인 후보지로 떠오르고 있습니다.
The data center colocation market was valued at USD 105.91 billion in 2025 and estimated to grow from USD 125.4 billion in 2026 to reach USD 291.98 billion by 2031, at a CAGR of 18.41% during the forecast period (2026-2031).

Demand is fueled by sovereign-AI mandates that require trusted neutral capacity, edge computing deployments that need distributed footprints, and the mainstreaming of liquid-cool-ready suites for rack densities above 40 kW. The accelerating shift from enterprise-owned facilities toward service-based models continues to favor neutral providers that offer cloud-on-ramp ecosystems, rapid deployment options, and energy-efficient designs. Private-equity ownership has become a defining force, allowing operators to finance mega-campus projects quickly even as interest rates remain elevated. The data center colocation market now spans every major industry vertical, and providers able to combine high-density AI infrastructure with compliance-ready environments are best positioned to capture incremental demand.
Hybrid-IT architectures now dominate enterprise roadmaps, pushing organizations to house latency-sensitive workloads in colocation facilities that sit one cross-connect away from major public clouds. Direct-connect ports to an average of 15-20 cloud platforms are becoming table stakes, enabling tenants to shrink egress fees and simplify regulatory compliance for multi-cloud deployments.Interconnection services already contribute 18% of total revenue for market leaders as customers accept 20-30% price premiums for plug-and-play cloud proximity.
Generative-AI training clusters routinely draw 40-80 kW per rack, a power envelope unsustainable in legacy air-cooled halls. Operators are therefore fitting liquid manifolds and immersion tanks to support GPU rigs that devour 3-5 times the electricity of traditional racks. Parallel edge rollouts place micro-nodes near factories, stadia and telco towers, all funneling traffic back to hub colocation sites via dark-fiber rings. This hub-and-spoke topology lets enterprises run real-time analytics while maintaining centralized governance.
Average U.S. shell-and-core outlays climbed to USD 468.66 per sq ft in 2024 as steel, switchgear and fuel prices rose in tandem with financing costs. Developers are mitigating sticker shock through prefabricated modules, asset-backed securitizations and credit-tenant leases, but permitting queues still stretch delivery cycles to 18-24 months. Balance-sheet strength is therefore becoming a competitive advantage as nimble buyers pre-fund capacity before rivals even secure zoning approval.
Other drivers and restraints analyzed in the detailed report include:
For complete list of drivers and restraints, kindly check the Table Of Contents.
Retail facilities commanded 52.18% of data center colocation market share in 2025, largely because enterprises value the convenience of cross-connect-rich ecosystems and turnkey services. Wholesale offerings targeting single-tenant hyperscalers supply larger footprints but face margin compression as hyperscalers develop self-build capabilities. The modular/edge-pod subsegment, growing at a 18.74% CAGR, represents the industry's fastest-rising revenue stream and highlights the pivot toward proximity-driven compute. Providers such as Digital Realty have added factory-built modules to traditional campuses, combining standardized design with rapid deployment for under-served metros. These hybrid estates enable operators to allocate capital more flexibly, match density tiers to workload profiles, and capture new demand nodes that previously defaulted to on-premises closets.
Operators keen to defend retail share now bundle managed-network fabrics, compliance attestations, and AI-ready cages, blurring historical boundaries between retail and wholesale. Contracts increasingly feature consumption-based pricing models similar to cloud, attracting cloud-native startups seeking predictable cost alignment. As enterprises shuffle workloads between hyperscale clouds and edge pods, the data center colocation market is effectively segmenting into core-edge continuums rather than distinct facility classes. Providers that orchestrate capacity-planning across this continuum stand to expand cross-sell revenue and reduce churn.
Tier III facilities held 55.26% of the data center colocation market size in 2025 because they balance redundancy with cost efficiency for most enterprise workloads. Financial trading, AI training, and life-safety applications, however, require the 99.995% uptime of Tier IV, driving an 18.25% CAGR forecast for that class through 2031. The architectural shift includes tri-mode UPS configurations, 2N+1 cooling topologies, and predictive-maintenance analytics that pre-empt failures. Hyperscale tenants often sign anchor leases that justify the higher capital intensity, improving the return profile for operators.
Regulators in finance and healthcare now incorporate uptime standards into licensing, effectively hard-coding Tier III as the minimum acceptable standard while rewarding Tier IV with accelerated vendor-approval cycles. This compliance halo inflates perceived value, allowing operators to secure longer contract terms and higher recurring revenue per square foot. As more AI workloads transition from R&D to production, expect Tier IV adoption to expand beyond its high-performance niche, underpinning steady share gains in the data center colocation market.
Data Center Colocation Market Report is Segmented by Colocation Type (Retail, Wholesale), Tier Standard (Tier I and II, Tier III, Tier IV), Data Center Size (Small, Medium and More), End-User Industry (BFSI, IT and Telecom, E-Commerce and Retail, Government and Defense, and More), and by Geography(North America and Europe and More). The Market Forecasts are Provided in Terms of Value (USD).
North America retained 39.88% demand in 2025, North America remains the largest revenue contributor thanks to decades of dark-fiber build-out, dense internet-exchange fabrics, and a mature hyperscale footprint that underpins cloud GDP. Power moratoriums in Northern Virginia and Silicon Valley, however, are steering new demand to Phoenix, Columbus, and Montreal, where utilities can still green-light 100 MW blocks inside 24 months. Local governments in these secondary hubs court developers with tax holidays and expedited permitting, tempering the land-scarcity issues dogging legacy metros.
Asia-Pacific is the fastest mover, Asia-Pacific is forecast to post a 24.95% CAGR through 2031. China's digital-public-infrastructure drive, India's commerce-cloud adoption, and Japan's stringent data-residency amendments are all piling megawatt orders into regional pipelines. Singapore has reinstated a constrained build quota, funneling spill-over demand to Johor and Batam. Meanwhile, Australia, Indonesia and the Philippines are receiving first-time hyperscale commitments, positioning the bloc to outpace every other continent in incremental capacity through 2031.
Europe, South America and the Middle East-Africa corridor form the third growth tier. Frankfurt, Dublin and Madrid handle continental overflow as Amsterdam imposes stricter energy-efficiency hurdles. Sao Paulo is emerging as a southern-hemisphere hub, whereas Riyadh is leveraging sovereign capital to erect new digital corridors linked to Vision 2030 goals. Across all regions, renewable accessibility and streamlined grid interconnections are decisive site-selection filters, making wind-rich Patagonia and solar-dense Emirates unexpectedly attractive for the next wave of builds.