


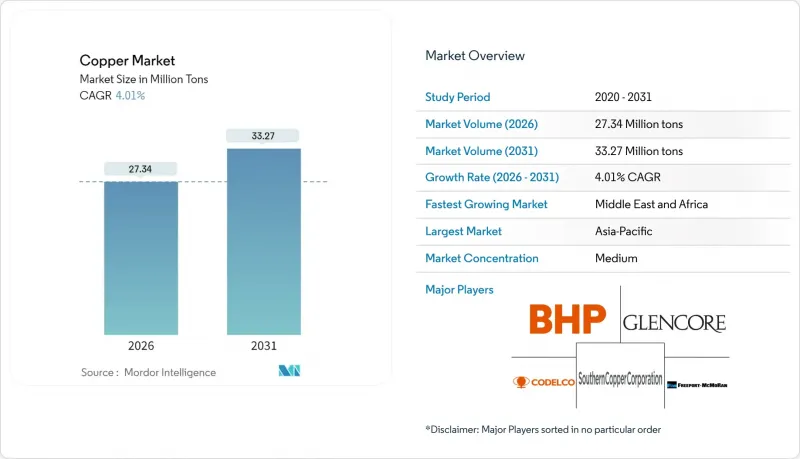
2026년 구리 시장 규모는 2,734만 톤으로 추정되며, 2025년 2,629만 톤으로부터 성장이 전망됩니다.
2031년 예측치는 3,327만 톤으로 2026-2031년 연평균 복합 성장률(CAGR) 4.01%로 확대될 전망입니다.

이러한 확대는 구조적인 전기화 추세, 재생에너지 프로젝트에서 구리 사용량의 5배 증가, 전력망 현대화 프로그램에 의해 형성되고 있으며, 이 모든 것이 결합되어 가뜩이나 타이트한 공급 파이프라인에 더 많은 부하를 가하고 있습니다. 전기자동차, 데이터센터 건설, 스마트 시티 구축으로 인한 수요 증가는 광석 품위 하락에도 불구하고 광산 기업이 기존 광산 확장에 박차를 가하도록 유도하고 있습니다. 재활용은 에너지 효율이 높고 탄소발자국이 적기 때문에 2차 공급은 강력한 조달 수단을 찾는 전력회사, 자동차 제조업체, 전자제품 제조업체에게 경제적으로나 평판 측면에서 매력적인 선택이 되고 있습니다. 구리 시장은 또한 투기적 거래와 관세의 불확실성으로 인한 가격 변동에 직면하고 있으며, 헤지 수단이 고가일 경우 제조업체는 장기 계약을 체결하거나 스크랩 원료로 다각화하도록 촉구하고 있습니다.
풍력 또는 태양광발전 1메가와트 용량은 기존 발전의 약 5배의 구리가 필요하며, 재생에너지 확대는 구리 시장의 가장 강력한 구조적 수요 요인으로 작용하고 있습니다. 3메가와트 육상 풍력 터빈에는 4.7 쇼트톤(약 4.3톤), 1메가와트 태양전지판에는 5.5 쇼트톤(약 5.1톤)의 구리가 소비됩니다. 전력망 업그레이드는 이 효과를 증폭시킵니다. 왜냐하면 고압직류송전(HVDC) 링크는 각각 수천 톤이 필요하고, 모든 대륙에서 전력망 강화 프로그램이 동시에 진행되고 있기 때문입니다. 중국의 국가 전력망 투자 계획과 유럽의 해상 풍력발전 백본은 구리 시장에 예측 가능한 공급량을 제공하는 다년간의 조달 주기를 보여주는 좋은 예입니다.
배터리 전기자동차(BEV)의 구리 사용량은 평균 183파운드(약 83kg)로 내연기관차(ICE) 모델의 51파운드(약 23kg)에 비해 전기화 운송은 구리 시장에서 3.6배 수요 증폭 효과를 가져옵니다. 이러한 차량 수준 수요는 충전 인프라와 시너지 효과를 발휘하며, 하나의 직류 급속 충전기에는 최대 17파운드(약 7.7kg)의 구리가 내장되어 있습니다. 자동차 OEM는 광산 개발 일정을 초과하는 생산 확대에 앞서 공급을 확보하기 위해 다년간의 오프 테이크 계약을 협상하고 있습니다.
경제협력개발기구(OECD) 회원국에서는 환경영향 평가, 물 관리 계획, 지역 협의 프로토콜 등 건설 전 단계부터 방대한 마일스톤이 부과되므로 광산 개발의 전 주기가 20년 이상 소요됩니다. 컴플라이언스 관련 비용은 프로젝트 예산에 5,000만 달러 이상을 추가하고 신규 개발 계획을 방해하므로 생산자들은 기존 광산의 확장이나 허가된 광상 인수를 우선시하는 경향이 있습니다.
2025년 기준 광산 공급량은 세계 총량의 84.15%를 차지하고 있으며, 2차 원료는 5.42%의 연평균 복합 성장률(CAGR)로 1차 생산량 증가율을 상회하는 성장세를 보이고 있습니다. 폐전자제품의 스크랩 등급이 광석 등급을 훨씬 능가하면서 도시 광산의 경제성이 향상됨에 따라 구리 재활용 시장 규모는 광산 공급을 능가하는 속도로 확대되고 있습니다. 2차 구리 생산은 최대 90%의 에너지 절감을 실현하고, 기업의 순 제로 목표 및 환경, 사회, 지배구조(ESG) 관련 금융 인센티브와 일치합니다.
재활용의 규모 확대는 쉽지 않습니다. 알루미늄과 철의 혼입으로 인해 검사 비용이 상승하기 때문입니다. 반제품 가공업체는월28,000달러를 품질 검사에 지출하고도 연간 약 25건의 출하를 여전히 거부하고 있습니다. 이러한 운영상의 어려움에도 불구하고 2024년 스크랩 공급량은 4.2% 증가하여 광산 생산량 증가율의 두 배에 달했습니다. 이는 구리 시장이 순환 경제의 원료 공급으로 지속적으로 전환하고 있음을 보여줍니다.
구리 시장 보고서는 공급원(광산 채굴 및 재활용), 최종 사용 산업(건축 건설, 인프라, 산업, 운송, 소비재 및 전자제품, 기타), 지역(아시아태평양, 북미, 유럽, 남미, 중동 및 아프리카) 별로 분류되어 있습니다. 시장 예측은 톤 단위로 제공됩니다.
아시아태평양은 2025년 소비량의 70.30%를 차지할 것으로 예상되며, 중국의 통합된 제련에서 가공까지의 생태계와 인도의 가속화된 전력망 구축에 힘입어 성장세를 이어갈 것으로 보입니다. 중국은 전 세계 제련 능력의 44%를 보유하고 있으며, 이 지역에 가격 결정력과 선물 곡선이 역류할 때 음극을 축적할 수 있는 능력을 가지고 있습니다.
북미와 유럽은 성숙된 시장이지만 갱신 단계에 접어들었습니다. 미국에서는 2000년 이후 4개의 제련소가 폐쇄되며, 2023년 34만 1,000톤의 정광을 해외 가공용으로 수출했으나, 인플레이션 억제법으로 제련 능력의 국내 회귀를 위한 자금이 확보되었습니다. 유럽의 해상풍력발전 계획은 고품질 음극 수입을 지원하는 HVDC 케이블의 조달을 필요로 하고 있으며, 엄격한 재활용 지침은 2차 제련소를 우대하여 하류 제조업체의 Scope 3 배출량 감소에 기여하고 있습니다.
중동 및 아프리카은 가장 빠르게 성장하는 시장으로, 국부펀드가 잠비아, 콩고민주공화국, 나미비아의 프로젝트에 자본을 투입하면서 CAGR 5.21%를 보일 것으로 예측됩니다. 걸프 국가들도 석유 수입 변동 위험을 헤지하기 위해 국내 하류 생산능력에 자금을 투입하고 있으며, 아프리카 원재료와 현지 봉강 및 관재 공장을 연결하여 구리 시장의 새로운 남남 공급망을 구축하고 있습니다.
Copper Market size in 2026 is estimated at 27.34 million tons, growing from 2025 value of 26.29 million tons with 2031 projections showing 33.27 million tons, growing at 4.01% CAGR over 2026-2031.
This expansion is shaped by structural electrification trends, the fivefold copper intensity of renewable-energy projects, and grid-modernization programs that collectively strain an already tight supply pipeline. Heightened demand from electric vehicles, data-center construction, and smart-city rollouts is pushing miners to accelerate brownfield expansions even as ore grades fall. Recycling's energy-efficiency advantages and lower carbon footprint make secondary supply economically and reputationally attractive to utilities, automakers, and electronics manufacturers seeking resilient procurement options. The copper market also navigates price swings triggered by speculative trading and tariff uncertainty, prompting manufacturers to lock in long-term contracts or diversify toward scrap feedstock when hedging options appear costly.
A single megawatt of wind or solar capacity demands roughly five times the copper used in conventional generation, turning renewable build-outs into the strongest structural pull on the copper market. A 3 MW onshore turbine requires 4.7 short tons of copper, while a 1 MW solar array consumes 5.5 short tons. Transmission upgrades magnify the effect because High Voltage Direct Current (HVDC) links draw thousands of tons each, and grid-strengthening programs run in parallel on every continent. China's State Grid investment plan and Europe's cross-border offshore-wind backbones exemplify multi-year procurement cycles that add predictable volume to the copper market.
Battery-electric cars average 183 lb of copper versus 51 lb in internal-combustion models, making electrified transport a 3.6X intensity lever on the copper market. This vehicle-level demand compounds with charging infrastructure, where a single direct-current fast charger incorporates up to 17 lb of the metal. Automotive original equipment manufacturers (OEMs) are negotiating multi-year offtake contracts to secure supply ahead of production ramps surpassing mine-development timelines.
Full-cycle mine development stretches past two decades in the Organisation for Economic Co-operation and Development (OECD) jurisdictions because environmental impact assessments, water-management plans, and community-consultation protocols impose extensive pre-construction milestones. Compliance outlays can add USD 50 million or more to project budgets and discourage greenfield proposals, motivating producers to favor brownfield expansions or acquire permitted deposits.
Other drivers and restraints analyzed in the detailed report include:
For complete list of drivers and restraints, kindly check the Table Of Contents.
Mining supplied 84.15% of global volume in 2025, but secondary feedstock is expanding at a 5.42% CAGR that outstrips primary output growth. The Copper market size for recycled material is rising faster than mined supply as the economics of urban mining improve once scrap grades in obsolete electronics exceed ore grades by an order of magnitude. Secondary copper production requires up to 90% less energy, aligning with corporate net-zero mandates and Environmental, Social, and Governance (ESG)-linked financing incentives.
Scaling recycling is not trivial because contamination from aluminum and iron inflates testing costs-semi-finished fabricators spend USD 28,000 per month on quality checks and still reject roughly 25 shipments annually. Despite these operational challenges, scrap supply grew 4.2% in 2024, double the rate of mined output, signaling a durable pivot toward circular-economy inputs for the copper market.
The Copper Market Report is Segmented by Source (Mining and Recycling), End-Use Industry (Building Construction, Infrastructure, Industrial, Transportation, Consumer Products and Electronic Equipment, and Others), and Geography (Asia-Pacific, North America, Europe, South America, and Middle East and Africa). The Market Forecasts are Provided in Terms of Volume (Tons).
Asia-Pacific commanded 70.30% of 2025 consumption, propelled by China's integrated smelting-to-fabrication ecosystem and India's accelerating grid build-out. China also houses 44% of global refining capacity, giving the region price-setting clout and the ability to stockpile cathode when futures curves turn backwardated.
North America and Europe remain mature but are entering renewal phases. The United States has closed four refineries since 2000, exporting 341,000 t of concentrate for overseas processing in 2023, yet the Inflation Reduction Act has earmarked funds to reshore smelting capacity. Europe's offshore-wind agenda mandates HVDC cable procurement that supports premium-grade cathode imports, while stringent recycling directives favor secondary smelters that lower Scope 3 emissions for downstream manufacturers.
The Middle East & Africa represents the fastest-growing arena, with a 5.21% CAGR forecast as sovereign-wealth investors channel capital into Zambian, DRC, and Namibian projects. Gulf states are also funding domestic downstream capacity to hedge against oil-revenue volatility, linking African feedstock with local rod and tube mills to create an emergent south-south supply chain for the copper market.