


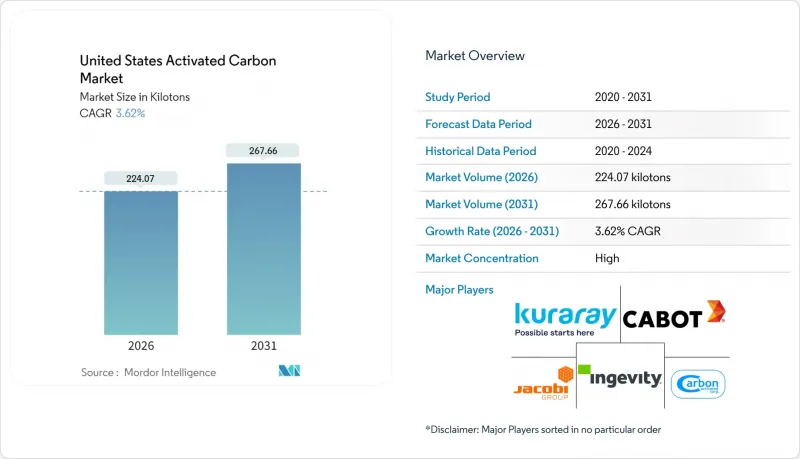
미국의 활성탄 시장은 2025년 216.24 킬로톤에서 2026년에는 224.07 킬로톤으로 성장하고, 2026-2031년 CAGR 3.62%로 성장을 지속하여, 2031년까지 267.66 킬로톤에 이를 것으로 예측됩니다.

이러한 꾸준한 성장은 과립형 활성탄을 PFAS 규제 준수 기준으로 삼는 연방 수질 규제, 장수명 흡착조를 위한 지자체 예산 확보, 석탄화력발전소 수은 대책 및 석유화학제품 휘발성 유기화합물(VOC) 처리의 대체 수요 증가에 직접적으로 기인하고 있습니다. 초당적 인프라법에 따른 인프라 보조금과 3M 및 듀폰 켐어스 코르테바(DuPont Chemours Corteva)와의 개별적인 합의금이 대규모 처리 프로젝트의 재원이 되고 있습니다. 한편, 자동차 증발가스 규제와 국내 API 제조가 두 번째 성장 요인으로 작용하고 있습니다. 이러한 구조적 호재에 대해 고에너지가 소요되는 신규 활성처리, 원료 가격 상승, 이온교환수지, 나노여과막 등 대체기술의 부상 등이 억제요인으로 작용하고 있지만, 생산능력 확대나 장기 공급계약 체결을 막지는 못하고 있습니다.
2024년 4월 시행되는 국가 1차 음용수 규제에 따라 PFOA 및 PFOS의 농도가 4ppt(10억분의 4)로 제한됨에 따라, 과립형 활성탄이 BAT(Best Available Technology)로서 빠른 속도로 조달되고 있습니다. 모니터링은 2027년 4월부터 시작되며, 2029년 4월까지 완전한 준수가 요구되며, PFAS 처리시설을 도입하지 않은 77%의 시스템은 3년 이내에 처리장치를 설치해야 합니다. 현재 일반적인 지자체 정수장에서는 9,000kg에서 45,000kg의 활성탄을 투입하여 9-12개월의 브레이크스루 주기로 운영되고 있습니다. 이로 인해 반복적인 수요가 발생하여 활성탄의 재활성 처리량이 증가하고 있습니다. 카본카본이 아메리칸워터와 체결한 9년간공급계약(50개소 이상 대상)은 재고확보, 열재 활성화?, 물류체계 확보가 시급하다는 것을 보여주는 좋은 사례입니다. 단쇄 PFAS와 높은 유기물 함량은 GAC의 가동 기간을 단축시키기 위해 분말 활성탄, 이온교환, 멤브레인 처리와의 하이브리드 방식을 채택하고 있지만, 이러한 전환으로 인해 총 처리비용은 감소하기는커녕 오히려 증가하는 추세입니다.
2024년 수은 및 대기유해물질 규제 재검토에 따라 갈탄화력 발전소의 수은 배출 제한이 1TBtu당 4파운드에서 1.2파운드로 강화되고, 55기의 석탄화력 발전소에서 100만 acf당 2-5파운드의 브롬화분말 활성탄 주입이 도입되었습니다. Arq의 정제 석탄 생산은 이미 확립된 톤 단위의 규모를 뒷받침하고 있으며, 플로리다, 일리노이, 켄튀르키예, 노스캐롤라, 텍사스, 웨스트버지니아의 개조 프로젝트가 단기적인 생산량을 뒷받침하고 있습니다. 이 촉진요인은 CAGR에 0.6% 기여하지만, 2028년 이후에는 석탄화력 폐지 및 탄소회수설비 개보수로 인해 노후화된 설비가 교체됨에 따라 그 영향력이 감소할 것으로 예측됩니다. EPA의 2025년 3월 재검토는 장기적으로 PAC(석탄재 재처리) 명령의 철회로 이어질 수 있는 정책 리스크를 초래할 수 있습니다.
버진 활성화는 800-1,000℃에서 가동되며, 석탄 유래 탄소 1kg당 최대 9.5kg의 CO2 환산 배출량이 발생합니다. 이는 열 재 활성화 시 3배에 해당합니다. 천연가스와 전력은 공장 비용의 최대 30%를 차지하기 때문에 전력회사는 17개의 미국 재활성화로에서 사용한 활성탄 층을 재활용하고 있으며, 현재 무해한 탄소의 66%가 재사용되고 있습니다. 카본 카본의 국내 5기 재가동 킬른과 JACOBI의 2025년 가격 전가는 에너지 인플레이션의 파급효과를 보여주고 있습니다. 마이크로파 및 진공 활성화 테스트는 50-70%의 비용 절감을 약속하지만, 아직 자본 집약적인 파일럿 단계에 있으며, 이 영향은 2028년까지 마이너스 0.7퍼센트 포인트의 부담 요인으로 남아있을 것입니다.
과립 활성탄은 2025년 출하량의 45.78%를 차지할 것으로 예상되며, EPA의 4 ppt PFAS 상한선을 충족하도록 설계된 도시 정화조에서 확고한 사용이 강조되고 있습니다. 베올리아의 스탠턴 공장과 같은 30 MGD의 단일 시설에서 42개의 컨테이너에 168만 파운드를 적재할 수 있으며, 이는 유틸리티가 장기 서비스 계약을 체결할 때 고정된 톤수 규율을 입증합니다. 0.6 mm에서 2.4 mm의 입도 제품은 압력 손실과 효율적인 재생의 균형을 이루며, 5 개의 국내 가마로 인해 재 활성화 루프를 위한 운송 거리가 짧아졌습니다. 미국의 활성탄 시장은 하이브리드형 경쟁 제품에 직면해 있지만, 대부분의 유틸리티 사업자는 PFAS 이외의 여러 오염물질, 즉 디오스민으로 인한 맛 문제부터 농업 폐수 중의 유기물까지 제거하기 위해 과립상 침대를 유지하고 있습니다.
캘리포니아 대기자원국이 증발 방지 캐니스터 기준을 강화하여 평생 동안 탄화수소 보유를 위해 균일한 매크로 기공을 요구함에 따라 압출 또는 펠릿화 제품이 4.18%의 가장 빠른 CAGR을 기록했습니다. 인제비티는 특수 탄소 판매의 70%를 자동차 분야에 의존하고 있지만, 2024년 매출은 OEM의 재고 조정과 아시아로부터의 수입 증가로 인해 5% 감소했습니다. 펠릿 수요는 상업용 공기 정화 분야에서도 확대되고 있으며, 직경 4mm의 원통형 펠릿은 송풍기의 에너지 소비를 줄일 수 있습니다. 카본엑스티는 2025년 1분기에 켄튀르키예주에서 압출라인을 가동하여 연간 1만톤의 생산능력으로 중서부 및 남동부 지역 고객에 대한 리드타임을 단축할 수 있게 되었습니다. 분말 활성탄은 맛과 냄새 대책의 계절적 변동과 석탄 수은 대책의 브롬화 PAC 주입 수요에 대응하고, 과립형 활성탄의 핵심 점유율을 훼손하지 않으면서 미국의 활성탄 시장에 균형 잡힌 제품 구성을 제공합니다.
미국의 활성탄 시장 보고서는 제품 유형(분말 활성탄, 과립 활성탄), 원료 용도(가스 정화, 수처리, 금속 추출, 의료 등), 최종 사용자 산업(수처리, 식음료, 의료, 자동차, 산업 공정, 기타 최종 사용자 산업)으로 분류됩니다. 시장 예측은 수량(톤) 단위로 제공됩니다.
The United States Activated Carbon Market is expected to grow from 216.24 kilotons in 2025 to 224.07 kilotons in 2026 and is forecast to reach 267.66 kilotons by 2031 at 3.62% CAGR over 2026-2031.
This steady climb links directly to federal water rules that now treat granular activated carbon as the benchmark for PFAS compliance, municipal budgets earmarked for long-life adsorption beds, and growing replacements across coal plant mercury-control and petrochemical VOC streams. Infrastructure grants under the Bipartisan Infrastructure Law and separate 3M and DuPont-Chemours-Corteva settlements are underwriting large-scale treatment projects, while automotive evaporative-emission standards and domestic API manufacturing add second-layer momentum. Against these structural tailwinds, high-energy virgin activation, feedstock inflation, and emerging substitutes such as ion-exchange resins and nanofiltration membranes act as counterweights yet have not stalled capacity expansions or long-term supply contracts.
The April 2024 National Primary Drinking Water Regulation established a 4 ppt limit for PFOA and PFOS, prompting the rapid procurement of granular activated carbon as Best Available Technology. Monitoring starts in April 2027, and full compliance is due by April 2029, forcing 77% of systems still lacking PFAS treatment to install beds within three years. A typical municipal plant now loads between 9,000 kg and 45,000 kg of carbon with 9- to 12-month breakthrough cycles, creating repeat demand and lifting carbon reactivation volumes. Calgon Carbon's nine-year supply pact with American Water covering more than 50 sites showcases the rush to lock in inventory, thermal reactivation slots, and logistics. Short-chain PFAS and high organic matter lessen GAC's run length, prompting hybrid pairs with powdered carbon, ion exchange, or membranes, yet this shift enlarges rather than shrinks total treatment spending.
The 2024 Mercury and Air Toxics review tightened lignite plant mercury limits from 4.0 lb to 1.2 lb per TBtu, prompting the use of brominated powdered carbon injections at 2-5 lb per million acf across 55 coal units. Arq's refined coal production underscores the tonnage scale already in place, while retrofit projects in Florida, Illinois, Kentucky, North Carolina, Texas, and West Virginia keep short-term volume buoyant. The driver contributes 0.6 percentage points to CAGR yet fades as coal retirements and carbon-capture retrofits displace aging units after 2028. The EPA's March 2025 reconsideration introduces policy risk that could lead to a reversal of long-run PAC orders.
Virgin activation runs at 800-1,000°C and emits up to 9.5 kg CO2-eq per kg of coal-based carbon, triple that of thermal reactivation. Natural gas and electricity account for as much as 30% of a factory's cost, encouraging utilities to recycle spent beds through 17 U.S. reactivation furnaces, where 66% of non-hazardous carbon now finds a second life. Calgon Carbon's five domestic reactivation kilns and JACOBI's 2025 price pass-throughs illustrate the ripple effects of energy inflation. Microwave and vacuum activation trials promise 50-70% savings but remain capital-intensive pilots, keeping this drag at -0.7 percentage points through 2028.
Other drivers and restraints analyzed in the detailed report include:
For complete list of drivers and restraints, kindly check the Table Of Contents.
Granular activated carbon accounted for 45.78% of 2025 shipments, a figure that underscores its entrenched use in municipal beds designed to meet the EPA's 4 ppt PFAS ceiling. A single 30 MGD facility, such as Veolia's Stanton plant, loads 1.68 million pounds across 42 vessels, showcasing the tonnage discipline utilities lock into when entering long-dated service contracts. Granular grades ranging from 0.6 mm to 2.4 mm balance pressure drop with efficient regeneration, and five domestic kilns keep trucking lanes short for reactivation loops. Although the United States activated carbon market faces hybrid contenders, most utilities retain granular beds for multi-contaminant removal beyond PFAS, from geosmin taste episodes to agricultural runoff organics.
Extruded or pelletized forms capture the fastest 4.18% CAGR as the California Air Resources Board boosts evaporative canister standards that require uniform macropores for lifetime hydrocarbon retention. Ingevity credits 70% of its specialty carbon sales to the auto sector, yet saw a 5% dip in 2024 revenue tied to OEM destocking and Asian imports. Pellet demand also grows in commercial air purification, where cylindrical 4 mm pellets reduce the energy required by blowers. Carbonxt placed its Kentucky extrusion line onstream in Q1 2025 at 10,000 tpa, cutting lead times to Midwest and Southeast clients. Powdered activated carbon maintains seasonal swings for taste and odor spikes and brominated PAC injections for coal mercury, giving the United States activated carbon market a balanced product mosaic without undermining granular's core share.
The United States Activated Carbon Market Report is Segmented by Product Type (Powdered Activated Carbon, and Granular Activated Carbon), Raw Material (Gas Purification, Water Purification, Metal Extraction, Medicine, and More), and End-User Industry (Water Treatment, Food and Beverage, Healthcare, Automotive, Industrial Processing, and Other End-User Industries). The Market Forecasts are Provided in Terms of Volume (tons).